mm UNIVERSITEDE
EJ SHERBROOKE
Faculty of Engineering
Department of Mechanical Engineering
PREDICTION OF THE SHAPE OF FATIGUE CRACKS PROPAGATING IN
THICK MONOLITHIC ALUMINIUM STRUCTURES REPAIRED USING
COMPOSITE BONDED DOUBLERS
PREDICTION DE LA FORME D'UNE FISSURE SE PROPAGEANT DANS
UNE STRUCTURE EPAISSE D'ALUMINIUM REPAREE A L'AIDE D'UN
RENFORT COLLE EN MATERIAUX COMPOSITES
Master of Applied Science Thesis
Mechanical Engineering
© Yan BOMBARDIER
1*1
Library and
Archives Canada
Published Heritage
Branch
395 Wellington Street Ottawa ON K1A0N4 CanadaBibliotheque et
Archives Canada
Direction du
Patrimoine de I'edition
395, rue Wellington Ottawa ON K1A0N4 CanadaYour file Votre reference ISBN: 978-0-494-42932-7 Our file Notre reference ISBN: 978-0-494-42932-7
NOTICE:
The author has granted a
non-exclusive license allowing Library
and Archives Canada to reproduce,
publish, archive, preserve, conserve,
communicate to the public by
telecommunication or on the Internet,
loan, distribute and sell theses
worldwide, for commercial or
non-commercial purposes, in microform,
paper, electronic and/or any other
formats.
AVIS:
L'auteur a accorde une licence non exclusive
permettant a la Bibliotheque et Archives
Canada de reproduire, publier, archiver,
sauvegarder, conserver, transmettre au public
par telecommunication ou par Plntemet, prefer,
distribuer et vendre des theses partout dans
le monde, a des fins commerciales ou autres,
sur support microforme, papier, electronique
et/ou autres formats.
The author retains copyright
ownership and moral rights in
this thesis. Neither the thesis
nor substantial extracts from it
may be printed or otherwise
reproduced without the author's
permission.
L'auteur conserve la propriete du droit d'auteur
et des droits moraux qui protege cette these.
Ni la these ni des extraits substantiels de
celle-ci ne doivent etre imprimes ou autrement
reproduits sans son autorisation.
In compliance with the Canadian
Privacy Act some supporting
forms may have been removed
from this thesis.
Conformement a la loi canadienne
sur la protection de la vie privee,
quelques formulaires secondaires
ont ete enleves de cette these.
While these forms may be included
in the document page count,
their removal does not represent
any loss of content from the
thesis.
Canada
Bien que ces formulaires
aient inclus dans la pagination,
il n'y aura aucun contenu manquant.
PROPRIETARY NOTICE
This document is the property of Martec Limited. It has been produced under contract number W8485-7-UCAD/01-BF for the Government of Canada and may be used for further development by the Government of Canada for any Government purpose except sale or licensing in commercial competition with Martec Limited. Complete use and disclosure limitations are contained in contract number W8485-7-UCAD/01 -BF.
A B S T R A C T
Developed in the 1970's, the composite bonded repair technology has been proven to be an efficient and reliable method for use on metallic aircraft structures. The purpose of this method is to slow or arrest crack growth, and thus, prolong the life of the structure. The technology has been successfully used in repair applications on both military and civil aircraft for fatigue enhancement and crack patching.
However, the installation of composite bonded repairs on aircraft must satisfy their damage tolerance requirements to ensure the safe operation of the aircraft. To meet these requirements, reliable crack growth prediction models are one of the tools required to assess the safety of the repaired structures without the need for long and expensive test programs. Thus, accurate prediction tools are the key that will help this technology to be integrated in structural integrity programs by the aeronautical industry.
In 2001, Martec Limited performed a research study intended to survey the available crack initiation and crack growth prediction tools for fatigue life evaluation of thick aluminium structures repaired using composite bonded doublers. The approach developed by Martec provided accurate crack growth predictions for the case of double-sided repairs, but did not provided the same level of accuracy for the single-sided repair configurations. It was therefore recommended by Martec to investigate the influence of crack shape on the crack growth predictions to achieve more accurate predictions for single-sided repair configurations.
Consequently, a new systematic crack growth prediction methodology, based on 3D finite element methods, was developed for thick structures repaired using composite bonded doublers. The methodology considers effects specific to bonded composite repairs, such as the effect of thermal residual strains caused by the curing process, the effect of out-of-plane bending, and the crack shape. The methodology was tested using three different experimental tests found in literature. The experimental crack shapes and crack growth data were compared with numerical results.
Good agreement between experimental and numerical crack growth predictions was obtained and the gain in accuracy acquired by including the shape of the crack was demonstrated.
As part of a collaborative program on fatigue prediction of bonded repairs, Martec Limited has initiated this research project in collaboration with the Department of National Defence (DND), the Chief of Research And Development (CRAD), and Sherbrooke University. This project was conducted at Martec, under the auspices of the partnership program for masters and doctoral studies in the workplace of Sherbrooke University.
R E S U M E
Developpee dans les annees 70, la reparation des structures metalliques a l'aide de materiaux composites s'est averee un moyen efficace et fiable pouvant etre employe sur des structures aeronautiques. Ce type de reparation a ete utilise avec succes sur des avions civils et militaires aim de reparer des dommages causes par la presence des fissures ou simplement pour ameliorer la vie en fatigue des structures tres sollicitees. Cette technique a done pour but de ralentir ou d'arreter la progression des fissures afin de prolonger la vie des structures.
Dans le but de repondre aux exigences des programmes de tolerance aux dommages visant a assurer la navigabilite de l'appareil, il est necessaire de developper des modeles fiables permettant de predire le taux de propagation des fissures se propageant sous des reparations en materiaux composites. Ces modeles permettraient d'etablir les intervalles d'inspections sans avoir recourt a des programmes de tests dispendieux. Un modele fiable de prediction de la propagation des fissures est un des elements cles qui aiderait a la reconnaissance de cette technologie dans le but qu'elle soit utilisee massivement dans 1'industrie aeronautique.
En 2001, Martec Limitee a complete une etude visant a evaluer differents outils d'initiation et de propagation des fissures dans des structures epaisses d'aluminium reparees a l'aide de renforts en materiaux composites. L'approche developpee avait permis d'obtenir de bons resultats dans le cas des reparations ou les deux cotes de la structure etaient repares, mais n'avait pas permis d'obtenir le meme niveau de fiabilite pour les reparations ou la structure n'etait reparee que d'un seul cote. II avait done ete recommande d'etudier l'effet de la forme de la fissure comme etant un facteur pouvant ameliorer la precision des modeles permettant de predire la vie en fatigue des structures reparees d'un seul cote.
Par consequent, une nouvelle methodologie permettant de modeliser la propagation des fissures a ete developpee pour le cas des structures epaisses reparees a l'aide de renforts en materiaux composites. L'approche choisie repose sur l'utilisation des methodes d'elements finis en trois dimensions et considere les effets suivants : les contraintes thermiques residuelles induites par la cuisson du renfort, les deplacements hors-plan et la forme particuliere de la fissure se propageant dans une structure reparee d'un seul cote. La methodologie fut validee en utilisant trois sources de donnees experimentales independantes et en comparant la forme des fissures et la vie en fatigue des coupons testes avec celles obtenues numeriquement.
La methodologie proposee a permis d'obtenir une correlation tres forte entre les resultats experimentaux de vie en fatigue et ceux obtenus numeriquement. De plus, il a ete demontre que l'ajout de l'effet de la forme des fissures se propageant dans des structures reparees d'un seul cote permettait d'ameliorer significativement la precision des analyses de vie en fatigue.
Cette etude presente done les resultats d'un projet de recherche amorce par Martec Limitee et menee en collaboration avec le Ministere de la Defense nationale, le centre de recherche et developpement pour la defense du Canada, ainsi que lTJniversite de Sherbrooke. Ce projet a ete realise dans le cadre du regime de partenariat pour etudes de maitrise et de doctorat en milieu de travail de l'universite de Sherbrooke.
ACKNOWLEDGMENTS
I would like to thank Dr. Rebecca Kaufman, Captain Barbarie Palmer, Captain Luc Sabourin, and Major Jean Brosseau from DND as well as Mr. Ken McRae from the National Research Council (NRC) for their time, involvement and contribution to this research project. Additional thanks to Dr. Martin Roth from the Quality Engineering Test Establishment (QETE) for his availability and his advice regarding the analysis of the fractured surfaces of the coupons tested by Martec. I would like to thank professor Dr. Kenneth W. Neale for his trust, and for giving me the freedom to express creatively my ideas, and for having been there when I most needed support.
I wish to extend my thanks to all of Martec's personnel for their encouragement, and for the positive working environment; Dr. James Warner, Martec's President, who has supported this research project and my supervisor Dr. Josef Eiblmeier for his technical contribution and direction. I also want to express my gratitude to Katherine Thompson in helping me with my writing. Special thanks to Jean-Francois Roberge from Martec, who generously provided technical support, judicious advice, and moral support in difficult times.
Finally, I dedicate this document to Dorota, who encouraged me to persevere with determination. I appreciated her understanding when I had to work nights and weekends on this project, knowing what this thesis meant to me.
This work was financially supported by the Chief of Research And Development (CRAD), through the Department of National Defence (DND), and by Martec Limited.
TABLE OF CONTENTS
1.0 INTRODUCTION 1
1.1 AIRCRAFT FATIGUE 1
1.2 REPAIRS IN AEROAUTICAL STRUCTURES 1
1.3 PROBLEM STATEMENT 3 1.4 RESEARCH PROJECT OBJECTIVES 4
1.5 REPORT OUTLINE 5 2.0 PROJECT METHODOLOGY 6
2.1 LITERATURE REVIEW 6 2.2 GATHERING EXPERIMENTAL DATA FROM PREVIOUS TESTS 7
2.3 ANALYSIS OF EXPERIMENTAL RESULTS 7 2.4 FINITE ELEMENT ANALYSES TO CORRELATE EXPERIMENTAL RESULTS 7
2.5 DEVELOPMENT OF CRACK SHAPE PREDICTION METHODOLOGY 7
2.6 METHODOLOGY VALIDATION 8
3.0 BACKGROUND 9 3.1 BACKGROUND IN FRACTURE MECHANICS 9
3.1.1 Fundamental concepts 9 3.1.2 Numerical methods in fracture mechanics 16
3.1.3 Fatigue life predictions 28 3.2 CRACK PROPAGATION IN THREE-DIMENSIONAL STRUCTURES 31
3.2.1 Two-dimensional crack propagation 31 3.2.2 Three-dimensional crack propagation 34 3.3 FATIGUE ANALYSIS OF BONDED REPAIRS 39
3.3.1 General 39 3.3.2 Closed form solutions 39
3.3.3 Numerical methods 40 3.3.4 Thermal residual strain effect 40
3.3.5 Bending moment resulting from single-sided repair 41 3.3.6 Crack shape prediction for single-sided repair 44
4.0 AVAILABLE CRACK GROWTH DATA FOR SINGLE-SIDED BONDED REPAIR 45
4.1 M A R T E C RESEARCH 4 5 4.1.1 Motivation 45 4.1.2 Coupon and patch descriptions 45
4.1.3 Test results 48 4.2 DERA RESEARCH 51
4.2.1 Motivation 51 4.2.2 Coupon and patch descriptions 51
4.2.3 Test results 52 A3 AFIT RESEARCH 55
4.3.1 Motivation 55 4.3.2 Coupon and patch descriptions 55
4.3.3 Test results 57 4.4 KAIST RESEARCH 59
4.4.1 Motivation 59 4.4.2 Coupon and patch description 59
4.4.3 Test results 60 4.5 SUMMARY AND CONCLUSIONS 63
5.0 DEVELOPMENT OF THE CRACK SHAPE PREDICTION METHODOLOGY 64
5.1 GENERAL DESCRIPTION OF THE METHODOLOGY 64
5.2 DAMAGED STRUCTURE 66 5.3 C A D MODEL PREPARATION OF THE CRACKED STRUCTURE 6 8
5.4 FINITE ELEMENT MODEL PREPARATION 6 9
5.4.1 General 69 5.4.2 Assumptions 70 5.4.3 Meshing 71 5.4.4 Boundary conditions 72
5.4.5 Patch disbondarea 73 5.5 NONLINEAR FINITE ELEMENT ANALYSIS 74
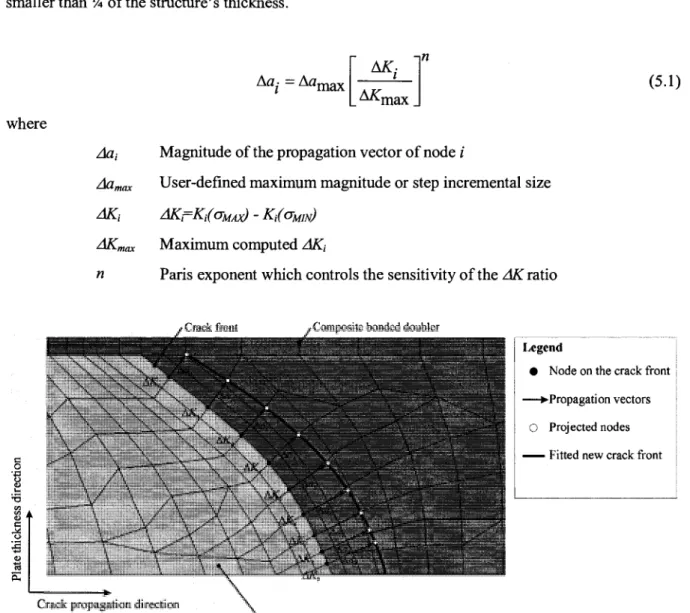
5.6 POST-PROCESSING 74 5.7 CRACK PROPAGATION 76 5.8 CRACK GROWTH PREDICTION 79
5.8.1 Calibration of the material and retardation models 80
5.8.2 Computation of the nonlinear corrections 80 5.8.3 Constant amplitude loading spectrum correction 81 5.8.4 Variable amplitude loading spectrum correction 84
5.9 SUMMARY 85 6.0 VALIDITY CHECKS 86
6.1 ACCURACY OF THE RESULTS 86 6.1.1 Global mesh refinement 87 6.1.2 Through thickness mesh refinement 88
6.3 SYSTEM PERFORMANCE 96
6.4 CONCLUSION 97 7.0 LEFM RESULTS 98
7.1 PARIS EXPONENT ESTIMATION 9 9 7.2 PREDICTED CRACK SHAPES 101 7.3 SENSITIVITY ANALYSES 103
7.3.1 Crack shape prediction sensitivity analyses 103
7.3.2 SIF sensitivity analyses 106
1A COMPUTED SIF AS A FUNCTION OF THE APPLIED LOAD 108
7.5 BETA FACTORS I l l 7.6 CONCLUSION 113 8.0 METHODOLOGY VALIDATION 114
8.1 GENERAL 114 8.2 CRACK SHAPE PREDICTIONS 114
8.2.1 General 114 8.2.2 Visual comparisons 114
8.2.3 Lag comparison 116 8.3 FATIGUE LIFE EVALUATION 117
8.3.1 General 117 8.3.2 Material model calibration 117
8.3.3 Nonlinear corrections 121 8.3.4 Crack growth predictions 124 8.4 SUMMARY AND CONCLUSION 129
CONCLUSION AND RECOMMENDATIONS 130 ANNEX A - DEVELOPMENT OF THE QUARTER-POINT ELEMENTS 133
ANNEX B - FRACTURED SURFACES OF THE MARTEC COUPONS 139 ANNEX C - MATERIAL MODEL PARAMETERS (AFGROW) 144
LIST OF FIGURES
Figure 1.1: Composite bonded doubler 2 Figure 3.1: Basic fracture modes [HERTZBERG 1996] 9
Figure 3.2: 2D stress components in the vicinity of the crack tip [SH 1974] 11
Figure 3.3: A cracked plate under mode I loading [BROEK 1988] 14 Figure 3.4: Plane stress and plane strain fracture [BROEK 1988] 15 Figure 3.5: Plane strain to plane stress fracture surface [HERTZBERG 1996] 15
Figure 3.6: Second order singular elements 17 Figure 3.7: Crack opening displacements 19 Figure 3.8: Second order quadrilateral quarter-point element 20
Figure 3.9: Line contour in surrounding region of the crack tip 23 Figure 3.10: J-integral path over a meshed part around the crack tip 25
Figure 3.11: Normal stress distribution ahead the crack tip 26
Figure 3.12: Fatigue crack growth response 29 Figure 3.13: Crack propagation in a 2D structure under mixed mode loading 31
Figure 3.14: Crack propagation in 3D under different fracture modes 35
Figure 3.15: 3D crack propagation plan 37 Figure 3.16: 3D crack propagation vector 37 Figure 4.1: MARTEC test coupon geometry (dimensions in mm) 46
Figure 4.2: MARTEC doubler geometry (dimensions in mm) 46
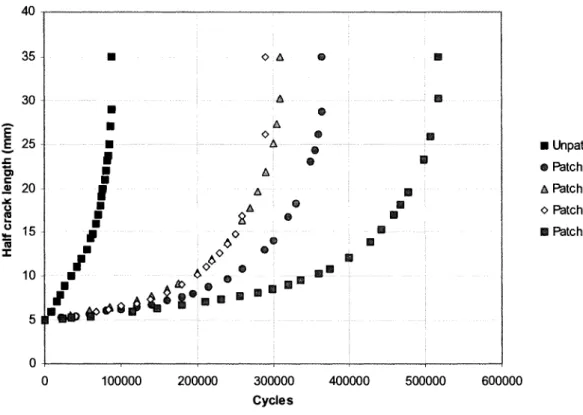
Figure 4.3: Fatigue life of the MARTEC coupons 48
Figure 4.4: Microscope setup at QETE 49 Figure 4.5: Experimental lag analysis (coupon G) 50
Figure 4.6: DERA test coupon geometry (dimensions in mm) 52
Figure 4.7: Fatigue life of the DERA coupons 53 Figure 4.8: Effect of stress ratio on the crack growth rate of the unpatched coupons (DERA) 53
Figure 4.9: AFIT test coupon geometry 56 Figure 4.10: Fatigue life of AFIT coupons 57 Figure 4.11: KAIST test coupon geometry (dimensions in mm) 59
Figure 4.12: Fatigue life of KAIST coupons 61 Figure 4.13: Failed coupon examination (KAIST) 62 Figure 5.1: Crack shape prediction methodology flowchart 65
Figure 5.3: 3D CAD model discretization (top view) 68 Figure 5.4: Repaired structure exploded view 69
Figure 5.5: Quarter-symmetric model 69 Figure 5.6: Typical crack tip mesh (cross-section of the coupon) 71
Figure 5.7: Multipoint constraints used to model the boundary conditions 72
Figure 5.8: Event scaling functions 73 Figure 5.9: Patch disbond area 73 Figure 5.10: 2D crack shape propagating in a 3D structure 75
Figure 5.11: AFGROW ID crack growth equivalent model 75 Figure 5.12: Typical SIF distribution across the thickness (MARTEC coupon) 76
Figure 5.13: Crack propagation in a structure repaired using single-sided repair 77
Figure 5.14: In-house crack propagation software 78 Figure 5.15: SIF as a function of the applied load in AFGROW 80
Figure 5.16: Constant amplitude loading correction scheme 82
Figure 6.1: Global mesh refinement (MARTEC) 87 Figure 6.2: Various through thickness mesh densities (MARTEC) 88
Figure 6.3: MARTEC SIF distribution across the thickness for various mesh densities 89 Figure 6.4: DERA SIF distribution across the thickness for various mesh densities 90 Figure 6.5: KAIST SIF distribution across the thickness for various mesh densities 90
Figure 6.6: MARTEC convergence analysis (in-plane mesh density) 91 Figure 6.7: DERA convergence analysis (in-plane mesh density) 92 Figure 6.8: KAIST convergence analysis (in-plane mesh density) 92
Figure 6.9: Centre crack test specimen 93 Figure 6.10: Numerical results of a centre crack test specimen 95
Figure 6.11: CPU time vs. number of DOF (NISAII - Nonlinear) 96 Figure 7.1: Crack shape predictions using different Paris exponents 98 Figure 7.2: Determination of the Paris exponent for the MARTEC coupons 100
Figure 7.3: Determination of the Paris exponent for the DERA coupons 100 Figure 7.4: Determination of the Paris exponent for the KAIST coupons 101
Figure 7.5: Crack shape prediction results 102 Figure 7.6: Definition of the lag as a function of the half crack length 103
Figure 7.7: Lag analysis of the MARTEC specimen for various Paris exponent values 104 Figure 7.8: Lag analysis of the DERA specimen for various Paris exponent values 105 Figure 7.9: Lag analysis of the KAIST specimen for various Paris exponent values 105
Figure 7.10: AK(a) for various Paris exponent values (MARTEC specimen) 106 Figure 7.11: AK(a) for various Paris exponent values (DERA specimen) 107 Figure 7.12: AK{a) for various Paris exponent values (KAIST specimen) 107
Figure 7.13: K(a,a) for n=0.0 (MARTEC) 108 Figure 7.14: K(a,a) for n=3.4 (MARTEC) 109 Figure 7.15: K(a,a) for «=0.0 (DERA) 109 Figure 7.16: K(a,a) for «=3.4 (DERA) 110 Figure 7.17: K(a,a) for «=0.0 (KAIST) 110 Figure 7.18: K(cr,a) for «=3.4 (KAIST) I l l Figure 7.19: Beta factors as a function of the crack length (MARTEC coupon) 112
Figure 7.20: Beta factors as a function of the crack length (DERA coupon) 112 Figure 7.21: Beta factors as a function of the crack length (KAIST coupon) 113 Figure 8.1: Experimental vs. predicted crack shapes for the KAIST coupon («=3.4) 114
Figure 8.2: Experimental vs. predicted crack shapes for the MARTEC coupon («=3.4) 115
Figure 8.3: Experimental vs. predicted lag for MARTEC coupon 116 Figure 8.4: Crack growth prediction of the MARTEC unpatched coupon 118
Figure 8.5: Crack growth curves for different stress-ratio (DERA coupons) 119 Figure 8.6: Crack growth prediction of the DERA unpatched coupon 119 Figure 8.7: Crack growth prediction of the KAIST unpatched coupon 120 Figure 8.8: Experimental vs. predicted crack growth for MARTEC patched coupon 124
Figure 8.9: Experimental vs. predicted crack growth for DERA patched coupon 125 Figure 8.10: Experimental vs. predicted crack growth for KAIST patched coupon 126 Figure 8.11: Experimental crack growth rates for MARTEC coupons (IARP03a spectrum) 127
Figure 8.12: Experimental crack growth rates for DERA coupons 128 Figure 8.13: Experimental crack growth rates for KAIST coupons 128 Figure A.l: Global coordinates system of a quarter-point element 134 Figure A.2: Isoparametric coordinates system of a quarter-point element 134
LIST OF TABLES
Table 3.1: Description of the fracture modes 10 Table 3.2: Crack propagation criteria for two-dimensional structures 32
Table 4.1: Material properties for MARTEC coupons 47 Table 4.2: Patch layout summary (MARTEC) 47 Table 4.3: Time to failure summary (MARTEC) 48 Table 4.4: Material properties for DERA coupons 52 Table 4.5: Time to failure summary (DERA) 54 Table 4.6: Material properties for AFIT coupons 56 Table 4.7: Life improvement from patch installation (AFIT) 57
Table 4.8: Material properties for KAIST coupons 60 Table 4.9: Time to failure summary (KAIST) 61 Table 4.10: Selection of the CG validation data 63 Table 5.1: Constant amplitude loading corrections 81 Table 5.2: Correction procedure for constant amplitude loading 83
Table 6.1: Dimensions of the test specimen 94 Table 6.2: Material properties of the test specimen (generic steel) 94
Table 7.1: Crack growth data for the estimation of the Paris exponent 99 Table 8.1: Polynomial regression coefficients for MARTEC spectrum correction («=0.0) 121
Table 8.2: Polynomial regression coefficients for MARTEC spectrum correction («=3.4) 121 Table 8.3: Correction table for the patched coupon crack growth predictions (DERA) 122 Table 8.4: Correction table for the patched coupon crack growth predictions (KAIST) 123 Table C.l: 7050-T7451 Harter-T material model parameters (MARTEC coupons) 145
Table C.2: 2024-T351 NASGRO equation parameters (DERA coupons) 146 Table C.3: 7075-T651 NASGRO equation parameters (KAIST coupons) 146
LIST OF ABBREVIATIONS
AFIT BC BE BFRP CCT CFG CFRP CG COD CPU CRAD CTE DCT DERA DET DND DOF DTA EDM EMRC ESA FE KAIST LEFM LIF MCCI MDN NASA NLR NRC QETEAir Force Institute of Technology Bending Correction
Boundary Element
Boron Fibre Reinforced Polymer Centre Cracked Test
Cornell Fracture Group
Carbon Fibre Reinforced Polymer Crack growth
Crack Opening Displacement Central Processing Unit
Chief of Research And Development Coefficient of Thermal Expansion Displacement Correlation Technique
Defence Evaluation and Research Agency (Farnborough) Displacement Extrapolation Technique
Department of National Defence of Canada Degrees Of Freedom
Damage Tolerance Approach Electrical Discharge Machining
Engineering Mechanics Research Corporation European Space Agency
Finite Element
Korean Advanced Institute of Science and Technology Linear Elastic Fracture Mechanics
Life Improvement Factor Modified Crack Closure Integral Ministere de la Defense Nationale
National Aeronautics and Space Administration National Lucht-En Ruimtevaartlaboratorium National Research Council of Canada Quality Engineering Test Establishment
RAAF SEDF SEM SERR SIF VCCI VCE
Royal Australian Air Force Strain-Energy-Density Factor Scanning Electron Microscope Strain Energy Release Rate Stress Intensity Factor(s) Virtual Crack Closure Integral Virtual Crack Extension
LIST OF SYMBOLS a a
P
da/dN ds Aa AK AKth AT E' Ei, E2, E3 e F G hP hR I J K K, KM Km, KHalf crack length
Coefficient of thermal expansion Beta factor
Crack growth rate
Differential arc element (J-integral) Infinitesimal crack length increment
User-defined crack propagation step increment Stress intensity factor difference (AK = Kmx - K^„) Threshold value of AK below which da/dN = 0 Difference between cure and ambient temperatures Effective elastic modulus
Modulus of elasticity defined along the principal directions Strain
Force
Strain energy release rate Plate thickness
Bonded repair thickness
Second moment of area of the section J-integral
Critical stress intensity factor
Stress intensity factors (mode I, mode II, mode III)
Stress state correction factor, where K = (3-4 v) for plane strain and K = (3- v)/(l + v) for plane stress
Element size along crack tip
fi23 Shear modulus defined along the principal directions Number of cycles
Paris exponent (da/dN=C(AK)n)
Walker exponent v23 Poisson's ratio
Potential energy of the system
Circumferential angle around crack tip Stress ratio (R = amin /amax)
Radial distance from crack tip
Radius of core region in the vicinity of crack Radius of plastic zone
Strain-energy-density factor Normal stress
Traction vector acting on coutour Shear Stress
Nodal displacement tangent to crack line Displacement vector
Nodal displacement normal to crack line Work
1.0 INTRODUCTION 1.1 Aircraft fatigue
When subjected to cyclic loading, the presence of defects in structural components reduces the operating life, unless the load level is below endurance limit. The Safe Life approach/design philosophy expects no cracking during pre-determined service life. Therefore, if cracking is found, engineers can decide to replace the damaged components and alter the design if necessary. The safe-life aircraft requires only minimal inspection of the structures during the intended service safe-life. This approach minimizes aircraft maintenance costs, but means that major components, or even the whole aircraft, must be retired at the end of the intended service life. Replacement of a damaged component can be very costly, in both man-hours and loss of aircraft serviceability, specially if disassembly of complex structures is required.
Alternatively to the Safe Life philosophy, the Damage Tolerance Approach (DTA) can be used after the Safe Life service life to allow the cracked structure to withstand a high proportion of its design loads after suffering corrosion, fatigue, accidental or impact damage by monitoring and slowing crack growth. The DTA allows the operator to set safe inspection intervals to detect and monitor any significant structural cracking before it becomes a flight safety concern. The operator can then safely fly the aircraft for potentially much longer periods than otherwise permissible under a safe life approach.
The DTA has been successfully used for years and has extended the life of Canadian Air Force aircraft fleets, while reducing their operation costs. DTA requires a fundamental understanding of fracture mechanics, including the critical crack length as well as the crack propagation rate in order to determine the inspection interval.
1.2 Repairs in aeroautical structures
One efficient means of extending the life of aircraft components is to retard or arrest the crack growth. Traditional repair methods involve the use of riveted metallic reinforcements or patches. Although these methods give good results in most cases, they require extra fastener holes, which create more stress concentrations in an already weakened structure. Furthermore, poorly drilled holes may create additional crack nucleation sites. Other operational damage, such as fretting and corrosion, can also produce failure of the components. Composite bonded repair technology was initially developed by DSTO as a less invasive repair technique [DSTO 1999].
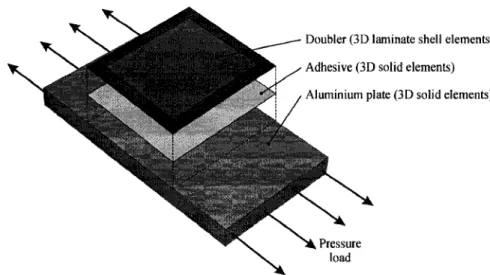
Depending on the patch design and the quality of the installation, adhesively bonded repairs provide an efficient way to reduce stress levels in the damaged structure by introducing minimum stress concentrations into the structures. Composite bonded repairs to metallic aircraft structures are generally used for fatigue enhancement, crack patching, as well as different kinds of damage repairs, such as corrosion damage or machining defects. The bonded doublers are installed to reduce the stresses at critical locations. Over a cracked structure, the repair reduces the stress intensity factors and the crack opening displacements at the crack tip. The doublers also restore the static strength and stiffness of a damaged part. The patch can be applied with little damage to the surrounding structure, and can be removed if required. This type of repair is composed of a composite doubler and an adhesive, which are bonded to the substrate material as shown in Figure 1.1. The repair consists of bonding the composite doubler to the substrate material using a high performance adhesive.
Composite doubler Adhesive
Crack
Surface treatment
Substrate structure
Figure 1.1: Composite bonded doubler
In addition to the advantages mentioned above, there are many other advantages of using bonded composite repairs instead of using conventional metallic riveted repairs. These advantages include:
a) Minimal working access and tooling is required, b) Sealed interface that reduces risks of crevice corrosion, c) Easily applied in the field,
d) No fretting induced fatigue (no mechanical fasteners), and
The main disadvantages of using this technology are that very careful preparation of bonded surfaces is required. Heat and pressure are also required to cure the adhesive. Due to the low relative thermal expansion coefficient compared to metals such as aluminium, composite bonded repairs made of carbon or boron fibres induce thermal residual stresses during the curing process. Finally, inspection and crack monitoring are more complex as the patch is installed over the damaged structure.
1.3 Problem statement
Since the 1970's, composite bonded repair technology has been proven to be an efficient and reliable method to use on metallic aircraft structures to prevent, hinder or arrest crack growth. The technology has been successfully used in repair applications on both military and commercial aircraft for fatigue enhancement and crack patching.
Repairs on aircraft must show that the resulting structure satisfies the DTA requirements used to manage the safe operation of aircraft. To meet these requirements, reliable crack growth predictions are required to assess the safety of the repaired structure without the need for long and expensive test programs. Thus, accurate prediction tools are the key to ensure that this technology is fully understood and appropriate for use by the aeronautical industry.
In 2001, Martec Limited [ROBERGE et al. 2001] completed a research project intended to survey the available crack initiation and crack growth prediction tools for the fatigue life evaluation of thick aluminium structures repaired using composite bonded doublers. As a result, a 3D finite element based methodology was developed and results were correlated with experimental data. This methodology included the thermal residual strains induced during the installation of the doublers, and the out-of-plane bending due to the asymmetry of single-sided repairs. Good agreement with experimental data was found for double-sided repairs, but the predictions for single-sided repair configurations proved to be less accurate. The research recommended further investigation into the influence of the crack shapes on crack growth predictions to achieve more accurate predictions for single-sided repair configurations. Therefore, this research project was initiated to investigate the impact of including the crack shape effect on fatigue life predictions.
As part of a collaborative program into fatigue prediction of bonded repairs, Martec Limited initiated the current research project in collaboration with the Department of National Defence, and Sherbrooke University. This project was conducted at Sherbrooke University, under the auspices of a partnership program for masters and doctoral studies conducted in the workplace.
1.4 Research project objectives
The objectives of this research project were as follows:
a) To improve the understanding of fatigue life estimation techniques of metallic structures repaired with composite bonded doublers,
b) To develop a systematic methodology for the evaluation of the fatigue life of thick monolithic structures repaired using bonded composite doublers. The effect of the crack shape will be investigated for single-sided repairs,
c) To quantify the impact of including the crack shape effect on the fatigue life predictions, and
1.5 Report outline
This report was structured using the following outline:
Chapter 2: Proj ect methodology
This section presents the methodology used to conduct this research project that was initially defined in the project statement of work, and explains how the research project was conducted.
Chapter 3: Background
The literature review focussed on the following topics: a) Fundamental concepts in fracture mechanics,
b) Crack propagation in three-dimensional structures, and c) Fatigue analysis of bonded repairs.
Chapter 4: Available crack growth data for single-sided bonded repair
This section presents the available experimental crack growth data for thick aluminium structures repaired using single-sided composite bonded doublers. Chapter 5: Development of the crack shape prediction methodology
This section presents the FE based crack shape prediction methodology developed to predict the crack shape.
Chapter 6: Validity checks
This section presents accuracy and correctness checks performed on the finite element models.
Chapter 7: Linear elastic fracture mechanics results
This section presents the predicted crack shape geometries and the computed stress intensity factors as a function of the crack length.
Chapter 8: Methodology validation
This section compares the crack shapes and the crack growth predictions with the available experimental results.
Chapter 9: Conclusion and recommendations
This section presents the conclusion and the recommendations for further research in this topic area.
2.0 PROJECT METHODOLOGY
This chapter is intended to present the methodology that was initially defined in the project statement of work, and explains how the research project was conducted. The project is divided into the following sections:
a) Literature review,
b) Gathering experimental data from previous tests, c) Analysis of experimental results,
d) FE analyses to correlate experimental results,
e) Development of crack shape prediction methodology, and f) Methodology validation.
2.1 Literature review
To predict the shape of fatigue cracks propagating in thick aluminium structures, it was necessary to first understand the fundamental concepts of fracture mechanics. The concepts covered include:
a) Stress intensity factors, b) Fracture modes, c) Singular stress fields,
d) Linear elastic fracture mechanics assumptions, e) Stress state in the vicinity of the crack tip, and f) Crack growth models to predict fatigue life.
Numerical aspects of fracture mechanics were also investigated to understand how to correctly capture the singular stress field in the vicinity of the crack tip. Numerical methods used to compute stress intensity factors were also covered in the literature review. The concepts behind the simulation of a 3D arbitrary crack propagating in a thick structure were reviewed. Finally, papers related to the analysis and testing of thick structures repaired using composite bonded doublers were collected.
2.2 Gathering experimental data from previous tests
Existing crack growth data for thick sections repaired using single-sided composite bonded doublers was collected in order to validate the crack shape prediction methodology. The single-sided composite bonded repair cases were selected as this repair configuration generates complex crack shapes. Experimental data of centre-cracked specimens producing Mode I only fracture was collected. For validation purposes, the crack growth data and any crack shape information were collected.
2.3 Analysis of experimental results
Using the experimental data found in the literature, the crack shape information was extracted and analysed to correlate any trend between the coupon configuration parameters (geometry, stiffness ratio of the patch, applied load, curing temperature, etc.) and the observed crack shapes. The available crack shape information was very limited and it was impossible to correlate the observed geometric crack shape with the specimen configurations.
2.4 Finite element analyses to correlate experimental results
It was originally planned to use the crack shapes extracted from the experimental data found in literature to create representative finite element models that would attempt to replicate the experimental results. This task was dependant on the amount of crack shape information found from each experimental test, and therefore was not performed due to the limited amount of information on the crack shapes.
2.5 Development of crack shape prediction methodology
Existing crack growth prediction methodologies were reviewed prior to developing a new methodology. In 2001, Martec developed a methodology for the evaluation of the fatigue life of structures repaired using composite bonded doublers [ROBERGE et al. 2001]. However, it was conceptually impossible to integrate the crack shape effect in the existing methodology. Therefore, a new approach was specifically developed for this research project that included the effect of the crack shape in addition to the out-of-plane bending effect and the thermal residual strains.
The development of the new methodology required the use and the integration of multiple tools taken from relevant literature, such as:
a) Geometry creation,
b) Model meshing and preparation, c) Model solving,
d) Extraction and analysis of the results, e) Propagation of the crack, and
f) Evaluation of the crack growth.
2.6 Methodology validation
Numerical results, such as crack shape geometry and fatigue life, were compared to experimental data found in literature to evaluate the developed methodology. The validation of the crack propagation methodology was then essentially based on the capability of reproducing experimental using numerical simulation.
3.0 BACKGROUND
3.1 Background in fracture mechanics
Introduced in 1920 by Griffith, fracture mechanics has matured to become a science that provides the theoretical knowledge required to quantify the effects of cracks in structures. Fracture mechanics provides tools to assess the structural integrity of structural components and thus, is the key to damage tolerance programs for aircraft. Since 1920, major developments in fracture mechanics have been made possible by the advancement of computers for solving complex fracture mechanics damage tolerance problems for aircraft, such as the evaluation of fatigue life of structures repaired using composite bonded doublers. This section is intended to present fundamental concepts and available numerical methods used in fracture mechanics.
3.1.1 Fundamental concepts
Although fracture mechanics is a complex science, the analysis of a structural component is often based on the computation of the Stress Intensity Factors (SIF), which quantify the severity of the structural damage. Based on earlier work performed by Westergaard, Irwin [IRWIN 1957] published solutions for crack-tip stress distribution associated with three independent failure modes of fracture. The three fracture modes are illustrated in Figure 3.1 and described in Table 3.1.
Mode I Mode II Mode III Figure 3.1: Basic fracture modes [HERTZBERG 1996]
Table 3.1: Description of the fracture modes Fracture modes Model Mode II Mode III Descriptions
Mode I, known as the opening or tensile mode, exists when the crack surfaces move directly apart. This mode is the most encountered in engineering problems [HERTZBERG 1996].
Mode II, known as the sliding or in-plane shear mode, exists when the crack surfaces slide over one another in a direction perpendicular to the leading edge of the crack. This mode is found less frequently on its own in engineering problems but more often in combination with Mode I, referred to the mixed Mode I-II [HERTZBERG 1996].
Mode III, known as the tearing or anti-plane shear mode, exists when the crack surfaces move relative to one another parallel to the leading edge of the crack [HERTZBERG 1996].
The SIF are compared to the toughness of the material to assess if the propagation of the crack is stable or unstable when the SIF reaches a critical threshold value. The critical SIF refers to the plane stress or plane strain fracture toughness. The crack will extend, or propagate, under a stable regime for SIF values below the critical value. The fracture behaviour of a given structure is controlled in accordance to many aspects: the geometries of the structure and the flaw, the material properties, the stress level, the fracture mechanism (plain strain or plane stress fracture state), etc. [HERTZBERG 1996]. Equation (3.1) presents the relation between the SIF variation, AK, the stress variation, Aa, the geometry of the structure, /?, and the crack length, a.
AK^fi-Aa-yfxa (3.1)
The geometric factor, /?, can be estimated using closed form solutions or numerical simulations. A wide range of SIF closed form solutions were derived from the Linear Elastic Fracture Mechanics (LEFM) and many handbooks providing analytical solutions are available in the literature [ROOKE et al. 1976, and TADA et al. 1985].
The LEFM assumption is often used to simplify the analysis of cracked bodies. This assumption is valid when the size of the plastic zone is small compared to the thickness of the structure. Using this
components in the vicinity of the crack tip are illustrated in Figure 3.2 using a polar coordinates system.
*
t
f
Figure 3.2: 2D stress components in the vicinity of the crack tip [SIH 1974]
The polar stress components, given by equations (3.2) to (3.4), were reported by Sih [SIH 1974], where higher order terms were neglected.
a, = v 2n • r 2 Kr(3-cos(0)ycos\j)+Kir(3-cos(e)-\).sm(-) ^ • [ ^ • ( l + cos(^)).cos(f)-^.(3.sin(^)).cos(|) f i *r0 ylln-i
^ • s i n ^ c o s f - l + ^ - ^ - c o s ^ - l J - c o s f -
+ 0
+o
V f I O r2 V ,f ^
r1 V ) where <?e ?r6 r 6 KjRadial stress component (polar coordinate system)
Circumferential stress component (polar coordinate system) Shear stress component r-8 (polar coordinate system) Radial distance from the crack tip (polar coordinate system) Circumferential angle (polar coordinate system)
Stress Intensity Factor (mode I) Stress Intensity Factor (mode II)
(3.2)
(3.3)
An initial examination of equations (3.2) to (3.4) reveals a mathematical difficulty with the stress distribution term 1/ as the radial distance (r) approaches zero, all the stress components approach infinity. This situation is a singularity of order r ~112. In reality, the stress at the crack tip
cannot be infinite since the system has finite energy. The stress level is limited by the plastic deformations that occur at the crack tip. This recalls the fact that these equations were found using the LEFM assumption, which is only valid for small plasticity zones.
Another important concept in fracture mechanics is the distinction between "plane strain fracture" and "plane stress fracture". Using the coordinates system presented in Figure 3.3, the generalized plane stress condition based on Hooke's law is valid when:
<TZ=0
* « = 0 (
3-
5)
T = 0
and the generalized plane strain assumption is valid when: <jz=v((Tx+ay)
rxz=0 (3.6)
In textbooks dealing with the theory of elasticity and plasticity, the terms "generalized plane strain" and "generalized plane stress" are defined by equations (3.5) and (3.6) to describe the general stress/strain state of a structure, while these terms take a special meaning in fracture mechanics. In fracture mechanics, a special concern is given to the crack tip and surrounding region and thus, "plane stress fracture" and "plane strain fracture" refer to the stress and strain conditions within the vicinity of the crack [TADA et al. 1985].
Based on Figure 3.3, if a load is applied in the Y direction, a positive strain is developed in that same direction, causing the crack to open in Mode I. This load simultaneously induces negative strains in the X and Z directions. The compressive strain in the Z direction causes a localised thinning of the plate as illustrated by the dotted lines in Figure 3.3 [BROEK 1988]. Normal stresses will be induced in the X and Z directions to restrict the deformations. However, the stress in the Z direction will be equal to zero on the free faces of the plate.
The difference between plane stress and plane strain fracture is illustrated in Figure 3.4 by the localized thinning region of the plate delimited by a cylinder. If the cylinder radius is very small compared to the thickness, the surrounding material will constrain the cylinder in the Z direction. As the cylinder cannot deform, tension stress is induced through the thickness and plane strain fracture is assumed. Again, if the cylinder radius is large compared to the thickness, then the surrounding material cannot prevent the thinning of the plate in the vicinity of the crack and no tension is induced through the thickness. This latter situation refers to plane stress fracture. This discussion is illustrated in Figure 3.4.
In fact, the cylinder radius described above is related to the size of the region of plasticity, where the plastic-zone radius is a function of the applied load, the geometry, the crack length, the yield stress of the material, and the stress-state.
The relation between the plastic zone radius, rp, the SIF, K, and the yield strength, crys, of the material for plane stress facture conditions can be estimated with equation (3.7).
1 K2
r « — (plane stress) (3.7)
For conditions of plane strain, the zone radius is smaller as the triaxial stress field suppresses the plastic zone size. The plastic zone radius for plane strain can be estimated with equation (3.8).
1 K2
r « — (plane strain) (3.8)
As a rule of thumb, the plane strain condition prevails when the plastic-zone radius is smaller than one tenth of the thickness. Similarly, the plane stress condition is assumed when the plastic-zone radius is larger than the thickness [HERTZBERG 1996]. The two stress states generate different propagation modes, thus, as the crack gets longer and as the plastic-zone radius increases, the crack shifts to ± 45° with respect to the load axis, the material, and the plate thickness as illustrated in Figure 3.5. The plane strain to plane stress fracture surface transition can be demonstrated with Mohr's circle.
Most engineering applications that analyse plates with through cracks that are correctly done using the generalized plane stress condition for the elastic portion of the plate (far away from the crack). However, plane strain fracture condition usually prevails in the vicinity of the crack tip [TADA et al. 1985].
Thick plate Thin plate
Thick plate Thin cylinder and no contraction
PLANE STRAIN
Thin plate Free contraction PLANE STRESS
Figure 3.4: Plane stress and plane strain fracture [BROEK 1988]
Loading Successive direction stage* of i crack front Direction of crock propagation thickn«st of specimen
3.1.2 Numerical methods in fracture mechanics
As stated in section 3.1, the resolution of fracture mechanics problems using numerical methods causes a problem when capturing the infinite stress at the crack tip, due to the r'A singularity. The first attempt to solve 2D LEFM problems using linear Finite Element (FE) analysis was done by Chan [CHAN et al. 1970]. Although ordinary FE methods lack the ability to represent the stress at the crack tip, meaningful SIF can be obtained using the displacement extrapolation technique. Until new approaches were developed, the only way to capture the high stress gradient of a cracked structure was to use extensive mesh refinement around the crack tip [CHAN et al. 1970]. This section will present strategies developed to capture the infinite stress gradient at the crack tip and the methods used to compute the SIF.
Two strategies were developed to correctly represent the infinite stress field at the crack tip: the singular, and the non-singular element formulations [RAJU et al. 1984, RAJU1986, and RAJU 1987].
Non-singular elements intrinsically produce the required singularity at the crack tip by using a built-in singularity into the element formulation. Therefore, this method requires modifications to the FE program in order to include the appropriate element shape functions [DELORENZI1985, RAJU 1986, and DE ROECK et al. 1995]. Physically, a non-singular element looks like regular h-element, but has different interpolation functions.
Singular elements produce the required singularity at the crack tip without using any special element formulation [HENSHELL et al. 1975, ATLURI et al. 1975, BARSOUM 1976, PUet al. 1978, and RAJU et al. 1984]. The second order crack tip singular element is either produced by shifting the mid-side nodes to the quarter point [HENSHELL et al. 1975] or by collapsing a quarter-point quadrilateral element into a triangular element [BARSOUM 1976]. The effect of the quarter-point node on the stress and strain distribution is shown in Annex A for a one-dimensional element. The 2D and 3D second order quarter-point elements are illustrated in Figure 3.6.
-? • — Regular Isoparametric Element Quarter-Point Singular • Element * • • + •
L/4
2D quarter-point elements (quadrilaterals)
L
+ ? Regular Isoparametric • m Element ' Collapsed _- Quarter-Point / ^ Singular Element 4 • * — ® 1 IZ/4 / \ • 0[=*:
•
i \ • >2D quarter-point elements (triangles)
3D quarter-point elements (bricks) 3D quarter-point elements (wedges) Figure 3.6: Second order singular elements
This approach is known to give accurate stress distributions with fewer degrees of freedom than non-singular elements [RAJU1987]. Recently, the non-singular approach was adapted to p-elements [RAHULKUMAR 1997], which had the advantage of being compatible with the singular stress field at the crack tip and the non-singular stress field in the surrounding region. Although the p-version is not as recognized and as tested as the h-version, the p-version yields comparably accurate results to those obtained by the h-version. An improved version of the quarter-point element was also developed to obtain highly accurate SIF values (especially in mixed mode conditions) by including the neglected terms in the element formulation [GRAY et al. 2003]. However, this formulation requires modifications to the element shape functions, which is often impossible in commercial FE codes such as MSC/NASTRAN.
Other crack elements were developed to capture the singular stress distribution at the crack tip. For example, the MSC/NASTRAN element library includes CRAC2D and CRAC3D elements [PAREHK etal. 1986].
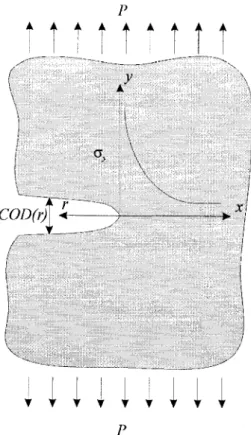
Modeling the singularity at the crack tip is an essential part in predicting crack propagation using LEFM. However, capturing the singular stress gradient is insufficient from a fatigue point of view. As the SIF is one of the fundamental units used in fracture mechanics, numerous methods has been developed to compute the SIF using various numerical results. Many methods were found in literature, such as the Displacement Correlation Technique (DCT), the Quarter-Point Displacement Technique (QPDT), the Displacement Extrapolation Technique (DET), the Modified Crack Closure Integral (MCCI), the Virtual Crack Extension method (VCE), J-integral, and the H-integral. The methods are described in detail in the following sections. For simplification purpose, DCT, QPDT and DET were grouped together as Crack Opening Displacement (COD) techniques since these techniques use displacement fields to compute the SIF.
Crack opening displacement techniques
The COD methods are based on the asymptotic analysis of the displacement field on the crack line deduced from the LEFM [ZAILIANG et al. 1999]. Therefore, only the displacement field along the crack line is required to compute the SIF. The theoretical displacement field for 2D structure is described by equations (3.9) and (3.10) using the coordinate system illustrated in Figure 3.7.
A A
COD(rj[
+-/ / " xi T * VFigure 3.7: Crack opening displacements
where
CODy Crack opening displacement normal to the crack line (mode I)
CODx Crack opening displacement tangent to the crack line (mode II)
r Distance from the crack tip along the crack line Ki Stress Intensity Factor (mode I)
K/j Stress Intensity Factor (mode II) ju Shear modulus
v Poisson's ratio
K Stress state correction, where K = (3-4 v) for plane strain K = (3- v)/(l 4- v) for plane stress
(3.9)
The DET was first used by Chan [CHAN et al. 1970] using ordinary isoparametric finite elements but it can also be used with singular or non-singular element formulations. This method consists of extrapolating the computed SIF for r-»0 using the surrounding nodes along the crack line. Lim et al. [LIM et al. 1992] and Pang [PANG 1993] studied the DET and found that this method exhibits some erratic characteristics and was highly sensitive to the nodal displacement distribution.
The DCT was exclusively developed for use with quarter-point elements. This method requires that all the nodes of the quarter-point elements be along the crack line. The relations used to compute the SIF in 2D for Modes I and II are given by equations (3.11) and (3.12) respectively, based on the mesh illustrated in Figure 3.8 [FEHL et al. 1999]. In the particular case of a crack propagating along the symmetric plane of structure (ex. centre cracked tension specimen), then V6=-V4, and V7=-V5. An additional relation exists for 3D problems.
y,v
~+x,U
Figure 3.8: Second order quadrilateral quarter-point element
K„=-^M[4(U
4-U
6)-(U
5-U
7)]
AT + 1 V L
(3.11)
where
/d Shear modulus v Poisson's ratio
K Stress state correction, where K = (3-4 v) for plane strain K = (3- v)/(l + v) for plane stress
L Length of element along the quarter-point side Vt Nodal displacement normal to the crack line at node i
Uj Nodal displacement tangent to the crack line at node i Ki Stress Intensity Factor (mode I)
Ku Stress Intensity Factor (mode II)
The QPDT is suitable for quarter-point elements only. The expressions for computing the SIF given by equations (3.13) and (3.14) are similar to the DCT, but the QPDT only uses the two nodes adjacent to the crack tip [FEHL et al. 1999].
V6) (3.13)
U6) (3.14)
Many authors [COOPER et al. 1995, FEHL et al. 1999, GUINEA et al. 2000, and MESHII et al. 2003] evaluated the DCT and QPDT for pure tension, pure bending, pure shear, and combined shear and tension. In the case of Mode I only fracture, DCT and QPDT gave good results and the size of the quarter-point element had little impact on the outcome. However, the reliability of the DCT and QPDT came into question for Mode II or combined conditions. The authors recommended the use of DCT and QPDT for Mode I only. Thus, extreme care is recommended when Mode II cracking occurs.
2u
\2n ,K
n = AT + 1 V L 2ju \{2n K+l\ L~{u.
Virtual crack extension method
The VCE method is based on the Strain Energy Release Rate (SERR), which is another fundamental concept in fracture mechanics. The SERR is given by equation (3.15) [HERTZBERG 1996].
dm W -*¥
G = - — « - 2 ' (3.15)
da Aa
where
G Strain Energy Release Rate
*P Potential energy of the system
*p Potential energy of the system with a crack length a Potential energy of the system with a crack length a+Aa
* 2
a Half crack length
Aa Small crack length increment
The relation between the SIF and the SERR can be deduced from the LEFM for the three fracture modes as demonstrated by Irwin [HERTZBERG 1996].
K^jE^iiellJIJl] (3.16)
where
Kh K/j, Kin Stress Intensity Factor (Mode I, Mode II, and Mode III)
Gi, Gn, Gin Strain Energy Release Rate (Mode I, Mode II, and Mode III) v Poisson's ratio
E' E' =E for plane stress
E'=E/(l-v2) for plane strain
It is therefore possible to numerically compute the SIF using these fundamental concepts by making two numerical simulations: the original with a crack of length 2a, and the modified structure with a new crack of length 2(a+Aa). This practice is problematic, as it requires two simulations to compute the SIF. Moreover, the choice of an adequate Aa value is difficult.
The VCE method consists of avoiding the computation of the second simulation by doing the simulation for the original configuration and finding the stiffness matrix derivative when a crack extension, Aa, is added during the same analysis. Hellen [HELLEN 1975] provided an expression for the computation of the derivative of the stiffness matrix as a function of the crack length. Haber and
virtual crack extension. Other variants of the VCE method were proposed: the equivalent domain integral [NIKISHKOV et al. 1987], the expansion to nonlinear material [HELLEN 1989], Jacobian derivative method [BARBERO et al. 1992], and the adaptation of higher derivatives to multiple cracks problems [HWANG et al. 1998]. The VCE method is suitable for 2D and 3D structures and compatible with singular or non-singular elements.
/-integral
Independent work by Eshelby [ESHELBY 1956] and Rice [RICE 1968] led to the development of a path independent integral to include plastic deformations. The /-integral is thus valid for linear elastic and nonlinear elasto-plastic fracture mechanics.
For linear elastic materials, the /-integral is equal to the strain energy release rate, G, and both are related to the SIF by equation (3.16).
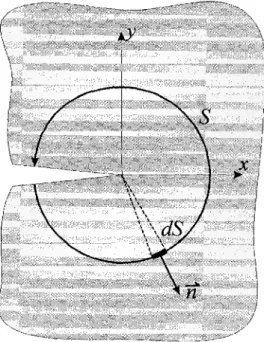
The meaning of the /-integral can be described as a balance between the internal strain energy density, W, and the external energy. The external energy is represented by the work done by the traction vector on the volume enclosed by the closed path, S, illustrated in Figure 3.9.
0
X
Equation (3.17) presents the J-integral definition based on the cracked structure shown in Figure 3.9. where dy n T, u,v ds
J
=l,[
w
*-
T
--lt*
(3.17)S is an arbitrary contour path around the tip of the crack defined from one surface of the crack to the other surface of the crack in the x-y plane.
W Strain Energy Density, W = — \ crAs,, 9 J J '
Infinitesimal element along the y-direction. Unit vector normal to the path S
Traction vector acting on the contour, where Ti=<jynj Displacement vector in x and y directions
Differential element of arc S.
For a plane stress problem (crz= 0), equation (3.17) can be rewritten in a matrix form by dividing the
N
path, S, in N elements ( S = ^ 5 , . ) [BEZERRA et al. 2002]. The /-integral can be numerically
/=i
computed with equation (3.18) along the path illustrated in Figure 3.10.
i=i » 2\_(7xx0'yya'xy
'XX -yy c -xy)
dy-[
axxayyaxy "x 0 ny ly du dx dv_ dx (3.18)All quantities involved in equation (3.18) are required for each node or integration point along the path to evaluate the ./-integral. The ./-integral technique can be used for mixed fracture modes. However, the evaluation of each fracture mode must be computed independently using three different load cases corresponding to each fracture mode since the ./-integral is a scalar energetic quantity. This method is more complex to implement than other methods, but offers the advantage of using global results (stresses far from the crack tip) instead of local results (ex. crack opening displacement), which are influenced by the erratic behaviour of the singular and non-singular
elements. The J-integral method generally provides more accurate results than crack opening displacement techniques presented previously [ZAILIANG et al. 1999, and BEZERRA et al. 2002].
Figure 3.10: J-integral path over a meshed part around the crack tip
Modified crack closure integral
Rybicki and Kanninen [RYBICKI et al. 1977] proposed the Modified Crack Closure Integral (MCCI) method to estimate the SIP. This method is based on the Irwin's Virtual Crack Closure Integral (VCCI), which allows the computation of the work required to close the crack to its original configuration.
Based on LEFM, the normal stress distribution ahead the crack tip can be expressed by equation (3.19) using the notation illustrated in Figure 3.11. Note that the stress is infinite at the crack tip as x->0. where x A, y/x
+ A
2+A
}yfx + ..
(3.19)Normal stress distribution
Distance from the crack tip along the crack line Series coefficients
Figure 3.11: Normal stress distribution ahead the crack tip
If the crack extends from a to a+Aa, where Aa is an infinitesimal distance, Irwin assumed that the COD would be approximately the same behind the new crack of length a+Aa. Using this assumption, Irwin was able to estimate the work necessary to extend the crack from a to a+Aa by calculating the energy required to close the crack from a+Aa to a. Thus, the work necessary to extend the crack in Mode I from a to a+A is given by equation (3.20).
where W r V(r) ay Aa W = -jV(r)-ay(Aa-r)dr ^ o Work
Distance from the crack tip along the crack line Crack opening displacement at a distance r Normal stress distribution
Small crack length increment
The SERR can now be defined as
W 1 Ar
G = lim — = lim V(r)• a (Aa-r) dr
Aa->0 \n Aa->0 9 A / 7 J y
Aa^° Aa Aa->° 2Aa
(3.21)
The MCCI method consists of using the stress distribution ahead the crack tip and the displacement behind the crack tip in order to avoid performing the analysis twice [RYBICKI et al. 1977]. The MCCI is one of the most widely used methods as it can be used in 2D and 3D structures [RYBICKI et al. 1977, RAJU 1986, NARAYANA et al. 1994a, and NARAYANA et al. 1994b] and it can estimate the SERR of the three distinctive modes, by closing the crack face in various modes. This method can be used with singular and non-singular element formulations.
For simplicity, the numerical computation of the SERR will be presented here for a 2D case only with 2nd order singular elements. Very good descriptions of the numerical methods for 2D and 3D cases using singular and non-singular elements (1st, 2nd, and 3rd order) were found in literature [RAJU 1986, RAJU 1987, DATTAGURU et al 1994, NARAYANA et al. 1994a, and DE ROECK et al. 1995]. Equations (3.22) and (3.23) are used to compute the SERR in Mode I using the notation detailed in Figure 3.8. G,= 2L
+
^ { U ^ - V O + U ^ - F ; ) }
(3.22) where G, L Fyi 'i, =14-' 2 1 = — + 33^" ~8~' 7 2 b r t3l =S-2 16 2 b r 8 ' 1 2 = • •; * 22 '32 = -52 + -17--32 + 33tf 2 2 b r 4 2 b rStrain Energy Release Rate for Mode I
Length of element along the quarter-point side Nodal forces with respect to y axis at node i Nodal displacement at node i
Similar relations were obtained for the SERR in Mode II by replacing Fy with Fx, and V with U
[RAJU 1986]. The SIF can be computed directly using relation (3.16) in LEFM.
This section reviewed the most common numerical methods available for the computation of the SIF in addition to giving sufficient background to understand certain fundamental fracture mechanics concepts. These numerical methods can be either used with FE or BE based simulations as long as the required results (displacements, forces, stresses, strains, etc.) can be provided.
3.1.3 Fatigue life predictions
A structure subjected to a cyclic load usually fails under a smaller load than the predicted static ultimate load. The mechanism by which a flaw grows under cyclic loading is called fatigue.
Since the early 1960's, several empirical and theoretical crack growth models have been developed in a form similar to equation (3.24). Equation (3.24) shows that the crack growth rate is a function of the stress variation, the half crack length, the stress ratio, and the material.
JL =f(Aa,a,R,C
i) (3.24)
where da/dN ACT a Rc,
Crack propagation rate Applied stress
Half crack length Stress ratio Material constants
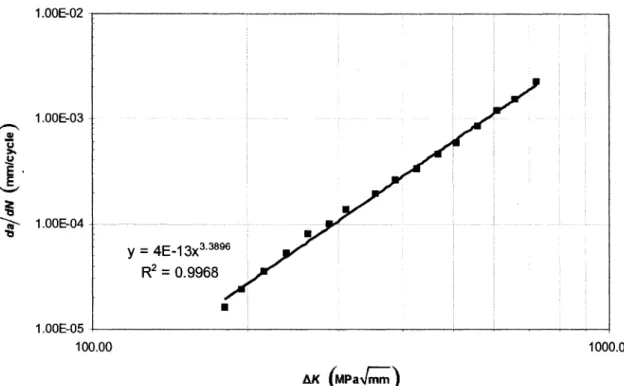
The Paris law, developed by Paris and Erdogan [PARIS et al. 1963], is one of the most simple and widely used crack growth models. The equation (3.25) presents the Paris law. The Paris law was developed to fit the crack growth regime in region II illustrated in Figure 3.12. The material coefficients, C and n, must be used with caution as they are dependent on the environment, the temperature, and the stress ratio.
where
— = C(AK)"
dN
v }da/dN Crack propagation rate
AK Stress intensity factor variation (AK=Kmax-Kmj„)
C Material constant (C= da/dN when AK = 1)
n Material constant known as the Paris exponent. The Paris
exponent represents the slope of the relation log (da/dN) vs. log (AK) in region II.
(3.25)
O
AKlh (Kc - Kmin)
logA£
Figure 3.12: Fatigue crack growth response
The Walker equation [WALKER 1970] can be considered as an enhancement of the Paris equation because it takes the effect of the stress ratio into account. It has been observed that an increase of the mean stress level, for the same AK, results in a higher crack propagation rate. Equation (3.26) presents the Walker crack growth model.
^ . =c\AK(l-R)im-l)~
dN I
V ;-(3.26) where
da/dN Crack propagation rate
AK Stress intensity factor variation (AK=Kmax-Kmin)
C Material constant; C = da/dN when ./?=0 and AK =1 n, m Material constants
The Forman equation [FORMAN et al. 1967], named after Dr. Royce Forman, was an improvement of the Walker equation because it considers the effect of high AK levels on the crack growth rate. Effectively, as ATmax approaches Kc (at AK = Kc -Kmia), a local fracture is observed which leds to fast fracture. This phenomenon corresponds to region III of the crack growth curve shown in the Figure 3.12, and is followed by the failure of the cracked component. The formulation of the Forman equation is defined by equation (3.27).
da C AK"
(3.27)
where
dN (\-R)Kc - AK
da/dN Crack propagation rate
AK Stress intensity factor variation (AK=Kmax-Kmin)
R Stress ratio (R = amin / crmax)
Kc Fracture toughness
C Material constant; C = da/dN (K^l) when R=0 and AK= 1
n Material constant
The NASGRO equation is the result of the combined work of Forman and Newman from the NASA, Shivakumar of Lockheed Martin, de Koning of NLR and Henriksen of ESA. It was first published by Forman and Mettu [FORMAN et al. 1992], and was later integrated in NASGRO Version 3.0. This model takes into account the stress ratio effect, the crack growth acceleration for high AK levels, and the retardation effect near threshold (AK,h). Therefore, the three crack growth regimes are included in
the NASGRO equation.
The Harter T-Method was formerly known as the "Point-by-Point Walker Shift Method" and it was developed in 1983 by James A. Harter [HARTER 1999]. This method essentially provides a way to interpolate and extrapolate crack growth data using a limited amount of tabular crack-growth rate test data. Hence, this method shifts the crack growth rate relation as a function of stress ratio. It is a simple way to interpolate and extrapolate data in log-log scale by using an exponential form.

![Figure 3.4: Plane stress and plane strain fracture [BROEK 1988]](https://thumb-eu.123doks.com/thumbv2/123doknet/4964347.122619/33.922.301.626.85.440/figure-plane-stress-plane-strain-fracture-broek.webp)