Proceedings of the 9th International Conference on Structures in Fire (SiF 16)
8-10 June 2016, Princeton University, NJ, USA
Conversion of visual post fire measurements into fire
severity with the aid of thermo-plastic analysis
for retrofitting
T. Molkens, T. Gernay, R. Van Coile
ABSTRACT
At Koksijde in Belgium a severe fire took place in an apartment building in 2015, resulting in the death of a young man and visible structural damage to four balconies. Following the fire, experts were mandated to assess the damage and the need for structural repair. They estimated that the balconies had to be refurbished but that there were no other structural elements affected, in particular the slab inside the apartment could be left in place with only a surface treatment and new plaster finishing. However, the floor slab in the apartment located above the fire apartment exhibited several visual indications that the fire could have had a structural impact, such as residual deformations and cracks in the tiles. This paper presents a methodology to infer the fire severity based on post-fire measurements and non-linear thermo-plastic numerical simulations. Finally, knowing the fire severity, its effect on the structure is evaluated and a reliability-based assessment is made of the residual load bearing capacity of the slab.
CONTEXT OF THE FIRE EVENT
The fire took place at the 3rd floor in an apartment building built in the 1970’s at Koksijde (Belgium), see Figure 1.
Figure 1. The façade and balconies affected by the fire are framed by the box
_____________
Tom Molkens, StuBeCo bvba, Hoevenstraat 155, 3900 Overpelt, Belgium.
Thomas Gernay, University of Liège, allée de la Découverte 9, 4000 Liège, Belgium.
Ruben Van Coile, Ghent University, Department of Structural Engineering, Technologiepark 904, 9052 Zwijnaarde, Belgium.
A detailed register could be obtained from the fire brigade giving the time delays between the different events. The time between the announcement to the fire brigade and the start of firefighting is about 14 minutes. This value has to be extended with the time between fire ignition, discovering, call to the emergency number, and from the dispatching to the fire brigade. Hence total time is estimated between 20 and 45 minutes.
Geometry of Apartment
A staircase services 3 apartments at each level, two of them are from front to back with 3 sleeping rooms, and one in between these two. The lay-out is identical at each level. Balconies are working in cantilever. Except for a small extract of an original architectural drawing, there was no information available about the structure.
Post-Fire Measurements on Site
Due to a judicial procedure, access to the apartment where the fire took place was not allowed. Furthermore, possibly valuable information stays secret till the end of this procedure (which is still going on). Therefore, we have to focus on post-fire observations and measurements taken from the apartment located above the event.
The wake-up call for the owner from above were cracks which appeared in the finishing tiles in the kitchen after the fire, see the dotted line and detail of the cracks in Figure 2. With an optical instrument, cracks on the slab top surface were measured as between about 0.2-0.3 mm. The tiles were no longer fixed to the underlying layer (hollow sound) and some slight level differences could be observed.
It was also observed that the floor was not horizontal any more, i.e. it exhibited a residual deflection. Using a laser equipment, levels were measured on the spots marked in Figure 2. Assuming that the surface was originally horizontal, the deformations of Table I can be found. The residual vertical deformation was at maximum 11.5 mm.
Figure 2. Apartment lay-out, length front room 8.40 m x 4.40 m x 2.42 m + bearing direction
TABLE I. MEASURED DEFORMATIONS IN M, ORIGIN INDICATED IN FIGURE 2
Distance in m 0 1.8 3.8 5.8 7.8 8.4 4.1 0.0000 0.0000 0.0000 0.0000 0.0000 0.0000 2.1 -0.0050 -0.0090 -0.0090 -0.0115 -0.0050 -0.0040 0.1 0.0000 0.0000 0.0000 0.0000 0.0000 0.0000 Adjacent span of 6.12 m Balcony of 1.47@3.49 m²
THERMAL DESCRIPTION OF THE FIRE LOAD
Considering the limited information available about the fire, and the features of the compartment where the fire took place, the preferred approach for estimating the fire load consists in building up a 2-zone model.
Two Zone Model
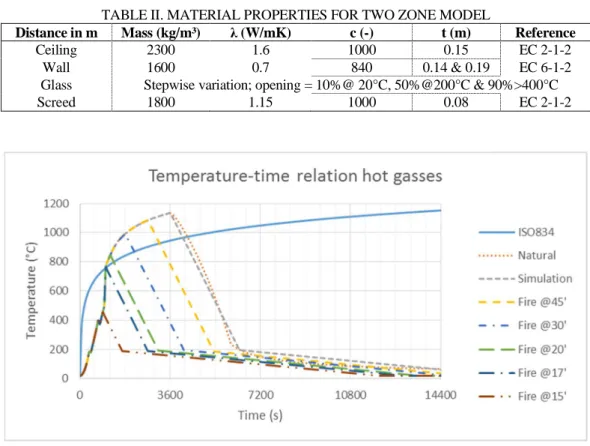
For building up the two zone model by Ozone [1] we took into account the material properties listed up in Table II and dimensions of the apartment as shown in Figure 2 (with a free height of 2.42 m). After calculating a fully developed fire (see Figure 3) we have made a tri-linear simulation of the descending branch, with changes in the cooling rates when the temperature reaches 200°C and 20°C. To simulate the intervention of the fire brigade, it is conservatively assumed that this intervention speeds up the start of the tri-linear descending curve but does not affect the slope of the fire curves (neglecting the effect of the volume of added water). As a reference the well-known ISO 834 standard fire curve has been added as well. Several scenarios are calculated with different intervention times using Eq. (1) for the cooling phase, time t in s and θ in °C.
θi+1 =MAX(IF(θi >200; θi-(ti+1-ti)∙0.3407; θi-(ti+1-ti)∙0.0165);20) (1)
TABLE II. MATERIAL PROPERTIES FOR TWO ZONE MODEL
Distance in m Mass (kg/m³) λ (W/mK) c (-) t (m) Reference
Ceiling 2300 1.6 1000 0.15 EC 2-1-2
Wall 1600 0.7 840 0.14 & 0.19 EC 6-1-2
Glass Stepwise variation; opening = 10%@ 20°C, 50%@200°C & 90%>400°C
Screed 1800 1.15 1000 0.08 EC 2-1-2
Based on communication with the fire brigade it takes about 30 to 60 minutes to get a fire under control, starting from a fully developed fire. This is in full agreement with the time needed to descend the temperature from the peak value to the previous mentioned 200°C, using the cooling rate of Eq. (1). For instance, a fire that could develop during about 30-60 minutes needs about 40-45 minutes to be brought under control (to a gas temperature below 200°C). It seems that only with a very short reaction time the control time can be substantially reduced.
Localized fire
For furniture it is well known that the peak in heat release takes place always between 120 and 400 s after ignition and this effect is very limited in time. Due to the flash-over, which occurs at about 600 s, we neglected this effect.
MECHANICAL RESPONSE
The concrete slab is a continuous slab supported by load bearing walls of masonry (hollow bricks of 19 cm). Fire took place below an end span which is supported by a (double) wall of 14 cm. Loads are given in Table III. Concrete class is C30/37 and reinforcement strength fyk = 500 N/mm². Using a simple Cross based design and old
standards [2], a slab thickness of 150 mm could be derived and also the following main reinforcement ratio’s: upper reinforcement of 598 mm²/m (reduced at 85%) above supports and 258 mm²/m for balcony; lower reinforcement of 341 mm²/m (increased proportionally) in the principal direction and 141 mm²/m in the transverse direction. Boundary conditions are simple vertical supports at the location of the joint or beams and clamping at the other supports. The area of the slab incorporated in the thermo-mechanical model is equal to the boxed area of Figure 2.
TABLE III. LOADS ACTING ON THE SLAB
Load case Load (kN/m²) Reference
Mobile load class A (Ψfi=0.30) 2.00 EC 1-1-1
Partition walls < 3 kN/m 1.20 EC 1-1-1
Screed of 80 mm LC 1.50 EC 1-1-1
Dead load of 150 mm concrete 3.75 EC 1-1-1
Transient thermo-mechanical simulations are run using the software SAFIR®. A
plastic-damage model is used for modeling concrete at elevated temperature [3,4]. Different fire exposures are successively considered, corresponding to the scenarios of Figure 3 (i.e. natural fires with cut off at different times). The behavior under a standardized ISO fire is also computed. The results are shown in Figure 4. The level of observed residual deflection, equal to 11.5 mm, is also represented on the graph.
The ISO fire exposure represents a situation where the temperature continuously increases in the compartment, until structural collapse of the slab. In this case, any intervention from the fire brigade is neglected.
In reality, the slab did not collapse owing to the timely intervention of the fire brigades, which resulted in a decrease in the compartment temperature. Numerical analyses for the full fire development (including the decay phase) show that, for natural fires with cut off between 20 min and 60 min, the vertical deflection of the slab increases
up to a certain level, then decreases and eventually exhibits a residual value. Considering the computed results of residual deflection, it is possible to estimate the time of cut off and hence the time of fire brigades intervention as approximately 30 minutes after ignition. This estimation is reasonably in line with the registered timeline of the event.
Figure 4. Evolution of vertical deflection at node 114 under different fire exposures (@20’ means a cut off after 20 min)
DEFORMATIONS OVER THE SLAB WIDTH
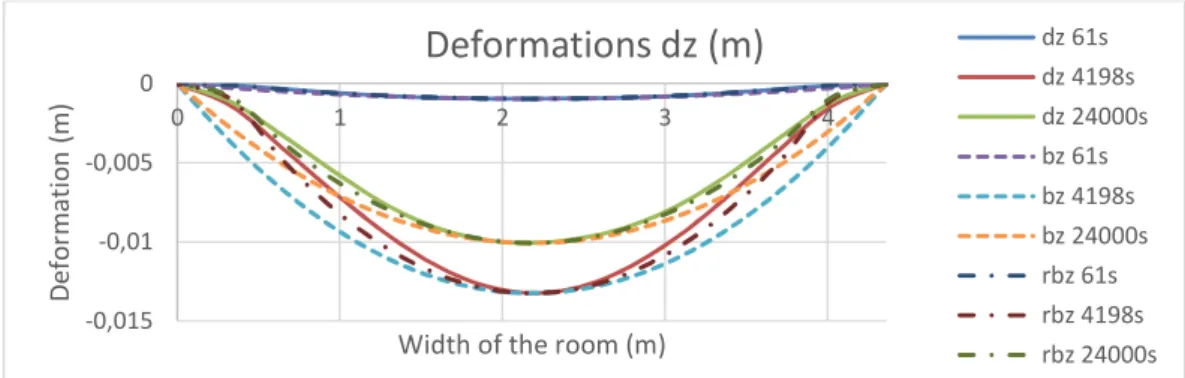
A FEM-based model shows a maximum deflection of 2 mm after finishing and creep before the fire event took place. Residual deformations after fire are taken from the SAFIR® simulation. To explain the cracking in the tiles it is needed to look at the
deformations over the width of the slab. For a fire with a cut off time of 30 minutes we have plotted the vertical deformations on a section over the width through point 114 of Figure 4. This deformation line is subsequently approximated by a circle segment with the width of the room and also once with 5/6th of this dimension to obtain a better fitting.
With the circle approximation we can easily adapt the radius of the curve to calculate the effect on top of the tiles instead of at the centerline. For the maximum deformation at 4198 s we derive a shorting of 5 mm on top of the slab, plastic deformations occur at that times and tiles will be pushed loose from the under layer. In the later stage the reversed effect takes place and we obtain 1.3 mm regained length translated in at least 3 cracks (supports and middle) of approximately 0.4 mm. Which can be compared with the measured 0.3 mm.
Figure 5. Deformation over the width at starting, maximum and residual deformation -0,015 -0,01 -0,005 0 0 1 2 3 4 D e fo rm a ti o n ( m )
Width of the room (m)
Deformations dz (m)
dz 61s dz 4198s dz 24000s bz 61s bz 4198s bz 24000s rbz 61s rbz 4198s rbz 24000sRELIABILITY OF THE RESIDUAL BEARING CAPACITY OF THE SLAB
A practical reliability based tool for the post-fire assessment of simply supported concrete beams has been presented in [5]. The method considers a general formulation of the strength limit state criterion for structural members, given by:
− = − + ≥ 0 (2)
with R the (lognormal) strength of the structural element (including all model uncertainties), E the load effect, G the (normal) permanent load effect, and Q the (Gumbel) imposed load effect.
Considering a permanent load effect which can be accurately determined as it is mainly made up of self-weight of the structure and finishing’s, the method evaluates the maximum allowable characteristic value Qk,max of the imposed load which corresponds
with a reliability index (safety level) β of 3.8, which is the target safety level for the design of new structures in accordance with EN 1990 (50 year reference period) [6]. If
Qk,max is larger than the value of Qk required for continued use, the structure is deemed
safe for continued use in accordance with the reliability target of the Eurocodes (ULS). The evaluation is done by using a pre-calculated diagram, called ‘Assessment Interaction Diagram’ (AID), as given below in Figure 6. The AID is generally applicable to any type of member and presents pre-calculated curves which correspond with β = 3.8 for different load ratios χ, defined by (subscript k = characteristic value):
χ = Qk /(Qk + Gk) (3)
Figure 6. Assessment Interaction Diagram for a reliability index β = 3.8 (50 year reference period)
By evaluating the coefficient of variation VR and the expected (mean) value µR of
the resistance effect R, and calculating the ratio of µR to µG = Gk, a point on the AID is
found and the associated maximum allowable load ratio χmax can be read from the
diagram (or determined through interpolation). Knowing χmax and Gk, the maximum
allowable characteristic value of the imposed load Qk,max is directly defined.
The evaluation of VR and µR can be done through any method. In [5] an analytical
model has been used. Here this methodology is extended for continuous concrete slabs. The evaluation of the residual bearing capacity of such a continuous slab is done considering the simple rules out of EC 2-1-2 informative annex I. Based on this concept the span and support capacities should together provide sufficient capacity to fulfil the requirements of static equilibrium, i.e.:
, , +
, ≥ " ! (4)
where MR,support is the (positive) support hogging moment capacity, MR,span is the
(positive) field moment capacity, g and q are distributed permanent and imposed load, and l is the span length. Note that in the reliability evaluation model uncertainties are considered as well, as discussed in [5]. As the fire took place underneath the end span of the continuous slab, the assessment is done for this end span with MR,support2 = 0.
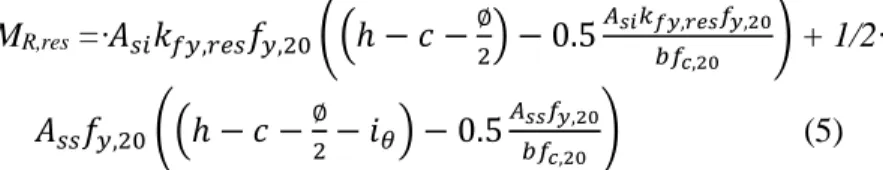
The residual load bearing will be assessed through a simple analytical formula, using a post-fire methodology based on the 500oC method [7], with k
fy,res a reduction
factor for the residual yield stress as a function of the maximum temperature reached by the reinforcement. The mid span total residual load bearing capacity is given by:
MR,res =∙# $%&',() *', +,-ℎ − / −∅1 − 0.545678, 9 &8, :
;&<, : = + 1/2∙
# *', +,-ℎ − / −∅− >?1 − 0.54 &;&<, :8, := (5)
with parameters as defined in Table IV. A number of uncertainties are associated with the parameters in (5), as is the case for normal design conditions. These uncertain variables are given in Table IV, together with their mean value and standard deviation, literature references are given in [5].
Consequently, the maximum reinforcement temperature and associated factor kfy,res
are defined through the nominal reinforcement position. This assumption is robust as for the specific case under investigation the maximum attained reinforcement temperatures remain below 300oC. On the other hand we didn’t apply the 0.85 reduction
factor for the mechanical analysis because this results in a more conservative result (due to 500°C isotherm).
TABLE IV. STOCHASTIC VARIABLES CONSIDERED FOR THE EVALUATION OF (5)
Variable Mean value
Standard deviation
Field bottom reinforcement area Asi [mm2] 223 4.5
Residual steel yield stress reduction factor kfy,res [-] 1.00 0.08
20oC reinforcement yield stress f
y,20 [MPa] 581 41
Slab thickness h [mm] 150 5
Reinforcement axis position to surface c+Ø/2[mm] 25 5 Depth of the 500oC isotherm i
500 [mm] 14.5 -
20oC concrete compressive strength f
c,20 [MPa] 42.9 6.4
Support top reinforcement area Ass [mm2] 692 13.8
Total model uncertainty KT [-] 1.06 0.07
Span length l [m] 4.44 -
For using the AID of Figure 6, R = KT∙MR,res. The mean value µR and coefficient of
variation VR can be evaluated by any probabilistic method (for example Monte Carlo
simulations), but as in [7] Taylor approximations allow to make a very quick analytical assessment based on equation (5). With @̅ the vector with the mean values for all stochastic variables, Xi indicating any one of the stochastic variables, σ the standard
deviation, and ∂/∂Xi the partial derivative to the variable Xi, a first order Taylor
µR ≈ R μC =µKT [∙ μ4 $μ6&',() μ&', +,-μD− μE−F∅1 − 0.5FG 5F78, 9F78, : FHF7<, : = + 1 /2∙μ4 μ&', +,-μD− μE−F∅− μ$?1 − 0.5FG F78, : FHF7<, : =] (6) I ≈ K∑ -M FNMO 5 1 O5 IO5 & P =QR (7) & (8)
Evaluating the equations is straightforward using a hand calculator or spreadsheet. Considering the variables given in Table IV, µR = 28.3 kNm and VR = 0.118.
Furthermore, gk is assessed as 5 kN/m2, giving µG = 12.3 kNm. Applying these values
in the AID of Figure 6, a maximum allowable load ratio χmax of 0.3 is obtained, resulting
in a maximum allowable characteristic value qk,max for the imposed load of 2.14 kN/m2.
This value is more than the 2.00 kN/m² needed for dwellings.
CONCLUSIONS
Based on limited post-fire observations and measurements, which can be done with a minimum of efforts, a method is presented to evaluate the fire load and temperature evolution during a real fire event. This was worked out by transferring results of a two zone fire model into a thermo-mechanical model. Calibration was done by evaluating deformations and crack width and comparing with on-site measurements. The presented method can be useful for post-fire inspection and retrofit of structures.
A simplified reliability based assessment method shows that the post-fire ultimate limit state reliability of the slab is adequate for continued use. Note that this analysis is purely a safety analysis for load bearing capacity and does not incorporate possible serviceability issues as post-fire cracks, displacements and durability issues.
REFERENCES
1. Cadorin J.-F. & Franssen J.-M., “A tool to design steel elements submitted to compartment fires OZone V2. Part 1: pre- and post-flashover compartment fire model”, Fire Safety Journal, Elsevier, 38 (2003), 395-427, <http://hdl.handle.net/2268/29650>
2. NBN B15-103: 1977, Design of reinforced concrete, Belgian Institute for Standards BIN
3. Gernay, T., Millard, A., Franssen, J.-M. 2013. A multiaxial constitutive model for concrete in the fire situation: Theoretical formulation. Int J Solids Struct, 50(22-23): 3659-3673
4. Gernay, T., Franssen, J.-M. 2015. A plastic-damage model for concrete in fire: Applications in structural fire engineering. Fire Safety J, 71: 268–278
5. Van Coile R., Caspeele R. and Taerwe. L. June 2015. “Practical reliability-based calculation tool for the post-fire assessment of concrete beams”, in International Conference on Response of Structures
Under Extreme Loading, V.K.R. Kodur, and N Banthia, eds. Lancaster, Pennsylvania, pp 696-703
6. EN 1990:2002 + National Annex NBN EN 1990-ANB: 2007, “Eurocode 0: Basis of structural design”, European Committee for Standardization CEN, 2002
7. EN 1992-1-2: 2005 + Nationale Annex NBN EN 1992-1-2-ANB: 2010, “Eurocode 2: Design of concrete structures - Part 1-2: General rules - Structural fire design”, European Committee for Standardization CEN