CONTRIBUTION A LA CARTOGRAPHIE,
PAR ETUDES DE LIAISON ET D’ASSOCIATION,
DE LOCI D’INTERET CHEZ LES ANIMAUX DOMESTIQUES.
CONTRIBUTION TO LINKAGE AND ASSOCIATION MAPPING
OF TRAIT LOCI IN LIVESTOCK.
Zhiyan ZHANG
THESE PRESENTEE EN VUE DE L’OBTENTION DU GRADE DE DOCTEUR EN SCIENCES VETERINAIRES
ANNEE ACADEMIQUE 2013-2014 FACULTE DE MEDECINE VETERINAIRE
DEPARTEMENT DES PRODUCTIONS ANIMALES UNITE DE GENOMIQUE ANIMALE
I would like to express my gratitude to my supervisor, Professor Michel GEORGES, whose expertise, understanding, and patience, added considerably to my graduate experience. I appreciate his vast knowledge and skill in many areas (e.g., statistics, biology, bioinformatics, genetics), and he not only impact me on the scientific parts but also on the truth of human being. He also helps to correct and even almost rewritten the entire papers. A sincerely thanks to my co-promoter Lusheng HUANG, you guide me into the road of scientific research and always correct my way when I feeling lost.
A very great and important thanks goes out to Dr. Tom DRUET, without your step by step teaching and details explanations, I would not be able finished all this works. Dr. Tom DRUET is very careful and preciseness for even small errors. With his teaching by personal example as well as verbal instruction, I’ve now adjust some careless and hot-headed problems. Lots of statistical knowledge, genetics knowledge and programming skills were learned from Dr. Tom DRUET.
I would like to thank the other members of my Lab, Dr Carole CHARLIER and Dr. Wouter COPPIETERS for the great help in statistics and genetics, especially show me the really amazing things in genetics. Also I would like to thank Dr. Haruko TAKEDA, who just like my old sister takes care of me for lot of things, when I just first time come to the Lab, preparing everything and with great encouragement when I feel discouraged. I would like to thank Olivier STERN, always encourage me to keep fighting during stay at liege, and in my birthday, give me a special beer party.
I must also acknowledge my friends PhD. Students Huijun CHENG, Xin ZHANG, Wanbo Li, and Dr. Li LIN, Lixin ZHANG, Xuewen XU, Ming FANG, for many helps not in living stuff, sharing nearly each noon happy with me, but also in deeply discussion of ideas and tough issue in biology and quantitative genetics. This help to exchanges of knowledge, skills, and venting of frustration during my graduate program and enrich the experience. Without your help, obviously life would more hard and no such happiness.
I would also like to thank my family my parents, do anything they can to support my studies and give every through my entire life. In particular, I must acknowledge my wife and best
this thesis. A particular thanks to my son, Jianghan ZHANG, your smiles, the voice calling papa, is my best incentive.
The smooth progress and successful completion of my experiment and paper is never possible without the help of members in this lab. f.i. Nathalie FAUST help to prepare documents for my VISA application, Philippe GAMBRON help to set up my printer, Rodrigo GULARTE MERIDA helps in R parallelization programming….. Sincerely thanks for all kinds of help during these years from you.
In conclusion, I recognize that my living would not possible without the support of Chinese scholarship council (File No. 2008836040); I recognize that this research would not have been possible without the financial assistance of by grants of the Service Public de Wallonie and from the Communauté Française de Belgique (Biomod ARC). I also acknowledge University of Liège (SEGI and GIGA bioinformatics platform) for the use of NIC3 and GIGA-grid supercomputers.
A.I. Artificial insemination
BBC Belgian Blue Cattle
BLAD Bovine leukocyte deficiency
BLUP Best linear unbiased prediction
BS Brachyspina
BVs Breeding values
CC Collaborative cross
CI Confidence interval
CMT Charcot-Marie-Tooth disease
CNV Copy number variation
CNVRs CNV regions
CRC Calcium release channel
Cs29 Chromosome29
Cs6 Chromosome6
CVM Complex Vertebral Malformation
DAG Directed acyclic graph
DH Draft horses
DNA Deoxyribonucleic acid
DUMPS Deficiency in uridine monophosphate synthetase
eQTL Expression QTL
FDR False discover rate
GLMMs Generalized linear mixed models
GRAN Granulocyte count
GRAR Granulocyte count percentage
GS Genomic selection
GWAS Genome-wide association study
HCT Hematocrit
HGB Hemoglobin
HGP Human genome project
IBD Identical-by-descent
LB Lysogeny broth
LD Linkage disequilibrium
LMMs Linear mixed-models
LYM Lymphocyte count
LYMA Lymphocyte count percentage
MAAT Marker-assisted association test
MAF Minor allele frequency
MASA Marker assisted segregation analysis
MCH Mean corpuscular hemoglobin
MCHC Mean corpuscular hemoglobina concentration
MMBIR Microhomology-mediated break-induced replication
MME Mixed model equations
MON Monocyte count
MONR Monocyte count percentage
MPV Mean platelet volume
MSTN Myostatin
NGS Next-generation sequencing
NMRD Non-sense mediated RNA decay
OR Odd ratios
ORF Open reading frame
PCR Polymerase chain reaction
PCT Plateletcrit
PDW Platelet distribution width
PLT Platelet count
QCT Quantitative complementation test
QQ Plots Quantile-quantile plots
QTL Quantitative trait loci
RBC Red blood cell count
RDW Red blood cell volume distribution width
REML Restricted maximum likelihood
RLN Recurrent laryngeal neuropathy
RNF11 RING finger protein 11
SCC Somatic cell counts
SNP Single-nucleotide polymorphism
TH Thoroughbreds
TR Trotters
UTR Untranslated region
W Warmbloods
Résumé ... 4
Description du sujet de recherche abordé ... 4
Résultats ... 4
Conclusions et Perspectives ... 5
Summary ... 6
Description of the research project ... 6
Results... 6
Conclusions and Perspectives ... 7
Introduction ... 8
Heritable traits ... 8
Identifying causative variants ... 12
Identifying causative genes ... 19
Missing heritability ... 22
Uses of genomic markers in livestock management ... 27
Objectives ... 32
Part 1. Development and characterization of a haplotype-based
method for association mapping of complex traits ... 33
Ancestral haplotype-based association mapping with generalized linear mixed models accounting for stratification ... 34
Abstract ... 34 Introduction ... 35 Methods ... 37 Results ... 40 Discussion ... 44 Acknowledgments ... 47
mapping of complex traits ... 54
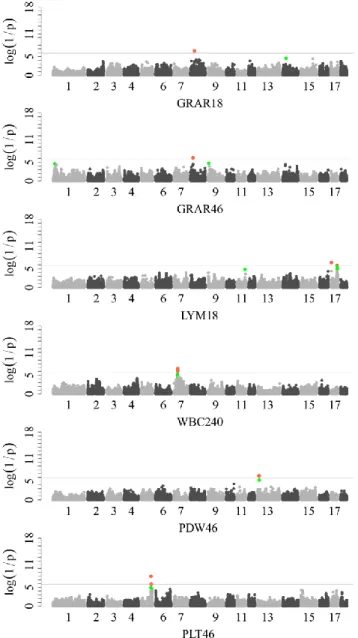
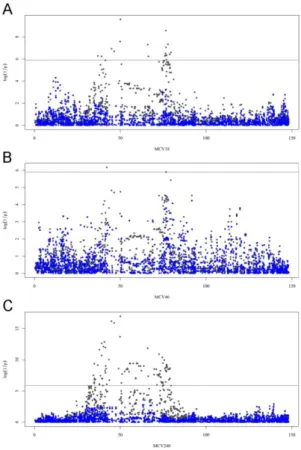
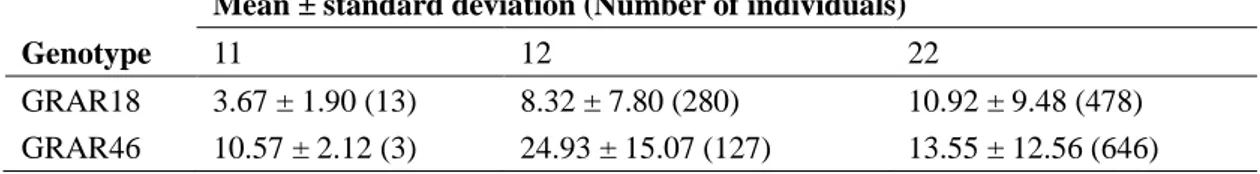
Genome-wide Association Study Reveals Constant and Specific Loci for Hematological Traits at Three Time Stages in a White Duroc × Erhualian F2 Resource Population ... 55
Abstract ... 55
Introduction ... 56
Material and Methods ... 57
Results ... 59
Discussion ... 62
Conclusion ... 65
Results of a haplotype-based GWAS for Recurrent Laryngeal Neuropathy in the horse ... 74
Abstract ... 74
Introduction ... 75
Materials and Methods ... 76
Results ... 79
Discussion ... 81
Acknowledgments ... 84
A Splice Site Variant in the Bovine RNF11 Gene Compromises Growth and Regulation of the Inflammatory Response ... 93
Abstract ... 93
Author Summary ... 94
Introduction ... 94
Results ... 95
Discussion ... 99
Materials and Methods ... 100
Acknowledgments ... 104
Detection of copy number variants in the horse genome and examination of their association with recurrent laryngeal neuropathy ... 111
Abstract ... 111
Results ... 112
Acknowledgements ... 114
Abstract ... 132
Results ... 133
Methods summary ... 137
Methods ... 138
Supplementary material ... 154
Part 3: Taking advantage of genetic marker information in animal
breeding ... 161
Marker imputation with low-density marker panels in Dutch Holstein cattle ... 162
Abstract ... 162
Introduction ... 163
Material and Methods ... 163
Results and discussion ... 166
Conclusions ... 172
Acknowledgements ... 172
Identifying cows with sub-clinical mastitis by bulk SNP genotyping of tank milk ... 176
Abstract ... 176
Introduction ... 177
Materials and Methods ... 178
Results ... 180
Discussion ... 181
Acknowledgments ... 182
Conclusions and Perspectives ... 187
Résumé
Description du sujet de recherche abordé
Jusqu’il y a peu, les valeurs d’élevage des animaux étaient estimées sur base de données phénotypiques mesurées sur l’individu et/ou ses apparentés, et la notion que la covariance entre valeurs d’élevages est proportionnelle au coefficient de parenté entre individus. L’essor de la génomique permet maintenant l’analyse directe du génome et l’identification des loci qui déterminent les valeurs d’élevage des individus. En conséquence, la sélection « assistée par marqueurs » ou « génomique », plus performante, est en passe de remplacer la sélection phénotypique.
L’identification des régions génomiques et des variants génétiques qui contrôlent les phénotypes d’intérêts requiert des méthodes statistiques avancées en constante évolution. Dans le cadre de cette thèse, nous avons (i) contribué au développement de méthodes de cartographie génétique, (ii) appliqué ces méthodes pour cartographier des loci influençant des phénotypes d’intérêt, tant métriques que méristiques, et (iii) contribué au développement de méthodes pour l’utilisation d’information génomique en sélection et production animales.
Résultats
Les méthodes de cartographie que nous avons contribué à développer se distinguent principalement pas le fait que (i) elles exploitent la structure haplotypique du génome (à l’aide d’un modèle markovien caché) ce qui devrait augmenter le déséquilibre de liaison avec les variants causaux et ainsi la puissance de détection, (ii) elles exploitent simultanément l’information de liaison génétique dans les familles et d’association à l’échelle de la population, (iii) elles corrigent pour la stratification en modélisant un effet polygénique aléatoire, et (iv) elles s’appliquent aussi bien à des phénotypes quantitatifs que binaires.
Nous avons ensuite appliqué les méthodes développées (et d’autres) pour la cartographie de loci influençant (i) des paramètres hématologiques chez le porc, et (ii) des caractères binaires
comprenant des maladies héréditaires simples ou complexes et des variations génomiques structurelles de type Copy Number Variants (CNV) chez le bovin et le cheval.
In fine, nous avons contribué au développement de méthodes pour l’utilisation d’information génomique en production animale. Nous avons contribué à l’extension de la méthode de cartographie basée sur des haplotypes à des fins d’imputation et avons évalué la précision de celle-ci dans des scénarios proches de la réalité. En outre, nous avons contribué au développement d’une méthode permettant d’identifier des vaches atteintes de mammites dans l’exploitation, par génotypage d’un échantillon de lait de la cuve (mélange de laits de toutes les vaches de l’exploitation).
Conclusions et Perspectives
En conclusion, nos travaux ont mené au développement d’un logiciel (« GLASCOW ») qui est utilisé de façon croissante par la communauté scientifique pour la localisation de gènes influençant des phénotypes à déterminisme complexe, en particulier binaire. Nous avons, en utilisant la méthode développée, contribué à la localisation de régions génomiques influençant plusieurs caractères d’intérêt chez le porc, le bovin et le cheval. Et – in fine - nous avons contribué au développement de méthodes permettant de réduire des coûts d’accès à la technologie génomique, d’une part en complétant du génotypage réel par du génotypage in silico par le procédé d’imputation, et d’autre part en développant une méthode de déconvolution de génotypes obtenus sur mélanges d’ADN.
Summary
Description of the research project
Until recently, breeding values were estimated based on phenotypes measured on the individual and its relatives, and the notion that the covariance between breeding values is proportionate to the kinship coefficient. Advances in genomics now allow for direct analysis of the genome and identification of the loci that determine the breeding values of individuals. As a consequence, marker assisted selection and genomic selection have become more effective and are replacing conventional selection.
The identification of loci influencing the traits of interest requires the use of advanced statistical methods that are constantly evolving. In the context of this thesis, we have (i) contributed to the development of gene mapping methods, (ii) applied these methods to map loci influencing both metric and meristic traits, and (iii) contributed to the development of methods for the integration of genomic information in livestock breeding and management.
Results
The mapping methods that we have helped developing distinguish themselves mainly by the fact that (i) they exploit haplotype information (by means of a hidden markov model) which should increase the linkage disequilibrium with causative variants and hence detection power, (ii) they can simultaneously extract linkage information within families, and linkage disequilibrium information across the population, and (iii) they correct for population stratification by means of a random polygenic effect, and (iv) they can be applied to binary as well as quantitative traits. We have applied these and other methods to map loci influencing (i) quantitative hematological parameters in a porcine line-cross, and (ii) binary traits including diseases in bovine and non-syntenic Copy Number Variants in cattle, horse and human.
In fine, we have contributed to the development of methods for the utilization of marker information in animal selection and production. We have extended the haplotype-based mapping method to allow imputation and have evaluated the utility of this approach in scenarios mimicking reality. We have also contributed to the development of a method to quantify somatic cell counts
in the milk of individual cows by genotyping a sample of milk from the farm’s tank (hence a mixture of milk from all cows on the farm).
Conclusions and Perspectives
Our work has resulted in the development of a software package (“GLASCOW”) that is increasingly used by the community to map genes influencing complex traits, primarily binary. By using this tool, we have contributed to the localization of several trait loci in pig, cattle, horse and human. We have contributed to the development of approaches that reduce the costs of genomic analyses in livestock by, on the one hand, complementing real SNP genotypes with genotypes obtained in silico by means imputation, and, on the other hand, by developing a method to deconvolute genotypes obtained on DNA pools.
Introduction
Key concepts in association mapping and
the use of marker information in livestock production.
Heritable traits
Vive la différence! What defines us as individuals is how we differ from each other. “How tall
am I?” essentially asks whether I am amongst the tall, average or small ones of my class. Very
early in life, we learn to recognize a myriad of the distinctive features of our contemporaries, which we use to recognize, seek contact or rather avoid them.
We also know intuitively that most of these differences do not occur just randomly, as if a deity had bestowed each one of us with a random assortment of features, but that they are largely determined by and hence define our origins. Origins shape distinctive features in three ways: (i) the environment in which we develop profoundly affects our identity, (ii) our “way of life”, or
cultural heritage, determines much of whom we are, and (iii) the genome we inherited from our
parents provides each of us with a unique blueprint, or set of instructions that guides our development.
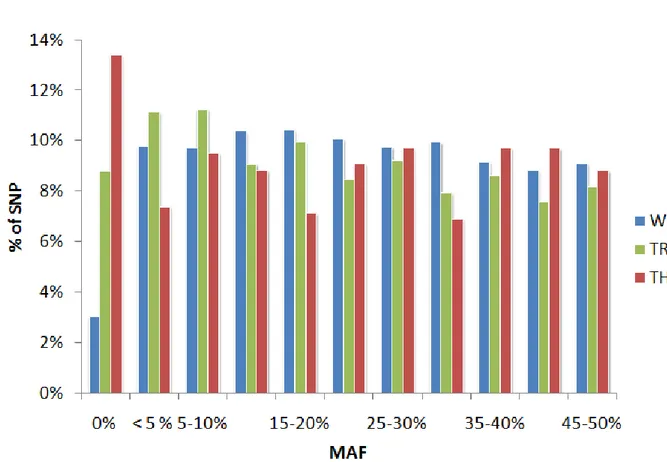
How does the genome inherited by our parents contribute to our phenotypic differences? All of us inherit one genome copy from our father (sometimes referred to as “padumnal”), and genome copy from our mother (sometimes referred to as “madumnal”). They obviously are both “human genomes”, being very similar to each other and certainly more similar to each other than to the genome of any other species. Yet they are not identical: aligning our padumnal and madumnal genomes – a still mostly virtual exercise which will however soon become practical – would reveal a different base pair approximately every 1,000 residues. Such differences are referred to as Single Nucleotide Polymorphisms or SNPs of which there are approximately 3 million in a typical human genome. Compiling all SNPs at the population level reveals tens of millions of SNPs. SNPs are characterized by at least two alleles of which one is typically less common than the other: the minor allele. The population frequency of the minor allele (or MAF) allows one to
make the rather arbitrary distinction between common SNPs (f.i. MAF ≥ 5%), low frequency SNPs (f.i. 0.5% < MAF < 5%), and rare SNPs (MAF ≤ 0.5%). Approximately 38 million SNPs have now been reported of which 7 million are common SNPs (f.i. Frazer et al. 2009; The 1000 Genomes Project Consortium 2012). SNPs, which include transitions, transversions and single base-pair insertion deletions (indels), are only one type of genetic variants. Others include larger indels, simple sequence repeats (including micro- and minisatellites), copy number variants (CNVs), inversions, and translocations. Copy Number Variants are large genome segment whose copy number varies between individuals. They often coincide with segmental duplications. Known CNV affect an estimated 4% of our genome and 13% of our genes (Conrad et al. 2010). All genetic variants - whichever their type - originate from germ-line mutations. Every gamete carries of the order 50 to 100 de novo point mutations (generating a “derived” from an “ancestral” allele), which primarily results from errors of DNA replication in the germline. Sperm cells, particularly from older men, carry more de novo mutations than oocytes as the number of cell divisions to produce spermatozoa are larger than for oocytes (Hurles 2012). The fate of the de novo mutations inherited by a conceptus is determined by drift, and – for non-neutral mutations (see hereafter) – by selection. The balance between the gain of new variants by mutation, and the loss of variants by drift, results in a steady state equilibrium characterized – for neutral variants – by a predictable rate of polymorphism with predictable distribution of MAF (Kimura 1983). The expected homozygosity at equilibrium is:
H
=
1
4Ne
m +
1
where Ne is the effective population size and
m
the mutation rate per gamete. The majority of SNPs are thought to be largely neutral with respect to phenotype. A minority is assumed to affect gene function, either by altering the gene’s expression profile, or by changing the three-dimensional structure and hence function of the gene product. The latter are susceptible to affect the individual’s phenotype – they are said to be “causative” SNPs. As many of them encompass genes, CNVs are thought to more often than SNPs affect gene function and hence make a significant impact on phenotypic variation. Causal SNPs may undergo effect of selection (f.i. Bamshad & Wooding 2003; Sabeti et al. 2006; Cutter & Payseur 2013). Negative selection against deleterious variants will reduce the level of polymorphism and shift the MAF distributionto lower values. Positive selection and balancing selection will leave their own signatures on the genome. Selection on causative variants may affect the fate of their neural neighbors.
Alleles may – in principle – differ “epigenetically” (i.e. by virtue of distinct heritable DNA or chromatin modifications) rather than in their sequence. Such metastable epialleles have been shown to segregate in plant populations and contribute to phenotypic differences (f.i. Hauser et al. 2011). It is generally believed however that the epigenetic status of genes is largely reset in the mammalian germline, precluding the widespread occurrence of epialleles in mammals, except for the marks that differentiate the padumnal and madumnal alleles of parentally imprinted genes (f.i. Morgan & Whitelaw 2008).
For a minority of traits, inter-individual differences are entirely determined by genetic variants at one gene. Such “Mendelian” traits are said to be monogenic. The causative variants may be (completely or partially) recessive or dominant. The vast majority of monogenic traits are inherited diseases (including “inborn errors of metabolism”) in humans, and inherited diseases and coat color variants in domestic animals. They commonly involve severe, recessive loss-of-function variants dominated by nonsense, frameshift, splice-site and damaging missense variants in protein coding genes.
The vast majority of phenotypes, including common diseases and agricultural important phenotypes, have a multifactorial or complex determinism. Inter-individual differences are determined by environmental, cultural and genetic factors. Genetic effects are generally assumed to be “polygenic”, i.e. depend on multiple genetic variants affecting multiple genes. The number of genes involved remains largely unknown for most traits. The distribution of allele-substitution effects appears to be exponential, i.e. variants with large effects are less numerous than variants with small effects (f.i. Hayes & Goddard 2001). There also appears to be an inverse correlation between effect size and MAF, which is thought to primarily reflect purifying selection against variants with large effects (f.i. Manolio et al. 2009). Molecular evidence from model organisms suggests that epistatic interactions between polygenes might be commonplace, i.e. that the effect of a genotype at one locus is dependent on the genotype at another locus (f.i. Bloom et al. 2013). Yet, initial studies have not revealed a major contribution of epistatic effects to the variance of most studied traits in human and livestock (f.i. (Cordell 2009). Complex phenotypes include continuously distributed quantitative traits (f.i. most production traits in agriculture), as well as
binary traits (f.i. common complex diseases). It is noteworthy that a detailed analysis of inherited defects that are generally labeled monogenic, often reveals instances of incomplete penetrance and variable expressivity. Monogenic traits therefore often appear only simple on the surface.
The proportion of the inter-individual variation – for a trait of interest – that is due to genomic differences is called the heritability (H2) of the trait (Visscher et al. 2008). H2 is a population-specific parameter, i.e. the same phenotype may have different H2 in different populations or even in the same populations at different times. This is due to the fact that the panoply of segregating sequence variants (and their MAF) as well as of non-genetic factors influencing the phenotype are most likely to differ between populations. A common way to estimate H2 in humans is to compare the resemblance between monozygotic and dizygotic twins. Monozygotic and dizygotic twin pairs are assumed to be equally exposed to environmental and cultural influences, but differ in their degree of genetic resemblance: monozygotic twins are genetically identical while dizygotic twins are genetically as related as non-twin sibs. A higher phenotypic resemblance between monozygotic than between dizygotic twins does support a quantifiable contribution of genomic polymorphisms to trait variation. In domestic animals, the heritability is typically estimated from the correlation between the phenotypic and genetic resemblance or kinship, increasingly using the mixed “individual animal” model. It is assumed in these studies that genetic resemblance is not correlated with environmental resemblance. The individual animal model rests on Fisher’s mathematically convenient infinitesimal model, i.e. the trait is influenced by an infinitely large number of variants with individually minute effects that are evenly scattered throughout the entire genome. The “broad sense” H2 heritability can be partitioned in an additive component (narrow sense h2) and a non-additive residual. h2 is of particular interest in agriculture as it constrains the success of selection programs. The heritability of a complex binary trait (such as a common complex disease) is generally estimated by assuming the existence of an underlying (non-observed), continuously distributed “liability”
Identifying causative variants
Motivation and basic principles. Identifying the causative variants influencing heritable traits of
medical and agronomic importance is one of the most active areas of research in the life-sciences. This is due to the fact that recent advances in genomic technologies makes this one of the most effective experimental designs to improve our understanding of the molecular mechanisms underpinning disease and agricultural production, which may contribute to the development of improved methods of diagnosis (medicine) and selection (agriculture), as well as of treatment (medicine) and production (agriculture).
The basic principles of the “forward genetic” approach towards identifying causative variants influencing a trait of interest are extremely simple and based on the examination of the correlation between phenotype and genotype (for a given variant). Thus, assume a population of individuals that have been (i) evaluated for the phenotype of interest, and (ii) for which the entire genomic sequence has been determined. In principle one can measure the correlation between phenotype and genotype for all variants. Practically this is done either by sorting the individuals by phenotype (f.i. cases vs controls) and checking for different genotype frequencies between groups, or by sorting the individuals by genotype and checking for different phenotype means between groups. One expects such a correlation to exist for causative variants.
Avoiding spurious associations. The issue is that such phenotype-genotype correlation may also
exist for “passenger” (i.e. non causative) variants. This will be the case if the genotype at the passenger variants is correlated with the genotype at causative variants, or with environmental or cultural effects that influence the phenotype (f.i. Platt et al. 2010).
Correlation between genotype at passenger and causative variants is expected for closely linked variants. The corresponding correlation is referred to as “linkage disequilibrium” (LD) or “gametic association”. De novo mutations are initially completely associated with the haplotype characterizing the chromosome upon which they occurred (a haplotype is a combination of alleles for a set of neighboring variants). If the newly derived allele spreads in the population it will progressively re-assort with distinct haplotypes by meiotic recombination. With time the initial association should erode and equilibrium attained (i.e. independent genotypes at neighboring
variants). Yet, drift continuously regenerates LD. At equilibrium, the expected squared correlation between the genotypes of adjacent variants is:
r
2=
1
4Ne
q
+
1
+
1
n
where
q
is the recombination rate between the variants, and n the sample size in whichr
2 is measured. Unless LD between passenger and causative variants is perfect (r2=1), the correlation between phenotype and genotype should be highest for the causative variant. Yet, this prediction may not apply if multiple closely linked causative variants co-segregate in the population. Such “allelic heterogeneity” appears to be the rule rather than the exception, at least in human populations. Passenger variants that are in LD with multiple causative variants may by chance be more strongly associated with the phenotype than the individual causative variants, a phenomenon referred to as “synthetic association” (f.i. Dickson et al. 2010; Platt et al. 2010). At present the best way to untangle such dependencies is to simultaneously fit multiple if not all variants in a “multivariate” analysis. Thus, one wants to estimate the effect of each variant on phenotype conditional on the genotype of all other variants in the vicinity. This approach is only applicable for variants that are not in perfect LD with each other (i.e. it is impossible – using this approach - to differentiate passenger and causative variants that are in perfect LD in the studied population). Multi-colinearity issues make it sometimes even difficult to differentiate variants that are in high, although not perfect LD.Correlation may also exist between passenger variants and non-syntenic (markers located on a different chromosome) causative variants. This is a very common occurrence in domestic animals, particularly in cattle population relying extensively on artificial insemination. Assume a polygenic trait such as milk production. Highly significant “sire effects” are commonplace. Any rare variant carried by a sire with superior breeding value would “tag” its descendants and be associated with increased milk production because of its association with the polygenic background underlying the high breeding value. This is one example of spurious association due to “population stratification”. In this example, the trait of interest is directly affected by the causal polygenes. In another form of stratification, the studied population comprises sub-groups exposed to distinct environments or cultural influences, which are influencing the phenotype of interest. Variants tagging sub-populations will show association with the phenotype by virtue of
their correlation with the sub-group specific non-genetic effects. The spurious associations due to stratification can be avoided by explicitly modeling the sub-populations. Genome-wide marker information can be used to uncover the underlying population structure. This can be done by unsupervised clustering using for instance the STRUCTURE programs (Pritchard et al. 2000), by means of principal components using for instance the EIGENSTRAT programs (Price et
al. 2006), or – increasingly – by modeling a random polygenic effect with covariance structure
proportionate to genome-wide kinship estimated from genotype data (f.i. Price et al. 2010). An elegant and effective approach to avoid spurious association of passenger variants that are not closely linked to causative variants is to simultaneously test for linkage and association. In humans, this is typically achieved by analyzing parent-offspring trios and performing a “transmission disequilibrium test” (TDT) (f.i. Ewens & Spielman 2003). In the case of a binary trait such as a disease, the TDT tests whether a specific variant is over-transmitted by heterozygous parents to affected offspring. This will only be the case if the analyzed variant is associated (at the population level) and “linked” (at the familial level) with a causative variant (or itself a causative variant). Because of their specific structure, domestic animal populations offer ample opportunity to simultaneously extract linkage and association information. LD- and linkage information can be merged to estimate identity-by-descent (IBD) probabilities for all pairs of chromosomes in the dataset and these can be used to test whether a chromosome region is associated and in linkage with variants influencing the trait of interest (f.i. Meuwissen et al. 2002; Druet & Georges 2010).
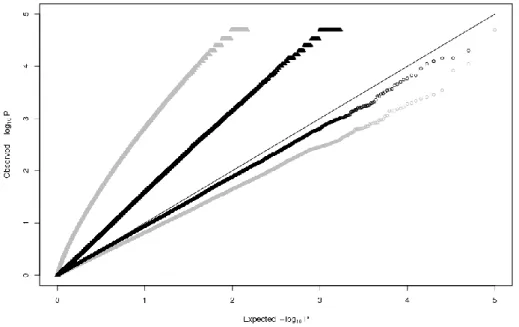
Stratification will lead to an overall inflation of the test statistic for association. The occurrence of residual stratification effects can therefore be evaluated by examining the distribution of the test statistic (for all or a selection of variants scattered throughout the genome) using – for instance - a quantile-quantile (QQ) plot. A shift towards lower p-values suggests stratification. To control the level of false positives, the thresholds to declare significance can be decreased accordingly in a procedure referred to as “genomic control” (f.i. Devlin & Roeder 1999). It should be noted that the shift towards lower p-values resulting from population stratification will in some cases be due to actually causative polygenic variants. Some people have therefore rightfully argued that this procedure “throws the baby with the bathwater”.
Compensating for incomplete genotype information. Thus far, we have made the presumptuous
assumption that the entire genome sequence would be available for all individuals in the dataset. While this may become reality in the future, it is not yet the case. This hasn’t stopped geneticists from engaging very actively in genome-wide association studies (GWAS) in many organisms, including men and domestic animals. This was made possible because of the pervasive linkage disequilibrium across the genome in these organisms. In most Out-of-Africa human populations, a panel of passenger SNPs with a density of 1 SNP per 5Kb captures 80% of common causative variants wit r2 ≥ 0.8 (f.i. The International HapMap Consortium 2007; Bhangale et al. 2008). It has become customary in human genetics to perform GWAS using SNP panels comprising between 300,000 and > 1 million SNP variants, which can be cost-effectively interrogated using commercially available micro-arrays. As LD extends over longer genomic regions in domestic animals than in human, GWAS are typically performed using panels interrogating an order-of-magnitude less markers than in human, i.e. from 50,000 to 750,000 (Goddard & Hayes 2009). The use of such panels should thus allow the identification of regions of the genome encompassing common causative variants. However, identification of the actual causative variants requires subsequent targeted “fine-mapping” efforts.
In some instances, the per-SNP information content has been optimized by taking advantage of prior knowledge about the LD structure of the genome (The International HapMap Consortium 2005, 2007, 2010). The human HapMap project genotyped 270 individuals representing three major ethnic groups for 3.1 million common SNPs. Examination of the LD patterns between closely linked SNPs revealed a step-wise rather than gradual decrease in LD with distance. LD was found to be high within 50Kb segments of the genome referred to as haplotype blocks, which are separated from each other by recombination hotspots causing abrupt drops in LD. The typical haplotype block comprises 5 to 10 common haplotypes accounting for the majority of the chromosomes observed in the population. Rather than selecting SNPs at random, some manufacturers of SNP genotyping arrays selected panels of “tagging SNP” that tag as many common haplotypes as possible. Similar strategies, albeit with less resolving power, were applied to develop some of the SNP genotyping arrays used in domestic animals (f.i. Matukumalli
So far, the vast majority of GWAS studies have used single SNP association tests. Thus, SNP genotype frequencies were compared between cases and controls or the effect of SNP genotype on the quantitative trait of interest was evaluated. The power to detect the effect on phenotype of a unseen causative variant by means of an interrogated “marker” SNP is strongly dependent on the degree of LD between the marker SNP and the causative variant. Assuming that a sample size of
n would be needed to detect the effect of the causative variant if it were directly interrogated, a
sample size of n r2will be needed to detect the same effect via a marker SNP in LD of r2 with the causative variant (as
nr
2corresponds to the Pearson test statistic for independence (f.i. Balding 2006). The detection power thus drops rapidly with decreasing LD between interrogated and causative SNPs. One way to overcome this is to perform association analyses using haplotypes, i.e. combination of adjacent SNPs. Ideally this requires “phasing” of the genotype data, i.e. sorting the alleles by parental origin. This is most reliably accomplished using genotype information from the parents. However, even in the absence of parental information (which is the most common scenario), the most likely linkage phase can be estimated with some degree of accuracy for strings of SNPs in LD. The hope of the haplotype-based approaches is that one of the haplotypes will be in higher LD with the causative variants than anyone of the composite SNPs considered individually, hence increasing the association signal. Many haplotype-based approaches use “windows”. These can be sliding window with fixed number of SNPs (Lin et al. 2004). Alternatively the boundaries of the windows can be set such as to coincide with the limits of known haplotype blocks. Throughout this thesis, we use a Hidden-Markov-Model based approach that obviates the need for windows (f.i. Druet & Georges 2010).An alternative approach to extract more LD information from the incomplete set of genotyped SNPs that is being extensively used in human genetics is “genotype imputation”. Imputation corresponds to the in silico prediction of an individual’s genotype for variants that have not been genotyped experimentally (Marchini & Howie 2010). In simplified terms, this is done by identifying individuals in a very densely genotyped reference population (f.i. the HapMap or full-sequenced 1,000 Genomes Project populations) that regionally carry the same haplotypes as the “individual to impute”. The dense genotypes of the corresponding haplotypes are then
projected from the reference population to the study population. This can be accomplished for the entire genome. GWAS are subsequently conducted one SNP at the time using genuinely genotyped SNPs as well as (the often more numerous) imputed SNP. All variants cannot be imputed with equal accuracy: low frequency variants or variants located in recombination hotspots are typically more difficult to impute. Such variants are penalized in the association studies, which complicates comparison between SNPs. Imputation has also been essential to merge datasets genotyped with different arrays in common meta-analyses.
Accounting for multiple testing. In nearly all instances, the objective of GWAS is to pinpoint
chromosome regions that are thought to encompass truly causative variants. Therefore, one has to define a threshold for the test statistic above which to reject the null hypothesis of absence of association. This threshold has to account for the fact that a genome-scan implies the realization of many tests. Using a nominal threshold corresponding to a type-I error rate of 5% (for a single test) would thus generate 5,000 false positive associations when testing 100,000 “independent” (not in LD) SNPs, even in the absence of a single true genetic effect. The traditional way to deal with this multiple testing issue is to adapt the threshold for the number of independent tests performed using either a Bonferroni or related Sidak correction. This requires the determination of the number of independent test performed, which can be achieved using a variety of approaches often exploiting permutation testing. In human genetics, the recommended threshold for GWAS corresponds to a nominal p-value of 10-8, implying the realization of 5 million independent tests (Hirschhorn & Daly 2005). Thresholds applied in animal genetics are typically somewhat more lenient as the number of tested SNPs is considerably lower and LD assumed to be more pronounced. In addition to imposing these very significant significance thresholds, good practice guidelines demand confirmation of the significant hits in an independent data set to warrant publication in the best journals.
An alternative approach, rather than considering individual p-values independently, exploits information from the distribution of p-values across all tests performed. If all tests correspond to true null hypotheses, the distribution of p-values is expected to be uniform, i.e. 5% of tests will have p-values between 0 and 5%, 5% will have p-value between 5 and 10%, etc. An excess of test with low p-values suggest the occurrence of true alternative hypotheses amongst the tests performed. Assume that 20% of the tests have a p-value between 0 and 5%, this implies that
three out of four of these tests are true alternative hypotheses. If we select these tests as “positive discoveries”, we can therefore expect a false discovery rate (FDR) of one in four. The distribution of p-values across all tests performed is typically examined using QQ-plots. The exact FDR for individual tests can easily be computed using standard theory. The FDR approach will typically be more efficient at identifying true alternative hypotheses if these represent a large enough proportion of realized tests (Storey & Tibshirani 2003).
Rare variants. It was recognized from the onset that the SNP panels used for GWAS were best
suited to tag common causative variants. Population genetic arguments supported the notion that common complex diseases would involve common risk variants, i.e. the so-called Common
Disease Common Variant Hypothesis (CDCV) (Reich & Lander 2001). However, as surmised
by some very early on (Pritchard 2001), it has become increasingly apparent that low frequency and rare risk variants also contribute to inherited risk and the heritability of quantitative traits in human populations. As a matter of fact low frequency and rare variants appear to have larger effects than common variants resulting in stronger purifying selection (which reduces their frequency) (Gibson 2012). The contribution of rare variants to the heritability of agriculturally important traits in livestock remains largely unknown.
Detecting rare causative variants poses specific challenges. Rare variants are typically poorly tagged by interrogated SNPs, certainly if analyzed one-by-one. It is likely that GWAS will soon be conducted with exome-wide followed by genome-wide resequence data rather than SNP genotype data, which should alleviate this detection issue. However, as rare variants are – by definition – rare, performing an association test remains difficult as too few individuals carry the variant to allow for the realization of a meaningful test. This limitation becomes obvious for “singletons”, i.e. variants that are only observed once in the studied data set. A singleton observed in a case confers an infinitely large relative risk that will, however, never be significant: it’s p-value is 0.5.
One way to include rare variants in association studies is to analyze them in “aggregate” rather than individually. The first such a family of approaches are the “burden tests”. The underlying premise is that variants disrupting the function of the causative gene will be enriched in individuals with extreme phenotypes. In case-control studies, cases can be considered as extremes. For quantitative phenotypes one can select individuals in the tails of the distribution.
Given our present limited understanding of molecular biology, the only variants that can confidently be predicted to be “disruptive” are those affecting the protein sequence, including nonsense, frame-shift, splice-site, and – to a lesser extend – missense variants. Performing a burden test therefore typically consist in (i) sequencing one or more (or all) genes of interest in extreme individuals, (ii) identifying low frequency and rare variants that are predicted to disrupt gene function, and (iii) comparing the cumulative frequency of the corresponding variants between opposite extremes (f.i. cases vs (super-)controls) (Bansal et al. 2010). This approach has been applied to several common diseases and has unexpectedly revealed as many cases of enrichment of rare risk variants in cases, as of enrichment of rare protective variants in controls (Nejentsev et al. 2009; Momozawa et al. 2011; Rivas et al. 2011).
One of the limitations of the burden tests is that they assume that all disruptive variants in given gene affect the phenotype in the same manner: either all of them increase the phenotype (f.i. disease risk), or all of them decrease it. The C-alpha test has been developed to overcome this limitation for low frequency variants (it is not applicable to singletons). It looks for an aggregated overdispersion of the distribution of disruptive variants (in a given gene) between f.i. cases and controls, i.e. the fact that some of the variants tend to preferentially cluster in cases, while others tend to preferentially cluster in controls (Neale et al. 2011).
Identifying causative genes
Identifying causative variants influencing diseases and agronomically important traits is certainly one of the major objective of GWAS, yet identifying the genes which these variants perturb, i.e. the causative genes, is certainly equally if not more important. Indeed, it is this knowledge that paves the way to improved treatment regimes in medicine.
If the causative variants are coding variants, i.e. they change the amino-acid sequence of the gene, the identity of the target causative gene leaves little doubt. There is growing evidence however that a substantial proportion of causative variants are regulatory variants, affecting the expression profile of target genes rather than the structure of their product. As cis-acting regulatory elements can be hundreds of thousands and even millions of base-pairs away from the genes they regulate, the identification of the causative genes perturbed by regulatory variants remains a major challenge.
An extremely elegant genetic test of gene causality has been developed and applied in the model organisms D. melanogaster and S. cerevisiae: the reciprocal hemizygosity test (Long et al. 1996; Steinmetz et al. 2002). The typical scenario in which this test becomes useful in model organism, is following the mapping of a Quantitative Trait Locus (QTL) to a specific location in an intercross population. Assuming that the confidence interval for the QTL contains a number of genes, the question becomes which one or several of the genes in the interval underlie the QTL effect. To respond to that question pairs of reciprocal F1 hemizygotes are generated for all positional candidate genes. This can be done increasingly effectively by homologous recombination. Thus for each gene, a pair of hemizygotes is produced by knocking out the allele coming from either the “A” or the “B” strain. If the examined gene is not involved in the QTL effect, the reciprocal hemizygotes will be functionally equivalent: their phenotype will not differ significantly (yet may differ from the original F1 individuals). If, on the contrary, the gene is the causal gene, one reciprocal hemizygote will be functionally “Q-“, while the other will be “-q” (in which Q and q represent the alternate alleles at the QTL). This will cause the reciprocal hemizygotes to differ phenotypically.
Generating series of reciprocal hemizygotes is obviously an arduous task in organisms other than yeast. A less demanding variation of the reciprocal hemizygosity test is “quantitative
complementation” (Mackay 2001; Georges 2007). In this approach, one generates one
knock-out per positional candidate gene, which is subsequently mated to animals from the mapping population in order to generate “A-“ and “B-“ animals. The premise of the test is that the contrast between the phenotype of these alternative hemizygous lines will be larger than the “A+” versus “B+” contrast if the candidate gene is causative, and not otherwise. Quantitative complementation has been applied in D. melanogaster and a couple of times in the mouse (Yalcin
et al. 2004). Its application in outbred populations including human and domestic animals may
appear impossible. Yet, naturally occurring null alleles for a substantial number of genes segregate in these populations at sometimes appreciable frequencies. It may thus, at least in theory, be possible to identify individuals with “C-“ and “c-“ genotype (where C and c would be alternative alleles for a causative variant) and compare their phenotypes. This approach has been proposed and applied once in cattle (Karim et al. 2011).
The other formal test for gene causality - which is easier to apply in outbred populations - is the previously described “burden test”. Imagine that a locus influencing a trait of interest has been identified by GWAS and that it encompasses n genes. The positional candidate genes can be deeply sequenced in cohorts of extreme individuals (f.i. cases and controls). The demonstration of a differential “burden” of rare disruptive mutations in either cases or controls for one of the candidate genes would unambiguously identify the causative gene(s). One of the main difficulties with the burden test is to reliably identify disruptive mutations. Contaminating the collection of candidate disruptive mutation with neutral ones rapidly undermines statistical power. It has recently been suggested that it might be better to avoid missense variants (and only use stop-gains, frameshift and essential splice site variants) in the burden test, as well as to incorporate information about de novo mutations (requiring the analysis of parent-offspring trios) (He et al. 2013).
While elegantly simple in principle, the burden test requires sequencing of very large cohorts to achieve adequate power. This power is rapidly eroded by multiple testing if one intends to study many positional candidate genes. This is probably one of the main reasons why application of the burden test at genome-wide level by exome sequencing has not yet yielded the results that were hoped for. It is thus advisable to carefully preselect the candidate genes to subject to a burden test. One way to do this is to first apply the burden test to genes mapping to GWAS-identified loci. One can additionally increase the prior probability of success by applying network analysis. Gene networks that are shown to be significantly overpopulated within such sets of GWAS-identified positional candidates are likely to be enriched in genuine causative gene (Raychaudhuri et al. 2009; Rossin et al. 2011). An alternative strategy to prioritize positional candidates is to use eQTL information if available. Thus, an eQTL association signal for a positional candidate gene in a phenotype-relevant cell type that would resemble the association signal for the phenotype would be a strong candidate gene to subject to a burden test (Montgomery & Dermitzakis 2011).
It remains unclear whether the burden test is applicable to all types of causative genes. Many gene products fulfill distinct functions in multiple tissues and at different stages of development, driven by tissue/timing-specific enhancers. Disruptive coding variants, which form the basis of the burden test, are affecting all these functions without discrimination. Could it be that specific
phenotypes are not associated with a differential burden of disruptive mutations in the coding sequence, but rather in tissue/timing-specific regulatory elements?
Missing heritability
Hundreds of GWAS have been conducted in humans, domestic animals and plants, for a broad range of medically and agriculturally important phenotypes. Risk loci and QTL have been identified for nearly all examined traits amounting to thousands of hits. Yet a systematic finding is that the identified loci typically only account for a small fraction of the heritability of the studied trait. This recurrent observation has raised the issue of the “missing heritability” and what its underlying causes might be (Manolio et al. 2009). The factors contributing to the missing heritability are most likely multiple. We will herein briefly survey the contributing factors that are most commonly invoked.
One possible contributor to the missing heritability that has not received a lot of attention is the possibility that the identified loci explain more of the trait variance than what has been assumed. The variance explained is typically computed by assuming that the lead SNP is the only causative variant in the locus. Recent fine-mapping efforts strongly suggest that – at least in humans and rat– most loci harbor multiple common causative variants (Michael et al. 2013 and unpublished observations), i.e. that allelic heterogeneity is the rule rather than the exception. Accurately computing the variance explained by the locus should account for this complexity and this will nearly certainly increase the variance explained.
The claim of missing heritability, i.e. the fact that the identified risk variants only explain part of the trait heritability, assumes that the heritability is estimated accurately. Trait heritabilities are classically estimated from “epidemiological” data. One may rightfully question the accuracy of this approach. Especially in humans, genetic and environmental resemblance are often confounded. It has even been argued that monozygotic twins might be treated more uniformly than dizygotic twins, hence possibly leading to overestimated heritabilities from twin data. More recently, it has been suggested that heritability estimates could be inflated if epistatic effects were contributing to trait heritability (Zuk et al. 2012). It is worthwhile noting in this regard that Peter Visscher and colleagues recently proposed to use genome-wide genotype data within families to provide unbiased estimates of at least the narrow sense h2 (Visscher et al. 2006). The method is
based on the estimation of the correlation between the phenotypic resemblance between sibs and the estimated fraction of their genomes inherited identical-by-descent. While being very insightful, the approach unfortunately requires a very large number of sibs to yield accurate estimates.
A third possible contributing factor to the missing heritability is the incomplete genome coverage of the utilized SNP panels. This seems less and less likely to be a major contributing factor as SNP panels continue to improve. Yet, it is certain that some part of the genome remain poorly tagged. This is probably the case for variants located within recombination hotspots as well as for variants mapping to segmental duplications. CNV also remain difficult to interrogate and are ignored in most GWAS. Although data suggest that most common CNV are satisfactorily tagged by flanking SNPs (McCarroll et al. 2008), part of the missing heritability might still be hiding in these difficult to interrogate parts of the genome.
One of the most thoroughly scrutinized hypotheses to account for the missing heritability is the potential importance of low frequency and rare causal variants. The SNP panels that have been used predominantly for GWAS until recently primarily include common variants that are by definition (at least if used one at a time) only suitable to tag common causal variants. The need to be able to better study contribution of low frequency rare variants to disease heritability is one of the major drivers of the 1,000 Genomes Project (Nielsen 2010). SNP panels interrogating low frequency coding variants have been designed based on the ensuing information and are presently being used in GWAS with very large case-control cohorts. Genotype imputation is now routinely used to genotype “GWAS-sed” cohorts in silico for low frequency variants detected in the 1,000 Genomes Project. Moreover, a growing number of GWAS are presently being conducted using exome-sequencing, waiting for genome-wide resequencing to become an affordable norm. A growing number of studies have performed targeted resequencing of candidate genes (f.i. positional candidate genes from GWAS; cfr. above) to evaluate the contribution of rare variants. At present, the main message in human genetics appears to be that rare risk variants indeed do exist, that their effects indeed appear to be larger than those of common variants, yet that they only explain a very small fraction of the genetic variance and hence missing heritability (Momozawa et al. 2011; Rivas et al. 2011).
Another hypothesis that is receiving growing attention is the “polygenic” or “quasi-infinitesimal”
hypothesis. According to this view many complex traits, in medicine and agriculture, would be
influenced by a very large number of genetic variants (i.e. thousands to tens of thousands) with individually very small effects. The variance accounted for by most such variants would be too small to have been detected by GWAS so far. There is growing experimental support for this polygenic hypothesis. In human genetics, the first wave of GWAS were typically conducted with of the order of 1,000 cases and 1,000 controls and typically yielded at most a handful for genome-wide significant loci. Merging dataset al.lowed for a second generation of meta-analyses, which typically generated additional loci at a rate that was strongly related to the size of the analyzed cohorts. Power calculations clearly indicated that many loci were still missed (i.e. loci were detected with effects size that had only limited probability to be detected). Merging meta-analyses in even large datasets indeed continued to reveal additional loci. This trend has been very clear for height (Lango Allen et al. 2010; Berndt et al. 2013) and – more recently – for schizophrenia (Ripke et al. 2013). Additional evidence in support of the polygenic hypothesis came from the application of “genomic selection” and related methods to animal data first, and – more recently – human data. As previously mentioned, in domestic animals trait heritabilities are typically estimated using the mixed “individual animal model” (Lynch & Walsh 1998). This linear model includes a random polygenic (additive) effect proper to each animal. The covariance between individual animal effects are assumed to correspond to 2Q
s
A2, whereQ
is the kinship coefficient for the considered pair of individuals ands
A2 the additive genetic variance. Kinship coefficients are classically computed from genealogical records, allowing estimation ofs
A2 and hence the heritability. If the heritability is known, the individual animal effects (corresponding to their breeding values) can be estimated as Best Linear Unbiased Predictors (BLUPs). More recently it has become possible to estimate kinship coefficients of pairs of individuals using genome-wide SNP genotypes obtained using SNP genotyping arrays that are now available for all major domestic animal species. Not surprisingly, estimates ofs
A2 obtained with the corresponding variance structure are very similar to those obtained on the basis of genealogical records, leading some scientists to claim that “There is no missing heritabilityproblem in animal genetics!”. Individual breeding values can be estimated using the
corresponding covariance structure using so-called “GBLUP”. Yang et al. (2010) applied this GBLUP model to human height data and showed that the polygenic effect captured 50% of the phenotypic variance, while QTL mapped by association in the same data set would explain less than 10%. They suggested that a better SNP panel might have allowed them to explain as much as 80% of the phenotypic variance. The same models are increasingly been applied to common complex diseases providing growing support that the polygenic hypothesis may accounts for a substantial fraction of the missing heritability (Cross-Disorder Group of the Psychiatric Genomics Consortium 2013). GBLUP assumes that all segments of the genome account for the same proportion of the genetic variance. It is obvious that this assumption will not be valid in most circumstances. To better account for possible heterogeneity in explained variance, more sophisticated Bayesian models are being developed that assume various prior distributions of QTL effects. Application of these models results - at least for some traits – in capturing a higher proportion of the trait variance and making more accurate predictions of individual “breeding values” (Hayes et al. 2010). It is noteworthy that the same models are increasingly be used to estimate the effects of all genetic variants simultaneously, and hence hopefully improve the distinction between causative and passenger variants. In less than five years, genomic selection has revolutionized animal breeding and has become the method of choice to identify elite breeding stock (Goddard & Hayes 2009). It seems reasonable to speculate that the same methodologies may contribute to the development of novel diagnostic approaches in human medicine (de los Campos et al. 2010).
A commonly proposed source of missing heritability is epistasis. The idea is that the effects of some genetic variants are dependent of the genotype at one or more other variants. Properly modeling such epistatic interactions might explain a higher proportion of the trait variance than by considering the marginal effects only. Recent experiments conducted in experimental crosses of yeast showed that gene-by-gene interactions explained between 0 and 50% of the heritability and that detectable pairwise interactions explained from 0 to 71% of this epistatic variance (Bloom et
al. 2013). So far, the search for gene-by-gene interactions has been less successful in outbred
Another suggested cause of missing heritability are parent-of-origin effects. The mammalian genome is known to harbor 150 genes that are subject to parental imprinting (http://www.geneimprint.com/site/genes-by-species). For these genes, and although being diploid, the organism only uses one allele (in all or some tissues): the padumnal allele for halve of the imprinted genes, the madumnal allele for the other halve. Kong et al. (2009) reanalyzed GWAS data (for three common complex diseases) in the vicinity of known imprinted genes assuming an “imprinting model”. They indeed observed 10 associations with parent-of-origin effects. More sophisticated parent-of-origin effects are known to exist. The best understood is probably the callipyge phenotype, which is only expressed in heterozygous animals inheriting the
CLPG mutation from their sire (+Mat/CLPGPat), a mode of inheritance referred to as “polar overdominance” (Cockett et al. 1996). QTL mapping experiments performed in purpose-generated F3 mouse crosses indicated that polar overdominance and related parent-of-origin effects might be more common than generally recognized, and not limited to genomic regions harboring known imprinted genes (Lawson et al. 2013). It is important to recognize however that “mismodelling” may generate what appears to be imprinting effects but are in fact statistical artifacts. Unaccounted for maternal effects are one such source of pseudo-imprinting (Hager et al. 2008), while the erroneous assumption of fixation of alternate QTL alleles in the parental lines used to generate line-crosses are another. The latter has been the cause of a flurry of erroneous reports of imprinted QTL in livestock (De Koning et al. 2002; Sandor & Georges 2008).
De novo mutations have been shown to underlie a significant proportion of cases of autism and
possibly other complex diseases (Girard et al. 2011; Kong et al. 2012). More recently, searching for highly disruptive de novo mutations in cases has been proposed as a strategy to identify causative genes. However, cases involving de novo mutations are typically sporadic. Even if these would account for a substantial proportion of the disease incidence, it is hard to imagine how such cases would contribute to disease heritability. A disease that would entirely be due to de
novo mutation would have a heritability of zero, unless the mutation process by itself was
heritable.
Finally, is it possible that the missing heritability reveals one or more important yet unsuspected novel molecular mechanisms of inheritance? In C. elegans, RNA-mediated interference (RNAi)