HAL Id: hal-01918447
https://hal.archives-ouvertes.fr/hal-01918447
Submitted on 12 Mar 2020
HAL is a multi-disciplinary open access
archive for the deposit and dissemination of
sci-entific research documents, whether they are
pub-lished or not. The documents may come from
teaching and research institutions in France or
abroad, or from public or private research centers.
L’archive ouverte pluridisciplinaire HAL, est
destinée au dépôt et à la diffusion de documents
scientifiques de niveau recherche, publiés ou non,
émanant des établissements d’enseignement et de
recherche français ou étrangers, des laboratoires
publics ou privés.
Post-Translational Modifications and Diastolic Calcium
Leak Associated to the Novel RyR2-D3638A Mutation
Lead to CPVT in Patient-Specific hiPSC-Derived
Cardiomyocytes
Ivana Acimovic, Marwan Refaat, Adrien Moreau, Anton Salykin, Steve
Reiken, Yvonne Sleiman, Monia Souidi, Jan Přibyl, Andrey Kajava, Sylvain
Richard, et al.
To cite this version:
Ivana Acimovic, Marwan Refaat, Adrien Moreau, Anton Salykin, Steve Reiken, et al..
Post-Translational Modifications and Diastolic Calcium Leak Associated to the Novel RyR2-D3638A
Muta-tion Lead to CPVT in Patient-Specific hiPSC-Derived Cardiomyocytes. Journal of Clinical Medicine
Research, Elmer Press, 2018, 7 (11), pp.423. �10.3390/jcm7110423�. �hal-01918447�
Article
Post-Translational Modifications and Diastolic
Calcium Leak Associated to the Novel RyR2-D3638A
Mutation Lead to CPVT in Patient-Specific
hiPSC-Derived Cardiomyocytes
Ivana Acimovic1 , Marwan M. Refaat2, Adrien Moreau3,4, Anton Salykin1, Steve Reiken5,
Yvonne Sleiman4 , Monia Souidi4, Jan Pˇribyl6 , Andrey V. Kajava7 , Sylvain Richard4 ,
Jonathan T. Lu8, Philippe Chevalier3, Petr Skládal6, Petr Dvoˇrak1, Vladimir Rotrekl1,9 ,
Andrew R. Marks5, Melvin M. Scheinman10, Alain Lacampagne4,* and Albano C. Meli4,*
1 Department of Biology, Faculty of Medicine, Masaryk University, Brno 62500, Czech Republic;
acimovic.ivana@gmail.com (I.A.); a.salykin@gmail.com (A.S.); pdvorak@med.muni.cz (P.D.); vrotrekl@med.muni.cz (V.R.)
2 Department of Internal Medicine, Cardiology Division/Cardiac Electrophysiology Section and Department
of Biochemistry and Molecular Genetics, American University of Beirut Faculty of Medicine and Medical Center, Beirut 1107 2020, Lebanon; rifaatmarwan@hotmail.com
3 NeuroMyoGène Institute, University of Claude Bernard Lyon 1, 69100 Villeurbanne, France;
adrien.moreau@outlook.com (A.M.); philippe.chevalier@chu-lyon.fr (P.C.)
4 PhyMedExp, INSERM, University of Montpellier, CNRS, 371 Avenue du Doyen G. Giraud,
34295 Montpellier CEDEX 5, France; yvonne.sleiman@etu.umontpellier.fr (Y.S.); monia.souidi@etu.umontpellier.fr (M.S.); sylvain.richard@inserm.fr (S.R.)
5 Department of Physiology and Cellular Biophysics, Clyde and Helen Wu Center for Molecular Cardiology,
Columbia University College of Physicians and Surgeons, New York, NY 10032, USA; sr372@columbia.edu (S.R.); arm42@columbia.edu (A.R.M.)
6 CEITEC, Masaryk University, Brno 62500, Czech Republic; pribyl@nanobio.cz (J.P.);
skladal@chemi.muni.cz (P.S.)
7 CRBM, CNRS, University of Montpellier, 34293 Montpellier, France and University ITMO,
St Petersburg 197101, Russia; andrey.kajava@crbm.cnrs.fr
8 Department of Cardiology, College of Physicians and Surgeons of Columbia University, New York,
NY 10032, USA; dr.jon.lu@gmail.com
9 International Clinical Research Center, St. Anne’s University Hospital, Brno 60200, Czech Republic
10 San Francisco Medical Center, University of California, San Francisco, CA 94115, USA;
scheinman@medicine.ucsf.edu
* Correspondence: alain.lacampagne@inserm.fr (A.L.); albano.meli@inserm.fr (A.C.M.);
Tel.: +33-4-67-41-52-28 (A.L. & A.C.M.); Fax: +33-4-67-41-52-42 (A.L. & A.C.M.)
Received: 19 October 2018; Accepted: 4 November 2018; Published: 8 November 2018 !"#!$%&'(!"#$%&'!
Abstract: Background: Sarcoplasmic reticulum Ca2+leak and post-translational modifications under
stress have been implicated in catecholaminergic polymorphic ventricular tachycardia (CPVT), a highly lethal inherited arrhythmogenic disorder. Human induced pluripotent stem cells (hiPSCs) offer a unique opportunity for disease modeling. Objective: The aims were to obtain functional hiPSC-derived cardiomyocytes from a CPVT patient harboring a novel ryanodine receptor (RyR2) mutation and model the syndrome, drug responses and investigate the molecular mechanisms associated to the CPVT syndrome. Methods: Patient-specific cardiomyocytes were generated from a young athletic female diagnosed with CPVT. The contractile, intracellular Ca2+ handling and
electrophysiological properties as well as the RyR2 macromolecular remodeling were studied. Results: Exercise stress electrocardiography revealed polymorphic ventricular tachycardia when treated with metoprolol and marked improvement with flecainide alone. We found abnormal stress-induced contractile and electrophysiological properties associated with sarcoplasmic reticulum Ca2+leak in
CPVT hiPSC-derived cardiomyocytes. We found inadequate response to metoprolol and a potent response of flecainide. Stabilizing RyR2 with a Rycal compound prevents those abnormalities specifically in CPVT hiPSC-derived cardiomyocytes. The RyR2-D3638A mutation is located in the conformational change inducing-central core domain and leads to RyR2 macromolecular remodeling including depletion of PP2A and Calstabin2. Conclusion: We identified a novel RyR2-D3638A mutation causing 3D conformational defects and aberrant biophysical properties associated to RyR2 macromolecular complex post-translational remodeling. The molecular remodeling is for the first time revealed using patient-specific hiPSC-derived cardiomyocytes which may explain the CPVT proband’s resistance. Our study promotes hiPSC-derived cardiomyocytes as a suitable model for disease modeling, testing new therapeutic compounds, personalized medicine and deciphering underlying molecular mechanisms.
Keywords: ryanodine receptor; CPVT; hiPSC-derived cardiomyocytes; calcium; -adrenergic
receptor blockade; flecainide; post-translational modifications
1. Introduction
Catecholaminergic polymorphic ventricular tachycardia (CPVT) is characterized by episodic syncope under stress conditions and is substantially responsible for sudden cardiac death (SCD) during exercise or acute emotions in the absence of structural cardiac abnormalities. CPVT-related mutations have been associated with mutations affecting the cardiac ryanodine receptor (RYR2), calsequestrin (CASQ2), triadin (TRDN) and calmodulin (CALM1 and CALM2) genes [1].
Investigating the basic underlying mechanisms leading to CPVT has faced difficulties and controversies due to limited models. The emergence of human induced pluripotent stem cells (hiPSCs) allows working with patient-specific cells [2,3].
Here, we report a 25-year-old woman with a novel RyR2 mutation and a history of repeated syncopal episodes after exercise. She was diagnosed with a CPVT syndrome with inappropriate response to metoprolol but responsive to flecainide. Performed genetic analysis revealed a novel RyR2-D3638A mutation located in the highly conserved hot-spot region forming the central domain that transduces the conformational changes [4].
We hypothesized that this mutation is linked to CPVT syndrome, which could be modeled in the dish using patient-specific hiPSC-derived cardiomyocytes (CMs). Thus, we reprogrammed the proband’s dermal fibroblasts into hiPSCs and differentiated the CPVT-hiPSC clones into hiPSC-CMs. We found that CPVT hiPSC-CMs have abnormal contraction force and beat rate associated with electrical disturbances and sarcoplasmic reticulum (SR) Ca2+leak. The RyR2-D3638A mutation causes
3D conformational defects and remodeling including PKA hyperphosphorylation and PP2A and Calstabin2 depletions, which could explain the inappropriate response to metoprolol. In agreement with the clinical observations, we showed that treating CPVT hiPSC-CMs with metoprolol does not prevent these abnormalities while flecainide or stabilizing the RyR2 closed state with a Rycal compound do. We propose a new molecular mechanism to explain why some of the CPVT syndromes do not respond well to ß-blockers.
For the first time, using patient-specific hiPSC-CMs, this study made the link between the 3D conformational consequences of a novel CPVT RyR2 single-point mutation and the resulting RyR2 post-translational modifications associated to SR Ca2+ leak, aberrant biophysical properties and
inappropriate drug responses. This work suggests the possibility to model some relevant features of cardiac diseases and screen new drugs on hiPSC-CMs.
2. Methods
2.1. Clinical Evaluation
We obtained a detailed medical history with particular emphasis on syncope, cardiac arrest or symptoms during exertion or emotional stress; medical records, including cardiac evaluation, and a blood sample for genomic DNA extraction. Treadmill stress tests were performed. The diagnosis of CPVT was based on the criteria, which, in short, required stress-induced reproducible ventricular arrhythmias in patients with a normal resting ECG and no detectable structural heart abnormalities. The diagnosis of CPVT was made either on a clinical basis or after identification of a mutation in the RyR2 gene.
2.2. Genetic Studies
Genomic DNA was extracted from whole blood using standard methods. The RyR2 coding regions were amplified using polymerase chain reaction (PCR) and analyzed by denaturing high-performance liquid chromatography.
2.3. Cardiac Differentiation
All subjects gave their informed consent for inclusion before they participated in the study. The study was conducted in accordance with the Declaration of Helsinki, and the protocol (10-02214) was approved by the Ethics Committee of the UCSF Medical Center (San Francisco, CA, USA). Healthy control (HC-) and CPVT-hiPSCs as well as hESCs were differentiated into CMs using both, the 2D (monolayer) protocol and 3D (embryoid body (EB)-based) protocol as previously published [5,6]. A detailed Methods section can be found in the Online Data Supplement.
3. Results
3.1. Clinical Characterization and In Silico Modeling
A 25-year-old athletic woman presented for evaluation in 2005 in the cardiac electrophysiology clinic (UCSF Medical Center, San Francisco, CA, USA) after several episodes of exercise-induced syncope. Episodes occur during strenuous exercise, usually running, but have occurred with bicycling and on a mechanical bull. Typical episodes include a brief prodrome of dizziness without palpitations or chest pain, followed by loss of consciousness and spontaneous recovery in less than one minute. The patient’s first episode occurred at the age of 18 in 1998. From 1998 to 2005, she reported one episode per year, each with strenuous exercise. Her medication list includes oral contraceptive pills. Her parents are alive and well, she has a brother who died suddenly and was attributed to asthma. Four other brothers are in good health. She had a paternal second cousin with aborted SCD after exercise. She has no history of substance abuse. Her physical exam is normal.
Her baseline electrocardiogram (ECG) in 2005 shows sinus bradycardia but is otherwise normal. She had a transthoracic echocardiogram that showed a small patent foramen ovale, minimal shunt with normal systolic and diastolic function. A 24-h ECG Holter showed multifocal premature ventricular contractions (PVCs) with several 3–4 beat runs of non-sustained ventricular tachycardia (NSVT) and an overall PVC burden of <1%. An exercise treadmill test showed a normal QT response to exercise and in recovery, single PVCs and occasional couplets occurred with exercise with multifocal non-short-coupled PVCs (predominantly shape of RBBB, Inferior axis) as shown in Figure1A. A Tilt table test reproduced the patient’s lightheadedness but not her syncope. A vasodepressor response was observed without bradycardia. An electrophysiology study showed no PVCs and no inducible tachyarrhythmia with aggressive extrastimulation on and off of isoproterenol.
J. Clin. Med. 2018, 7, x FOR PEER REVIEW 4 of 22
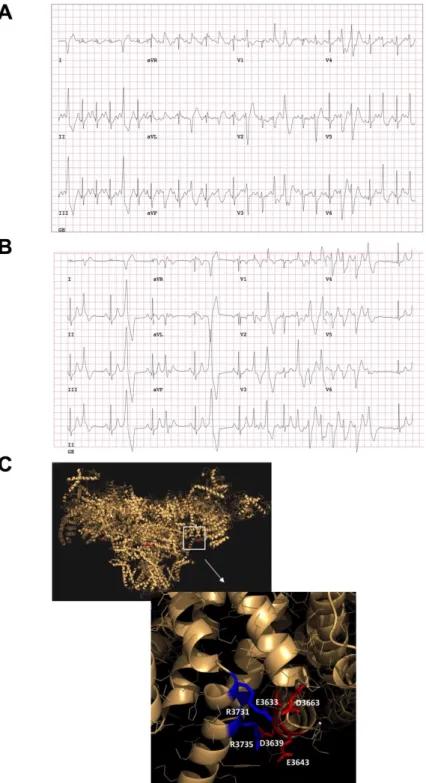
Figure 1. Clinical characterization of the catecholaminergic polymorphic ventricular tachycardia
(CPVT) patient and in silico modeling. (A) An exercise treadmill test showed a normal QT response to exercise and in recovery, singlet premature ventricular contractions (PVCs) and occasional couplets occurred with exercise with multifocal non-short-coupled PVCs (predominantly RBBB, inferior axis). (B) An exercise treadmill test when the proband was treated with metoprolol (METO) (predominantly RBBB, Inferior axis). (C) RyR2-D3638A mutation location (red dot, D3639A on the pig amino-acid sequence) on the pig 3D ryanodine receptor (RyR2) resolved structure [4] using MacPyMOL (version 1.7.4.5) and the available PDB file 5goa.cif. This mutation is located in the RyR2 central core domain. In silico modeling analysis revealed that the RyR2-D3638A mutation is located on the surface of a contact between two alpha-helices, via positively charged side chain clusters (K3698, R3731 and R3735) on one side and negatively charged side chains (E3633, E3638, D3639, D3663) on the other side.
Figure 1. Clinical characterization of the catecholaminergic polymorphic ventricular tachycardia (CPVT) patient and in silico modeling. (A) An exercise treadmill test showed a normal QT response to exercise and in recovery, singlet premature ventricular contractions (PVCs) and occasional couplets occurred with exercise with multifocal non-short-coupled PVCs (predominantly RBBB, inferior axis). (B) An exercise treadmill test when the proband was treated with metoprolol (METO) (predominantly RBBB, Inferior axis). (C) RyR2-D3638A mutation location (red dot, D3639A on the pig amino-acid
sequence) on the pig 3D ryanodine receptor (RyR2) resolved structure [4] using MacPyMOL (version
1.7.4.5) and the available PDB file 5goa.cif. This mutation is located in the RyR2 central core domain. In silico modeling analysis revealed that the RyR2-D3638A mutation is located on the surface of a contact between two alpha-helices, via positively charged side chain clusters (K3698, R3731 and R3735) on one side and negatively charged side chains (E3633, E3638, D3639, D3663) on the other side.
The -blocker metoprolol (50 mg tablet orally twice daily) was initiated for empiric suppression of PVCs and lifestyle changes were recommended to mitigate vasodepressor response. The patient declined any additional diagnostic testing at that time and described significant baseline fatigue and impairment of exercise tolerance on the -blocker. A treadmill revealed polymorphic, bidirectional NSVT during recovery from exercise, reflecting an inadequate response and resistance to metoprolol therapy for CPVT (Figure1B). The heart rates both, at rest and with peak exercise, were reduced proving an effect of the -blocker, which excluded pharmacokinetic factors. However, due to the onset of ventricular arrhythmias, the test was terminated and the maximal heart rate with -blocker was not achieved. Metoprolol was eventually discontinued by the patient. She continued to do strenuous physical exercise. In 2009, the patient’s brother with “asthma” was found dead. Postmortem showed no structural disease. Other siblings of Irish descent underwent cardiac testing. By report, one sibling had a baseline ECG with “possible Brugada pattern” but procainamide challenge was negative. No other abnormalities were identified in first-degree family members. The patient had several additional episodes of syncope from 2009 to 2011 when she presented to the cardiac electrophysiology clinic. She was started on flecainide (100 mg tablet orally twice daily) and her arrhythmias were controlled (Figure S1A). She failed the exercise portion of the pre-implantation QRS-T morphology screening of subcutaneous cardioverter-defibrillator and then decided she did not want to have a cardioverter-defibrillator implanted. She subsequently resumed vigorous exercise and completed an Ironman Triathlon with swimming, biking, and running (2015) without any symptoms on flecainide. Her ECG showed normal sinus rhythm and normal QTc in light of a family history of SCD, exercise-induced symptoms, multifocal PVCs and borderline QTc. Genetic testing was carried out for LQTS and CPVT. KCNQ1, KCNH2, SCN5A, ANK2, KCNE1, KCNE2, KCNJ2, CACNA1C, CAV3, and SCN4B were negative for mutations associated with LQTS. All genes checked (including the CPVT2-related gene CASQ2) were normal beside a novel heterozygous point mutation of the RYR2-c.10913A>C (based on RYR2 reference sequence NM_001035.2) (Figure S1B). This mutation results in an aspartic acid to alanine substitution at the 3638th position (p.Asp3638Ala or D3638A) of the RyR2 protein. Protein sequence alignment revealed that the aspartic acid is conserved among human, mouse, rat, pig and dog, suggesting its importance in the RyR2 structure/function relationship (Figure S2). The recent 3D structure of RyR2 confirms the importance of D3638A located in the central domain, which likely senses the open and closed conformational changes [4]. The RyR2-D3638A mutation is within a hot-spot region associated with cardiac disorders [7]. We performed in-silico analysis and modeling, based on the recent RyR2 3D structure [4], and found that this single-point mutation is located on the surface that is rich in negatively charged residues and in front of the other surface that is rich in positively charged residues (Figure1C). The interactions between these charged clusters likely allow the surfaces to be together. At the same time, if small rearrangement of the central domain happens during binding of agonists, it allows these two clusters to still be associated. In fact, by removing Asp3638 (i.e., Asp3639 in pig), the interactions between the charged clusters become weaker which may eventually affect the RyR2 central domain to sense and/or transduce the conformational changes.
3.2. Reprogramming of Patient’s Skin Fibroblasts and Characterization of CPVT-hiPSCs
Three CPVT-hiPSC clones (C1.1, C2.2, and C2.5) were successfully generated from patient’s fibroblasts out of 12 clones initially selected, and two of them (C1.1 and C2.2) were used for cardiac differentiation. A hiPSC line (hFiPS1.4) from a healthy subject (age and gender matched) was used as control [8] as well as another control CCTL12 human embryonic stem cell (hESC) line [6]. CPVT-hiPSC clones exhibited undifferentiated phenotype and morphology (Figure S3A), shown by alkaline phosphatase activity (Figure S3B), and expression of pluripotency markers (Figure S3C). Sequencing analysis showed that heterozygous RYR2-c.10913A>C (p.D3638A) mutation was conserved (Figure S3D). Karyotype analysis of the CPVT hiPSC line revealed normal chromosomal structure (Figure S3E). Expression of gene markers of all three germ layers in the embryoid bodies (EBs)
of independent one-month-old control (hFiPS1.4 and CCTL12) and CPVT lines confirmed their pluripotency (Figure S3F).
3.3. CPVT hiPSC Differentiate into Functional Cardiomyocytes
HC and CPVT-hiPSC lines were differentiated in CMs as previously published [5,6]. Immunocytochemical staining of 30-day-old CMs after enzymatic dissociation confirmed that both HC and CPVT hiPSC-CMs demonstrated a cardiac phenotype through striated pattern expression of sarcomeric markers, the cardiac troponin T (cTnT) and cardiac ↵-actinin. When exposed to isoproterenol, HC and CPVT hiPSC-CMs exhibit the PKA-phosphorylated form of the structural cTnI protein (p-cTnI) (Figure S4A). Contracting EB gene expression analysis by semiquantitative RT-PCR revealed the expression of key cardiac markers such as RYR2, myosin light chain 2 (MYL2), myosin light chain 7 (MYL7), alpha-cardiac actin (ACTC1), and connexin 43 (GJA1) (Figure S4B). There was no difference in cardiac gene expression between HC and CPVT EBs shown by qRT-PCR (Figure S4C).
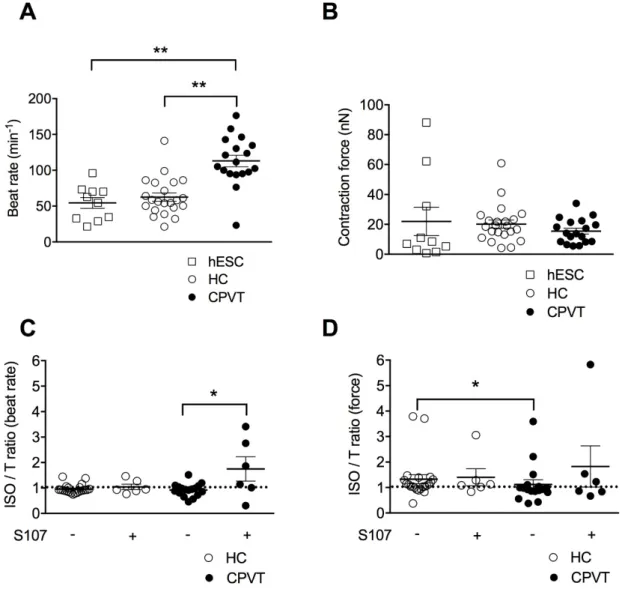
3.4. CPVT-EBs Present Higher Spontaneous Beats and Weaker Contraction Force Response Under Stress Sinus bradycardia and abnormal cardiac contraction have previously been reported in CPVT patients [9]. Others and we recently developed a method based on atomic force microscopy (AFM) to quantify the contractile properties of beating EBs at rest and under stress conditions [6,10–12]. Thus, we aimed here at characterizing the consequence of the RyR2-D3638A CPVT mutation on the rate and contraction force of homogenous clusters of contracting hiPSC-CMs working as a human 3D cardiac syncytium in vitro [13]. In resting physiological conditions at 37 C and in absence of sympathetic nervous system, CPVT-EBs harboring RyR2-D3638A mutation exhibited a higher beat rate than the HC-EBs (180% increase, Figure2A). To reinforce the comparison, we used a second group of control EBs differentiated from a hESC line [6,10]. We observed a similar beat rate for the two control EB groups (hESC- and HC-EBs). Both of them had a lower beat rate than the CPVT-EBs (Figure2A). When looking at the contraction force, no significant difference was observed between hESC-, HC- and CPVT-EBs (Figure2B).
CPVT syndrome is related to physical or emotional stress involving the activation of the adrenergic signaling pathway. To mimic the stress conditions, we used isoproterenol (ISO), a non-selective -adrenergic receptor agonist known for its positive inotropic and chronotropic effect. We measured the contraction force and beat rate as a ratio following ISO application over basal condition and observed a slight negative chronotropic effect in the HC- and CPVT-EBs with no significant difference between the 2 groups (Figure2C). However, while ISO had a positive inotropic effect in HC-EBs (ratio of 1.33±0.17, n = 22), it caused a weaker inotropic effect in CPVT-EBs (ratio of 1.12±0.18, n = 17, p < 0.05) (Figure2D), suggesting that CPVT-EBs have a weaker and/or abnormal response to ISO in force contraction. Importantly, we obtained similar results using the hESC-EBs as a second control (Figure S5A,B).
3.5. Stabilizing the Closed State of RyR2 Using S107 Improves the Contractile Properties in CPVT-EBs We next aimed at testing a rycal compound (S107) [14] on the EBs in similar experimental conditions. The rycals are known to stabilize the closed the state of RyR2 and prevent SR Ca2+leak
in animal models of CPVT, ischemia/reperfusion and heart failure [15–17]. S107 induced a strong significant positive chronotropic effect on CPVT-EBs when compared to untreated CPVT-EBs while no effect on HC-EBs (Figure2C). We observed no difference in the contraction force (ISO/T ratio of 1.12±0.18, n = 17 for CPVT-EBs vs. 1.83 + 0.81, n = 6 for S107-treated CPVT-EBs) (Figure2D). S107-treated HC-EBs had similar beat rate compared to untreated HC-EBs (Figure2C). S107 treatment did not modify the positive inotropic effect of ISO on HC-EBs (Figure2D).
Figure 2. Contractile properties of CPVT human induced pluripotent stem cell-derived embryoid bodies (hiPSC-EBs). (A) Scatter plots showing beat rates for control human embryonic stem cell hESC-EBs (hESC), healthy control-hESC-EBs (HC) and CPVT-hESC-EBs (C2.2, CPVT) at rest. (B) Contraction force for hESC-, HC- and CPVT-EBs at rest. (C) Ratio of beat rates under 1 μM ISO to beat rates at rest for HC and CPVT ± (indicated by the + or − symbols) 5 μM S107 (overnight). (D) Ratio of contraction forces under 1 μM isoproterenol (ISO) to contraction forces at rest for HC and CPVT ± (indicated by the + or − symbols) 5 μM S107 (overnight). The dotted line indicates the ratio threshold. The number of experiments varies from 6 to 22 for each scatter plot. Data are presented with mean ± SEM. * p < 0.05; ** p < 0.01.
3.6. The CPVT Mutation D3638A Leads to Abnormal Intracellular Ca2+ Release under Stress
CPVT-related RyR2 mutations are known to alter the cardiac intracellular Ca2+ handling and the
excitation-contraction coupling (ECC) in ventricular and atrial CMs [18]. To further investigate the underlying mechanisms linked with the novel CPVT RyR2-D3638A mutation, we measured the intracellular Ca2+ handling properties at the excitation-contraction coupling level in Fluo-4 loaded
hiPSC-CMs using confocal laser scanning microscopy.
We first characterized the Ca2+ handling properties at rest in HC and CPVT hiPSC-CMs. Several
parameters were studied including the maximal amount of Ca2+ release during a whole Ca2+-transient
(i.e., maximal Ca2+-transient amplitude), the maximal slope of increasing fluorescence intensity with
time (dF/dtmax), which indicates the rate of RyR2 Ca2+ release and the Ca2+ amount mobilized upon
the transients (i.e., area under the curve or peak area). Aberrant events as systolic double-humped
Figure 2. Contractile properties of CPVT human induced pluripotent stem cell-derived embryoid bodies (hiPSC-EBs). (A) Scatter plots showing beat rates for control human embryonic stem cell hESC-EBs (hESC), healthy control-EBs (HC) and CPVT-EBs (C2.2, CPVT) at rest. (B) Contraction force for hESC-, HC- and CPVT-EBs at rest. (C) Ratio of beat rates under 1 µM ISO to beat rates
at rest for HC and CPVT±(indicated by the + or symbols) 5 µM S107 (overnight). (D) Ratio of
contraction forces under 1 µM isoproterenol (ISO) to contraction forces at rest for HC and CPVT±
(indicated by the + or symbols) 5 µM S107 (overnight). The dotted line indicates the ratio threshold.
The number of experiments varies from 6 to 22 for each scatter plot. Data are presented with mean±
SEM. * p < 0.05; ** p < 0.01.
3.6. The CPVT Mutation D3638A Leads to Abnormal Intracellular Ca2+Release under Stress
CPVT-related RyR2 mutations are known to alter the cardiac intracellular Ca2+handling and
the excitation-contraction coupling (ECC) in ventricular and atrial CMs [18]. To further investigate the underlying mechanisms linked with the novel CPVT RyR2-D3638A mutation, we measured the intracellular Ca2+handling properties at the excitation-contraction coupling level in Fluo-4 loaded
hiPSC-CMs using confocal laser scanning microscopy.
We first characterized the Ca2+ handling properties at rest in HC and CPVT hiPSC-CMs.
Several parameters were studied including the maximal amount of Ca2+release during a whole
Ca2+-transient (i.e., maximal Ca2+-transient amplitude), the maximal slope of increasing fluorescence
intensity with time (dF/dtmax), which indicates the rate of RyR2 Ca2+release and the Ca2+amount
double-humped Ca2+-transients (called “aberrant Ca2+-transients”) and additional diastolic events of
low amplitude between the transients (called “diastolic SR leaky events”) were also evaluated. In basal conditions, HC hiPSC-CMs and CPVT hiPSC-CMs showed similar spontaneous release of Ca2+ with no difference in the Ca2+-transient maximal amplitude (Figure S6A,B). We observed
no particular difference in the occurrence of systolic Ca2+-transients and diastolic SR leaky events
(Figure S6C,D) and no difference in the rate of RyR2 Ca2+release or in the peak area between HC and
CPVT hiPSC-CMs (Figure S6E,F). These results indicate no difference in the major properties reflecting the Ca2+release from the RyR2 channels and might rule out the role of RyR2 in the higher beat rate observed in CPVT-EBs at rest (Figure2A).
We next explored the effect of stress by combining ISO and pacing. We found that CPVT hiPSC-CMs exhibit significant lower maximal Ca2+-transient amplitude (Figure3A,B). Significant increases in the
frequency of aberrant Ca2+-transients during systole and diastolic SR leaky events were observed in
CPVT hiPSC-CMs when compared to HC hiPSC-CMs (Figure3C,D). These results suggested that stress triggers more irregular Ca2+-release events in CPVT hiPSC-CMs. Especially, the diastolic SR leaky events
are reminiscent of the sub-conductance states of RyR2 mutated channels we previously observed [19]. When looking at the kinetic properties of RyR2 Ca2+release, CPVT hiPSC-CMs exhibit a lower rate
of Ca2+release through RyR2 (Figure3E) and mobilized less Ca2+than the HC hiPSC-CMs (i.e., peak
area, Figure3F) in agreement with the decreased maximal Ca2+-transient amplitude (Figure3A,B).
These irregularities under stress in CPVT hiPSC-CMs may consequently impair the ECC and the contraction force as observed in CPVT-EBs (Figure2D). No significant difference in the fractional Ca2+
release or in the time to peak under caffeine (10 mM) between CPVT and HC hiPSC-CMs (Figure S7A–C). 3.7. S107 Prevents the SR Ca2+Leak in CPVT hiPSC-CMs and Does Not Affect HC hiPSC-CMs
We next tested whether S107 could also prevent the systolic and diastolic aberrant Ca2+events
under stress. CPVT hiPSC-CMs treated with S107 exhibited less systolic and diastolic aberrant Ca2+events than untreated cells, suggesting a stabilizing effect of S107 on RyR2-D3638A channels,
a more stable intracellular Ca2+release and a better diastolic phase when the RyR2 channels should
be tightly closed (Figure3A,C,D). S107 was able to increase the maximal Ca2+-transient amplitude
(Figure 3A,B) and the peak area in CPVT hiPSC-CMs (Figure3F). It did not change the rate of Ca2+release through RyR2 (Figure3E). None of those properties were modified in S107-treated HC
hiPSC-CMs (Figure3A–F).
3.8. Unlike Flecainide, Metoprolol Does Not Prevent the Abnormal Ca2+Release in CPVT hiPSC-CMs
The clinical observations revealed that the proband had no improvement under metoprolol (METO, selective 1-adrenergic receptor blocker) beside a reduced heart rate. However, she had no symptom under flecainide treatment alone. We thus aimed at testing whether the inadequate response to METO and potent effect of flecainide could be recapitulated using CPVT hiPSC-CMs by focusing on the intracellular Ca2+handling properties under stress conditions. We found that none of the studied
properties were modified under METO (Figure S8A–F). CPVT METO-treated hiPSC-CMs exhibited aberrant Ca2+-transients and diastolic SR Ca2+leak with no difference when compared to non-treated
cells (Figure S8A–D). We checked whether CPVT-EBs express similar level of 1- and 2-adrenergic
receptors and found no significant difference compared to HC-EBs (Figure S7D).
Unlike METO, flecainide prior ISO significantly increased the maximal amplitude of the Ca2+-transients, rate of Ca2+ release as well as peak area (Figure4). It significantly reduced the
frequency of aberrant Ca2+-transients, which overall led to more regular Ca2+-transients although no
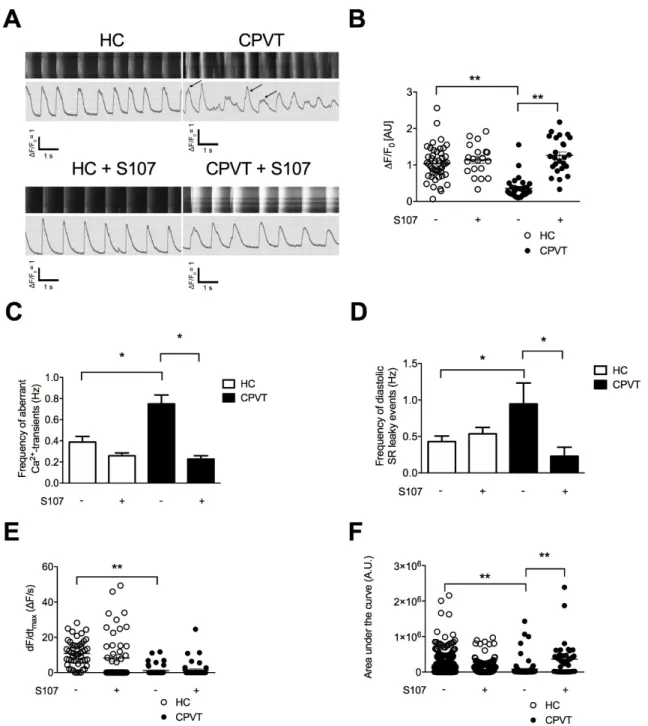
Figure 3. Intracellular Ca2+ cycling and SR Ca2+ stores in CPVT hiPSC-CMs under stress. (A) Display
of original line-scan images of Ca2+ transients and corresponding tracings of HC and CPVT C2.2
hiPSC-CMs treated with 1 μM ISO together with pacing at 1 Hz (20 V, 0.5 ms duration and 1 ms delay)
± 5 μM S107. Additional and aberrant Ca2+ release events are shown with the arrows. (B) Scatter plots
showing maximal Ca2+-transient amplitude in HC (white dots) and CPVT (black dots) hiPSC-CMs
under stress conditions ± (indicated by the + or − symbols) treated with 5 μM S107. (C,D) Bar graphs
showing frequency of occurrence of aberrant Ca2+-transients (C) and diastolic SR leaky events (D) in
HC and CPVT hiPSC-CMs under stress conditions ± (indicated by the + or − symbols) treated with 5
μM S107. (E,F) Rate of RyR2 Ca2+ release (dF/dtmax) and area under the curve (peak area) in HC and
CPVT hiPSC-CMs under stress conditions ± (indicated by the + or − symbols) treated with 5 μM S107. The number of experiments varies from 20 to 46 for each scatter plot. Data are presented with mean ± SEM. * p < 0.05; ** p < 0.01.
Figure 3. Intracellular Ca2+cycling and SR Ca2+stores in CPVT hiPSC-CMs under stress. (A) Display
of original line-scan images of Ca2+transients and corresponding tracings of HC and CPVT C2.2
hiPSC-CMs treated with 1 µM ISO together with pacing at 1 Hz (20 V, 0.5 ms duration and 1 ms delay)
±5 µM S107. Additional and aberrant Ca2+release events are shown with the arrows. (B) Scatter plots
showing maximal Ca2+-transient amplitude in HC (white dots) and CPVT (black dots) hiPSC-CMs
under stress conditions±(indicated by the + or symbols) treated with 5 µM S107. (C,D) Bar graphs
showing frequency of occurrence of aberrant Ca2+-transients (C) and diastolic SR leaky events (D) in
HC and CPVT hiPSC-CMs under stress conditions±(indicated by the + or symbols) treated with
5 µM S107. (E,F) Rate of RyR2 Ca2+release (dF/dtmax) and area under the curve (peak area) in HC
and CPVT hiPSC-CMs under stress conditions±(indicated by the + or symbols) treated with 5 µM
S107. The number of experiments varies from 20 to 46 for each scatter plot. Data are presented with mean±SEM. * p < 0.05; ** p < 0.01.
J. Clin. Med. 2018, 7, x FOR PEER REVIEW 10 of 22
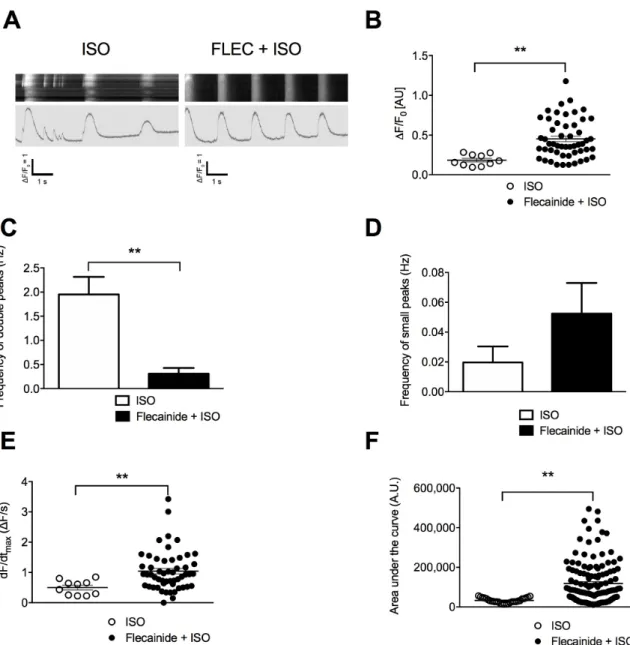
Figure 4. Flecainide (FLEC) partially prevents the aberrant SR Ca2+ handling in CPVT hiPSC-CMs. (A)
Display of original line-scan images of Ca2+ transients and corresponding tracings of CPVT (C1.1)
hiPSC-CMs after application of ±5 μM flecainide followed by 1 μM ISO. (B) Scatter plots showing
maximal Ca2+-transient amplitude in CPVT hiPSC-CMs under ISO (white dots) and flecainide + ISO
(black dots). (C) Bar graphs showing frequency of occurrence of aberrant Ca2+-transients in CPVT
hiPSC-CMs under ISO and flecainide + ISO. (D) Frequency of occurrence of diastolic SR leaky events
in CPVT hiPSC-CMs under ISO and flecainide + ISO. (E) Rate of RyR2 Ca2+ release (dF/dtmax) in CPVT
CMs under ISO and flecainide + ISO. (F) Area under the curve or peak area in CPVT hiPSC-CMs under ISO and flecainide + ISO. The number of experiments varies from 10 to 55 for each scatter plot. Data are presented with mean ± SEM. ** p < 0.01.
3.9. Electrical Activity Is Affected in CPVT RyR2-D3638A Patient Cells
To get better insight in the electrical activity of HC and CPVT hiPSC-CMs, the patch-clamp technique (current-clamp) was used to study action potentials (AP) parameters. Both spontaneous and elicited AP were studied in the whole-cell configuration. To eliminate nodal-like CMs, cells with an AP duration at 90% of repolarization (APD90) shorter than 100 ms were discarded and not analyzed
(16% and 27% of cells for HC and CPVT respectively) (Figure S9). As expected, recorded AP mainly demonstrated a typical ventricular-like shape. Indeed, when elicited at 1 Hz, APD90 were longer than
280 ms and the mean APD90/APD50 ratio was 1.8 and 1.6 (with a 95% CI of the mean of 1.5 and 2.1/1.5
Figure 4. Flecainide (FLEC) partially prevents the aberrant SR Ca2+handling in CPVT hiPSC-CMs.
(A) Display of original line-scan images of Ca2+transients and corresponding tracings of CPVT (C1.1)
hiPSC-CMs after application of±5 µM flecainide followed by 1 µM ISO. (B) Scatter plots showing
maximal Ca2+-transient amplitude in CPVT hiPSC-CMs under ISO (white dots) and flecainide + ISO
(black dots). (C) Bar graphs showing frequency of occurrence of aberrant Ca2+-transients in CPVT
hiPSC-CMs under ISO and flecainide + ISO. (D) Frequency of occurrence of diastolic SR leaky events in
CPVT hiPSC-CMs under ISO and flecainide + ISO. (E) Rate of RyR2 Ca2+release (dF/dtmax) in CPVT
hiPSC-CMs under ISO and flecainide + ISO. (F) Area under the curve or peak area in CPVT hiPSC-CMs under ISO and flecainide + ISO. The number of experiments varies from 10 to 55 for each scatter plot.
Data are presented with mean±SEM. ** p < 0.01.
3.9. Electrical Activity Is Affected in CPVT RyR2-D3638A Patient Cells
To get better insight in the electrical activity of HC and CPVT hiPSC-CMs, the patch-clamp technique (current-clamp) was used to study action potentials (AP) parameters. Both spontaneous and elicited AP were studied in the whole-cell configuration. To eliminate nodal-like CMs, cells with an AP duration at 90% of repolarization (APD90) shorter than 100 ms were discarded and not analyzed
(16% and 27% of cells for HC and CPVT respectively) (Figure S9). As expected, recorded AP mainly demonstrated a typical ventricular-like shape. Indeed, when elicited at 1 Hz, APD90were longer than
and 1.9 for HC and CPVT respectively), indicating the typical plateau phase of ventricular like AP (Figure S9).
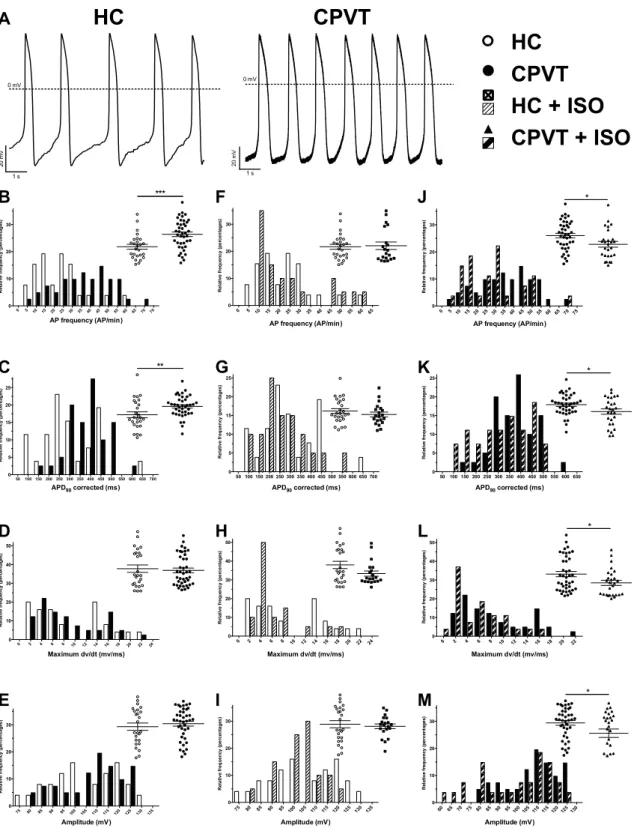
At rest, spontaneous AP from CPVT hiPSC-CMs demonstrated several differences when compared with HC hiPSC-CMs (Figure5, Tables S1 and S2). Indeed, the spontaneous AP frequency is significantly increased in CPVT cells, in accordance with observations made in AFM experiments (Figure 5, Table S1). As the frequency differs, the APD90was corrected accordingly using the bazett’s formula
(APD90/square root (1/APfrequency)). As demonstrated by the large right shift of black bars in
Figure5C, the corrected APD90 was increased in CPVT hiPSC-CMs (418 ±29 ms, n = 26) when
compared to HC hiPSC-CMs (287±20 ms, n = 26, p < 0.01). In contrast, the depolarization speed, illustrated through the measure of the maximum dV/dt, and AP amplitude were similar in CPVT and HC hiPSC-CMs (Figure5, Table S1). Of note, the dV/dtmaxin spontaneous AP appears low in both HC
and CPVT (Table S1). This can be explained by the depolarized maximum diastolic potential (MDP) of 66.4±1.4 and 65.6±1.1 mV for HC and CPVT respectively most probably resulting in a voltage gated sodium channels inactivation. hiPSC-CM were then paced at a fixed frequency. To robustly compare AP parameters from HC and CPVT, the MDP was artificially lowered at 80 mV and AP were elicited at 1 Hz. Except for the AP amplitude, AP parameters were confirmed through the 1 Hz pacing of HC and CPVT hiPSC-CMs (Figures S10 and S11, Table S2). In these conditions, the dV/dtmax
increased when compared to spontaneous activity. Such increased most probably rely on a recovered fraction of voltage gated sodium channels due to the constrained MDP.
To further mimic the consequences of exercise described as an arrhythmic trigger by the patient, HC and CPVT hiPSC-CMs were stimulated at 2 Hz (Figure S12, Table S2). APD20,50 and 90
were significantly longer while the maximum dV/dt, the amplitude and the overshoot did not show any differences when compared to HC hiPSC-CMs (Figure S12, Table S2). The effect of changes in stimulation frequency were further evaluated and expressed as percentages of variation. This comparison revealed larger variations between HC and CPVT cells when cells were stimulated at 2 Hz (when compared to variations when cells were stimulated at 1Hz) (Figure S13, Table S3). A likely explanation can be found when comparing variations between 1 and 2 Hz for each hiPSC-CMs line (Figure S13, Table S3). Indeed, variations for CPVT are less pronounced than variations for HC hiPSC-CMs. Taken together, this would indicate more severe electrical phenotype with increased AP frequency.
1 µM of isoproterenol was used to assess the effect of ß-adrenergic stimulation on the electrical membrane activity (Figure5). None of the parameters were significantly modified in HC hiPSC-CMs, while all values were decreased in CPVT-ISO condition (AP frequency, APD90 corrected, maximum dV/dt and AP amplitude) (Figure5).
3.10. Abnormal Electrical Activity Elicited with ISO Is Rescued with Flecainide and S107
Besides the AP parameters, the abnormal electrical events were also studied (Figure6). Such events are determined as early or delayed after-depolarizations as depicted Figure6A. Without treatments, the number of CPVT cells with aberrant events is slightly decreased when compared with HC hiPSC-CMs, however, their frequency is increased by 38% (events per second of recording) (Figure6D–F). While the addition of ISO has low effect on HC electrical aberrant events, all measured parameters are drastically increased in CPVT hiPSC-CMs (Figure6D–F). Indeed, when compared to non-treated HC hiPSC-CMs, CPVT cells demonstrated 86% increase in traces with aberrant electrical activity, a 278% and a 160% respective increase in the number of abnormal events per recording and in their frequency (Figure6D–F).
Figure 5. Action potential parameters from spontaneous electrical activity. (A) Example of spontaneous action potentials (AP) from HC (left) and CPVT (right) hiPSC-CM recorded using the patch-clamp technique on isolated cardiomyocytes. (B–M) AP characteristics are studied and were compared between: HC (n = 26) and CPVT (n = 41) (B–E), HC (n = 26) and HC + ISO (n = 20) (F–I) and CPVT (n = 41) and CPVT + ISO (n = 29) (J–M). For each comparison, the frequency distribution is shown with a scatter plot (with mean ± SEM) in inset to provide an accurate view of population distribution. The parameters studied were the spontaneous AP frequencies (B,F,J), the bazett’s
corrected APD90 (C,G,K), the maximum depolarization speed (maximum dV/dt) (D,H,L) and the AP
amplitude (E,I,M). * p < 0.05; ** p < 0.01, *** p < 0.001. 0 mV 1 s 20 m V
HC
1 s 0 mV 20 m VCPVT
50 100 150 200 250 300 350 400 450 500 550 600 650 700 0 5 10 15 20 25 APD90 corrected (ms) R e la ti v e fr eq u e n cy ( p e rc en ta g e s) 0 2 4 6 8 10 12 14 16 18 20 22 24 0 10 20 30 40 50 Maximum dv/dt (mv/ms) R e la ti ve f re q u e n c y (p e rc e n ta g es ) 0 510 15 20 25 30 35 40 45 50 55 60 65 70 75 0 10 20 30 AP frequency (AP/min) R el a ti ve f re q u en c y (p er c en ta g es ) *** 50100 150 200 250 300 350 400 450 500 550 600 650 700 0 5 10 15 20 25 APD90 corrected (ms) R e la ti ve f re q u en c y (p er ce n ta g es ) ** 50 100 150 200 250 300 350 400 450 500 550 600 650 0 5 10 15 20 25 APD90 corrected (ms) R el at iv e fr e q u en c y (p er c en ta g e s) * * 0 2 4 6 8 10 12 14 16 18 20 22 0 10 20 30 40 50 Maximum dv/dt (mv/ms) R el a ti v e fr eq u e n cy ( p e rc en ta g es ) 0 5 10 15 20 25 30 35 40 45 50 55 60 65 70 75 0 10 20 30 AP frequency (AP/min) R e la ti ve f re q u e n c y (p er c en ta g e s) 75 80 85 90 95100 105 110115120125130135 0 10 20 30 Amplitude (mV) R el a ti v e fr eq u e n cy ( p e rc en ta g es ) 60 65 7075 80 8590 95 100105110115120125130 0 10 20 30 Amplitude (mV) R el a ti v e fr eq u en cy ( p e rc en ta g e s) * 0 2 4 6 8 10 12 14 16 18 20 22 24 0 10 20 30 40 50 Maximum dv/dt (mv/ms) R el at iv e f re q u en cy ( p e rc en ta g es ) 75 80 85 90 95 100 105 110 115 120 125 130 135 0 10 20 30 Amplitude (mV) R el a ti v e fr eq u en cy ( p e rc e n ta g es ) 0 5 10 15 20 25 30 35 40 45 50 55 60 65 0 10 20 30 AP frequency (AP/min) R el at iv e f re q u en c y (p e rc en ta g es )HC
CPVT
HC + ISO
CPVT + ISO
*A
B
C
D
E
F
G
H
I
J
K
L
M
Figure 5. Action potential parameters from spontaneous electrical activity. (A) Example of spontaneous action potentials (AP) from HC (left) and CPVT (right) hiPSC-CM recorded using the patch-clamp technique on isolated cardiomyocytes. (B–M) AP characteristics are studied and were compared between: HC (n = 26) and CPVT (n = 41) (B–E), HC (n = 26) and HC + ISO (n = 20) (F–I) and CPVT (n = 41) and CPVT + ISO (n = 29) (J–M). For each comparison, the frequency distribution is shown
with a scatter plot (with mean±SEM) in inset to provide an accurate view of population distribution.
The parameters studied were the spontaneous AP frequencies (B,F,J), the bazett’s corrected APD90
(C,G,K), the maximum depolarization speed (maximum dV/dt) (D,H,L) and the AP amplitude (E,I,M). * p < 0.05; ** p < 0.01, *** p < 0.001.
Figure 6. Abnormal electrical activity is elicited by ISO and normalized with flecainide and S107 treatments. (A–C) Examples of current clamp raw traces showing APs recorded from CPVT hiPSC-CM after treatment with ISO (1 μM) (A), flecainide (5 μM) + ISO (B) and S017 + ISO (5 μM) (C). (D–F) HC and CPVT abnormal electrical activity is studied with and without ISO (HC: n = 26, HC + ISO: n = 20, CPVT: n = 41, CPVT + ISO: n = 29). Percentages of variations are indicated in comparison with HC. (G–I) The effect of flecainide (n = 12) and S107 (n = 16) pre-treatment (indicated by the + in contrast to -) on CPVT hiPSC-CM is also studied. Abnormal electrical activity is evaluated through the measure of the number of trace with aberrant events (D,G), the measure of abnormal event in each recording showing at least 1 abnormal event (E,H) and their frequency in Hz (F,I). * p < 0.05.
20 30 40 50 60 tr ac e s w it h a rr h y th m ic e v en ts ( % ) + 8 % - 9 % + 86 % 0 2 4 6 8 A b n o rm al e ve n t p er r ec o rd in g + 50 % + 17 % + 278 % 0.000 0.025 0.050 0.075 0.100 A b n o rm al e v en t p er s e co n d + 23 % + 38 % + 160 % * 20 30 40 50 60 tr a ce s w it h a rr h yt h m ic e v en ts ( % ) Flecainide S107 -+ + + 105 % - 10 % - 33 % 0 2 4 6 8 A b n o rm al e ve n t p er r ec o rd in g + 227 % + 29 % + 29 % Flecainide S107 -+ + 0.000 0.025 0.050 0.075 0.100 A b n o rm al e ve n t p er s e co n d Flecainide S107 -+ + + 90 % - 11 % + 21 % CPVT + ISO HC + ISO HC CPVT ISO A CPVT ISO + Flecainide B ISO + S107 C G H I D E F
Figure 6. Abnormal electrical activity is elicited by ISO and normalized with flecainide and S107 treatments. (A–C) Examples of current clamp raw traces showing APs recorded from CPVT hiPSC-CM after treatment with ISO (1 µM) (A), flecainide (5 µM) + ISO (B) and S017 + ISO (5 µM) (C). (D–F) HC and CPVT abnormal electrical activity is studied with and without ISO (HC: n = 26, HC + ISO: n = 20, CPVT: n = 41, CPVT + ISO: n = 29). Percentages of variations are indicated in comparison with HC. (G–I) The effect of flecainide (n = 12) and S107 (n = 16) pre-treatment (indicated by the + in contrast to -) on CPVT hiPSC-CM is also studied. Abnormal electrical activity is evaluated through the measure of the number of trace with aberrant events (D,G), the measure of abnormal event in each recording showing at least 1 abnormal event (E,H) and their frequency in Hz (F,I). * p < 0.05.
J. Clin. Med. 2018, 7, 423 14 of 22
Patient treatment was mimicked with addition of 5 µM flecainide before ISO challenging (Figure6G–I). This addition normalized the number of traces with abnormal events, their frequency and drastically reduced the number of abnormal events per recording (Figure6G–I). The addition of flecainide even normalized the spontaneous AP frequency (in Hz): 0.39±0.04 (n = 26, HC), 0.61±0.04 (n = 41, CPVT), 0.44±0.05 (n = 29, CPVT-ISO) and 0.36±0.06 (n = 12, CPVT flecainide-ISO).
To confirm the benefit of reducing the diastolic Ca2+leak, CPVT hiPSC-CMs were also subjected to
S107 treatment before ISO challenging (Figure6G–I). The addition of S107 clearly improved abnormal electrical activity reducing the number of traces with aberrant events, their number per recording and their frequency (Figure6G–I) when compared with ISO condition.
3.11. Post-Translational Modifications Are Associated with the CPVT RyR2-D3638A Channels
SR Ca2+leak through RyR2 has been associated with post-translational modifications of the RyR2
macromolecular complex including PKA-phosphorylation and Calstabin2 depletion [20]. We explored the RyR2 macromolecular complex by co-immunoprecipitation in HC and CPVT cell lysates under resting and stress conditions. We evaluated the amount of Calstabin2 bound to RyR2 and the level of RyR2 PKA phosphorylation at its specific site S2809 and incubated with flecainide (FLEC), metoprolol (METO) and S107. We also explored some of the key proteins responsible for reversing the phosphorylation modifications such as type 2 protein phosphatase (PP2A) and spinophilin (PP1 anchoring protein).
At rest, we found no PKA phosphorylation and similar Calstabin2 level associated to RyR2 in HC and CPVT hiPSC-CMs. Under stress conditions, CPVT hiPSC-CMs were significantly more depleted in Calstabin2 (416% less) from the RyR2 macromolecular complex than HC hiPSC-CMs with similar level of RyR2 PKA-phosphorylated at its Ser2809 (Figure7A,B,E). Surprisingly, we found significantly less PP2A in CPVT (2.72±0.32, n = 6) compared to HC (4.25±0.16, n = 5; p < 0.05) and similar spinophilin bound to the RyR2 macromolecular complex in resting conditions (Figure7A,C,D).
We next tested whether the effects of flecainide, METO and S107 under stress were associated with RyR2 post-translational modifications in CPVT cells. Interestingly, flecainide treatment did not prevent the PKA phosphorylation at Ser2809 and Calstabin2 depletion while METO reduced both (517% decrease for pS2809), likely by selectively blocking the ß1-adrenergic receptors. S107 treatment prevented Calstabin2 depletion from the RyR2 macromolecular complex in CPVT hiPSC-CMs (Figure7A,C,E). There was no particular difference in the amount of spinophilin and PP2A bound to CPVT RyR2 under stress (Figure7A,C,D).
Patient treatment was mimicked with addition of 5 μM flecainide before ISO challenging (Figure 6G–I). This addition normalized the number of traces with abnormal events, their frequency and drastically reduced the number of abnormal events per recording (Figure 6G–I). The addition of flecainide even normalized the spontaneous AP frequency (in Hz): 0.39 ± 0.04 (n = 26, HC), 0.61 ± 0.04 (n = 41, CPVT), 0.44 ± 0.05 (n = 29, CPVT-ISO) and 0.36 ± 0.06 (n = 12, CPVT flecainide-ISO).
To confirm the benefit of reducing the diastolic Ca2+ leak, CPVT hiPSC-CMs were also subjected
to S107 treatment before ISO challenging (Figure 6G–I). The addition of S107 clearly improved abnormal electrical activity reducing the number of traces with aberrant events, their number per recording and their frequency (Figure 6G–I) when compared with ISO condition.
3.11. Post-Translational Modifications Are Associated with the CPVT RyR2-D3638A Channels
SR Ca2+ leak through RyR2 has been associated with post-translational modifications of the RyR2
macromolecular complex including PKA-phosphorylation and Calstabin2 depletion [20]. We explored the RyR2 macromolecular complex by co-immunoprecipitation in HC and CPVT cell lysates under resting and stress conditions. We evaluated the amount of Calstabin2 bound to RyR2 and the level of RyR2 PKA phosphorylation at its specific site S2809 and incubated with flecainide (FLEC), metoprolol (METO) and S107. We also explored some of the key proteins responsible for reversing the phosphorylation modifications such as type 2 protein phosphatase (PP2A) and spinophilin (PP1 anchoring protein).
At rest, we found no PKA phosphorylation and similar Calstabin2 level associated to RyR2 in HC and CPVT hiPSC-CMs. Under stress conditions, CPVT hiPSC-CMs were significantly more depleted in Calstabin2 (416% less) from the RyR2 macromolecular complex than HC hiPSC-CMs with similar level of RyR2 PKA-phosphorylated at its Ser2809 (Figure 7A,B,E). Surprisingly, we found significantly less PP2A in CPVT (2.72 ± 0.32, n = 6) compared to HC (4.25 ± 0.16, n = 5; p < 0.05) and similar spinophilin bound to the RyR2 macromolecular complex in resting conditions (Figure 7A,C,D).
We next tested whether the effects of flecainide, METO and S107 under stress were associated with RyR2 post-translational modifications in CPVT cells. Interestingly, flecainide treatment did not prevent the PKA phosphorylation at Ser2809 and Calstabin2 depletion while METO reduced both (517% decrease for pS2809), likely by selectively blocking the ß1-adrenergic receptors. S107 treatment prevented Calstabin2 depletion from the RyR2 macromolecular complex in CPVT hiPSC-CMs (Figure 7A,C,E). There was no particular difference in the amount of spinophilin and PP2A bound to CPVT RyR2 under stress (Figure 7A,C,D).
Figure 7. PKA-phosphorylated CPVT RyR2-D3638A mutant channels are depleted in Calstabin2 which is prevented by S107 but not by flecainide. (A) Representative immunoblot bands of HC and CPVT lysates (c2.2) at rest and under stress (1 μM ISO application) for total RyR2, PKA-phosphorylated RyR2 at S2809 site, spinophilin, PP2A and Calstabin2. In stress conditions, CPVT cells were also either pretreated with 5 μM flecainide (FLEC.), or 5 μM metoprolol (METO) or 5 μM S107 (B–E) Bar graphs showing data normalization from immunoblots for the relative RyR2 PKA phosphorylation, spinophilin, PP2A and Calstabin2 bound to RyR2 in HC and CPVT at rest and under stress and in presence of flecainide, METO and S107. For each condition, n = 3 to 8 independent experiments. * p < 0.05; ** p < 0.01.
4. Discussion
Despite several studies modeling CPVT and testing drugs in the dish [13,21–24], there is no clear understanding of the molecular mechanisms underlying this syndrome in human. In fact, several mechanisms have been suggested using animal models and recombinant strategies and none of them really proven in human. Previously, we demonstrated that RyR2 single-point mutations linked with CPVT exhibit cytosolic Ca2+ hypersensitivity and diastolic leak associated with Calstabin2 depletion
under stress [19]. The present study markedly extends these earlier studies by showing that in patient-specific CMs, the CPVT RyR2-D3638A mutation causes a macromolecular complex remodeling including depletion of Calstabin2 under stress, indicating that such RyR2 post-translational modifications are a mechanism in human CMs, which we believe to be novel to explain stress-induced ventricular arrhythmias and pharmacological responses observed clinically including inappropriate response to standard β-adrenergic receptor blockade.
We generated patient-specific hiPSC-CMs from a proband harboring a novel single point mutation RyR2-D3638A located in a highly conserved central domain and associated with CPVT syndrome under stress conditions. Consistently with the clinical observations, we found that the
Figure 7. PKA-phosphorylated CPVT RyR2-D3638A mutant channels are depleted in Calstabin2 which is prevented by S107 but not by flecainide. (A) Representative immunoblot bands of HC and CPVT lysates (c2.2) at rest and under stress (1 µM ISO application) for total RyR2, PKA-phosphorylated RyR2 at S2809 site, spinophilin, PP2A and Calstabin2. In stress conditions, CPVT cells were also either pretreated with 5 µM flecainide (FLEC.), or 5 µM metoprolol (METO) or 5 µM S107 (B–E) Bar graphs showing data normalization from immunoblots for the relative RyR2 PKA phosphorylation, spinophilin, PP2A and Calstabin2 bound to RyR2 in HC and CPVT at rest and under stress and in presence of flecainide, METO and S107. For each condition, n = 3 to 8 independent experiments. * p < 0.05; ** p < 0.01.
4. Discussion
Despite several studies modeling CPVT and testing drugs in the dish [13,21–24], there is no clear understanding of the molecular mechanisms underlying this syndrome in human. In fact, several mechanisms have been suggested using animal models and recombinant strategies and none of them really proven in human. Previously, we demonstrated that RyR2 single-point mutations linked with CPVT exhibit cytosolic Ca2+hypersensitivity and diastolic leak associated with Calstabin2
depletion under stress [19]. The present study markedly extends these earlier studies by showing that in patient-specific CMs, the CPVT RyR2-D3638A mutation causes a macromolecular complex remodeling including depletion of Calstabin2 under stress, indicating that such RyR2 post-translational modifications are a mechanism in human CMs, which we believe to be novel to explain stress-induced ventricular arrhythmias and pharmacological responses observed clinically including inappropriate response to standard -adrenergic receptor blockade.
We generated patient-specific hiPSC-CMs from a proband harboring a novel single point mutation RyR2-D3638A located in a highly conserved central domain and associated with CPVT syndrome
under stress conditions. Consistently with the clinical observations, we found that the contractile, electrical and SR Ca2+handling properties were abnormal under stress. These aberrations were not
prevented by the standard -adrenergic receptor blockade (Metoprolol) while the flecainide and S107 prevented them. Most important, and among the several CPVT disease modeling studied, we found a novel RyR2 macromolecular complex remodeling for the first time using hiPSC-CMs which could explain the pharmacological responses observed clinically.
4.1. Insights from the Structure-Function Aspects
The RyR2-D3638A mutation is within a hot-spot region associated with cardiac disorders [7]. The highly-conserved Asp residue mutated in this study may be of high importance in the RyR2 structure/function relationship. Based on the recently resolved RyR1 structure [25] a salt bridge between D3671 and R3769 may exist in RyR1. The negatively charged RyR2-D3638 may for a salt bridge with the positive R3730 (RyR2 equivalent of RyR1 R3769). Similar functional defects would be expected due to the R3730 mutation. The recent 3D structure of RyR2 by cryo-EM highlights the central domain in which the D3638 is included. The central domain is constituted of U-motifs involved in rearrangements driving the closed and open states of RyR2 [4]. The in-silico analysis and modeling revealed that this single-point mutation is located on the rich surface of negatively charged residues facing a surface rich in positively charged residues. These potential interactions might be altered by the D3638A mutation causing weaker charge clusters which may eventually affect the RyR2 central domain to sense and/or transduce the conformational changes.
Therefore, the D3638A mutation could impair the conformational changes upon agonists such as Ca2+. In this context, the diastolic SR Ca2+leak observed in CPVT hiPSC-CMs could be explained by
an unstable closed state of the RyR2-D3638A mutant that is normally tightly regulated by low diastolic Ca2+. The RyR2-D3638A mutation does not appear to affect the RyR2 leucine/isoleucine zipper motifs
(LZ motifs) for the anchoring proteins AKAP, spinophilin and PR130 which allow the interactions with PKA, PP1 and PP2A, respectively [26]. Indeed, they are rather located in the cytoplasmic peripheral structures SPRY, P1 and P2 domains.
4.2. Modeling of CPVT Syndrome Using hiPSC-CMs in the Dish
Our previous studies showed no difference in the cardiac faith for several human pluripotent stem cell lines upon the differentiation protocol we developed [6,10]. Based on the patch-clamp experiments, we worked with a population mostly composed of ventricular-like hiPSC-CMs. Using an AFM-based method we developed [6,10], we here revealed aberrant beat rate and contraction force in CPVT 3D beating clusters during resting and stress conditions, respectively. At rest, CPVT-EBs exhibited increased beat rate in correlation with increased frequency for spontaneous depolarization observed in CPVT hiPSC-CMs although the intracellular SR Ca2+handling properties were similar
to those in HC hiPSC-CMs. One experimental limit is that the AFM-based experiments were performed at 37 C while the patch-clamp and Ca2+imaging were done at room temperature (~22 C).
Therefore, the interpretation of these results should be taken with caution. It should be noted that CPVT cells exhibited depleted PP2A from the RyR2 channels which overall may cause an aberrant ECC independent of an obvious leaky RyR2 at rest in CPVT cells.
In agreement with the clinical observations, our results indicated that the RyR2-D3638A mutation in CPVT hiPSC-CMs leads to an abnormal Ca2+release under stress conditions by decreasing the
Ca2+transient amplitude and increasing the occurrence of both, the systolic and diastolic aberrant
Ca2+ events. These features suggested that the RyR2-D3638A mutation triggers systolic aberrant
Ca2+-transients and a diastolic SR Ca2+leak which eventually impairs the contraction force in the
CPVT-EBs. Interestingly, the diastolic SR Ca2+leak we observed in CPVT hiPSC-CMs are reminiscent
of the leaky sub-conductance states of CPVT RyR2 channels previously observed by our group [19], although we did not measure their amplitude. Our results ruled out a lower SR Ca2+content in CPVT
Although the CPVT syndrome is clinically revealed by ventricular arrhythmias, studies revealed that nodal [28] and atrial CMs [15] are also affected by CPVT mutations leading to intracellular Ca2+handling abnormalities and contributing to sinoatrial node dysfunction and atrial fibrillation.
The patch-clamp experiments revealed clear alteration in both spontaneous and paced electrical activity. At rest, the non-altered dV/dt suggested a normal cellular depolarization step and normal tissue conduction while the AP lengthening constitutes a favorable substrate for arrhythmias. Increasing the stimulation frequency at 2 Hz worsen AP parameters defect, consistently with the observed increased in arrhythmic events in the patient during exercise. Similarly, adding ISO to mimic stress condition notably decreased both depolarization speed and AP amplitude further amplifying arrhythmogenic potential. Interestingly, strong consistency can be observed comparing electrical and contractile CPVT functions. Our present study brings new evidences that heterogeneous populations of patient-specific CPVT hiPSC-CMs commonly exhibit stress-induced abnormal intracellular Ca2+
handling and contractile properties.
4.3. The Inadequate B-Blocker Response and Potent Effects of S107 and Flecainide
The clinical results revealed that VTs during exercise are not prevented by metoprolol treatment in the proband harboring the RyR2-D3638A mutation. However, the heart rate both at rest and with peak exercise were reduced. This observation excluded an ultra-rapid metabolizing status notably by the liver enzyme CYP2D6 [29] and proved the metoprolol effect. We evaluated the effect of metoprolol on the Ca2+-release through RyR2 in the CPVT hiPSC-CMs and observed
that the leaky phenotype through RyR2 was not prevented properly. We showed that metoprolol partially reduced the RyR2 PKA phosphorylation and Calstabin2 depletion. Interestingly, metoprolol treatment caused a (non-significant) trend to reduced SR diastolic leaky events while flecainide did not. Therefore, reducing Calstabin2 depletion through reduced RyR2-PKA phosphorylation leads to reduced leaky events in CPVT hiPSC-CMs. While these evidences are, for the first time, observed in human CMs, they are in agreement with our previous study showing that Calstabin2 depletion through PKA phosphorylation, a consequence of the ß-adrenergic stimulation, is associated to leaky RyR2 channels under stress in agreement with the clinical observation of CPVT syndrome [19]. These results also correlated with our previous work showing that mice with constitutive RyR2 PKA-phosphorylation (S2808D+/+mice) result in diastolic leak and cardiac
dysfunction. Moreover, we showed that reversing RyR2 PKA phosphorylation is an important mechanism of the ß-blockers to prevent cardiac dysfunction [20]. However, although metoprolol may not be the optimal -blocker for CPVT, it is the first time here that its inadequate response is shown using patient-specific hiPSC-CMs correlating with the clinical observations. Our results not only confirmed that hiPSC-CMs can recapitulate patient-specific drug responses as recently shown [24] but they go beyond by suggesting a novel molecular mechanism of ß1-blocker resistance in CPVT
in human. At a concentration known to be efficient in CMs [22], we showed that flecainide partially restored the regular intracellular Ca2+-release properties in CPVT hiPSC-CMs in stress conditions
but did not prevent the diastolic SR Ca2+leak. Flecainide also normalized aberrant event recorded
using the patch-clamp technique. The spontaneously increased AP frequency is also corrected under flecainide treatment. Here we revealed for the first time in human CMs, that flecainide does not prevent the pathological Calstabin2 depletion in CPVT cells which is known to be associated to leaky RyR2 channels [15–17,19,20,30–35]. Does flecainide directly act on RyR2 channel? The molecular mechanisms underlying the potency of flecainide is unclear [36–38] and the present results suggest another target than RyR2.
Furthermore, we observed a potent effect of S107 on CPVT hiPSC-CMs by stabilizing the contraction force and the beat rate as well as by preventing SR Ca2+leak under stress conditions. A very
recent study also showed a potent effect of S107 in CPVT hiPSC-CMs harboring the RyR2-I4587V mutation [23]. Here, we found for the first time in hiPSC-CMs, that the S107 beneficial effect relies on stabilizing the closed state of RyR2 likely via its stabilizing Calstabin2 partner as previously shown