R
ISK ASSESSMENT OF SOIL COMPACTION IN
W
ALLOON
REGION
(B
ELGIUM
)
Dimitri D’Or1& Marie-France Destain2
1Ephesia Consult, 10 chemin de Drize, CH-1256 Troinex, Switzerland.
2Universit´e de Li`ege, Gembloux Agro-Bio Tech, D´epartement des Sciences et Technologies de
l’Environnement, Passage des D´eport´es, 2 B-5030 Gembloux, Belgium.
Abstract. It is well established that soil compaction affects the growth and functioning of roots and disrupts the activity of microfauna and soil microorganisms, resulting in a loss of yields. Agriculture and forestry using increasingly heavy machines, the risk of soil compaction is increasing accordingly. Chosen as indicator of the susceptibility of soils to compaction, the precompression stress (Pc) is calculated using the pedotransfer functions (PTFs) proposed by Horn & Fleige (2003). These PTFs involve eight parameters linked to the hydraulic and me-chanical behaviour of soils: organic matter content, bulk density, air capacity, available and non-plant available water capacity, saturated hydraulic conductivity, cohesion and angle of in-ternal friction. The challenge consists in producing Pc maps at the regional scale for Wallonia. Those maps should also be accompanied by estimation uncertainty map. Finally, the results should be exploited to produce compaction risk maps according to various frequent scenarios. In this paper, a methodology is proposed, combining geostatistics and Monte Carlo simulations, to achieve these goals.
Keywords. Soil compaction, pedotransfer function, uncertainty assessment, risk map.
1
Introduction
As a matter of fact, agriculture and forestry machines have dramatically increased their size and weight during the last 20 years. This does not remain without consequences for the soils: there is increasing evidence of soil compaction at large scale. Soil compaction is proven to have effects on crop production (Hakansson & Reeder, 1994; Hamza & Anderson, 2005; Greacen & Sands, 1980; Goutal, 2012), soil structure (Soane & van Ouwerkerk, 1995; Batey & McKenzie, 2006; Frey et al., 2009; Lipiec et al., 2012), and soil hydraulic properties (Jones et al., 2003).
Considering the importance of these negative effects, the EU Commission listed soil com-paction as a major threat in the Soil Framework Directive (COM, 2006). In Wallonia, the public authorities have decided to quantify and spatialize the phenomenon in order to produce adequate recommendations for soil quality conservation.
In order to avoid costly sampling campaigns and to produce the results in the shortest pos-sible timelapse, the study was required to rely exclusively on existing data sets. The challenge thus consisted in combining data with heterogeneous spatial abundance and to take into account and propagate in the model the corresponding uncertainties.
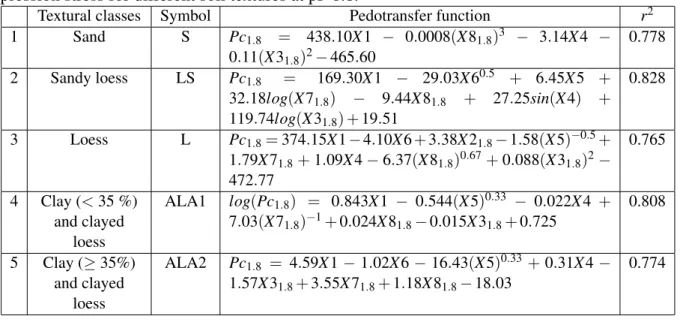
Table 1: Pedotransfer functions established by Horn & Fleige (2003) to compute the precom-pression stress for different soil textures at pF 1.8.
Textural classes Symbol Pedotransfer function r2
1 Sand S Pc1.8 = 438.10X 1 − 0.0008(X 81.8)3 − 3.14X4 − 0.11(X 31.8)2− 465.60 0.778 2 Sandy loess LS Pc1.8 = 169.30X 1 − 29.03X 60.5 + 6.45X 5 + 32.18log(X 71.8) − 9.44X 81.8 + 27.25sin(X 4) + 119.74log(X 31.8) + 19.51 0.828 3 Loess L Pc1.8= 374.15X 1 − 4.10X 6 + 3.38X 21.8− 1.58(X5)−0.5+ 1.79X 71.8+ 1.09X 4 − 6.37(X 81.8)0.67+ 0.088(X 31.8)2− 472.77 0.765 4 Clay (< 35 %) and clayed loess ALA1 log(Pc1.8) = 0.843X 1 − 0.544(X 5)0.33 − 0.022X4 + 7.03(X 71.8)−1+ 0.024X 81.8− 0.015X31.8+ 0.725 0.808 5 Clay (≥ 35%) and clayed loess ALA2 Pc1.8 = 4.59X 1 − 1.02X 6 − 16.43(X 5)0.33 + 0.31X 4 − 1.57X 31.8+ 3.55X 71.8+ 1.18X 81.8− 18.03 0.774
2
Method
2.1
General framework
The vulnerability of soils to compaction is usually expressed as the risk to exceed a certain level of stress called the precompression stress (Pc). Being a measure of pressure, Pc is expressed in kPa. Horn & Fleige (2003) proposed pedotransfer functions (PTFs) to evaluate Pc at 40 cm depth. They defined multiple regression equations for 5 different textural groups based on the German soil texture classification (Table 1).
As Pc also depends on the moisture content of the soils, Horn & Fleige (2003) computed the PTFs for two water potentials: pF 1.8 (h = -63 cm or -6.2 kPa) and 2.5 (h = -316 cm or -31 kPa). For the sake of conciseness, we focus here only on the results for pF 1.8.
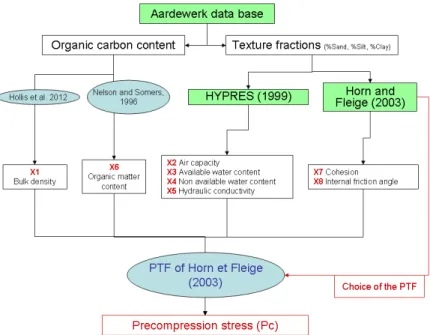
In those PTFs, eight parameters linked to the hydraulic and mechanical behaviour of soils are involved: organic matter content (X6), bulk density (X1), air capacity (X2), available (X3) and non-plant available (X4) water capacity, saturated hydraulic conductivity (X5), cohesion (X7) and internal friction angle (X8). Figure 1 depicts the way those variables are computed from the data bases.
2.2
Data sources
Figure 1: Model organigram. In green, the databases; in blue, the references for the equations. Variables with number X1 to X8 are the input variables for the PTFs of Horn & Fleige (2003).
content and the texture fractions (% sand, silt and clay) for more than 5000 soil profiles spread all over the Walloon Region. those data were used to compute the bulk density (X1) through the PTF of Hollis et al. (2012), the organic matter content through the PTF of Nelson & Sommers (1996) and the texture classes involved in the selection of the values for the hydraulic and mechanical parameters, as well as in the choice of the PTF of Horn & Fleige (2003).
• The HYPRES data base (W¨osten, 2000) yields values for the hydraulic parameters X2 to X6 for 5 FAO soil classes.
• The table of Horn & Fleige (2003, table 2, p. 91) gives the appropriate values for the cohesion (X7) and internal friction angle (X8) according to the German soil classification. • Landuse classes required by the PTF of Hollis et al. (2012) used for computing the bulk
density are avalaible in the Walloon landuse map (COSW, 2013).
• The soil texture class map is a layer extracted from the Digital soil map of Wallonia (CNSW, 2013).
2.3
Generation of the Pc maps
As one goal of this study is to produce exhaustive maps of Pc at the regional scale, two strategies may be implemented. In the first one, the PTF of Horn & Fleige (2003) are applied at each data location and Pc is then interpolated over a regular grid covering the Walloon Region. As an alternative, the input variables may be interpolated first and the PTFs then computed at every grid node. As advised by Heuvelink & Pebesma (1999), the second strategy will be favoured since it allows to better take advantage of the spatial structure of the variables.
The resolution of the regular grid set up for drawing the maps is 100 m in both the North-South and East-West directions.
As it is required not only to draw a map of the average Pc values but also quantify the unertainty on this estimation and compute exceedance risk maps, geostatistical and Monte Carlo simulation methods have been used.
2.3.1 Simulation of the bulk density and organic matter content
For bulk density (X1) and organic matter content (X6), before applying the PTF of Hollis et al. (2012) and Nelson & Sommers (1996), respectively, maps of the organic carbon content (OCC) were simulated by sequential gaussian simulations (SGS, Goovaerts, 1997) conditioned to the Aardewerk data. Local mean of the raw Occ values was first removed using a moving window average method, with a 10 km circular window. Residuals were then transformed in order to obtain a Gaussian distribution using a normal score transform (Goovaerts, 1997). The exper-imental variogram was computed on the transformed residuals and fitted with a model with a nugget effect equal to 0.65 and an exponential structure with a sill of 0.38 and a range of 3050 m. One hundred maps of OCC residuals were simulated by SGS. Simulated values were then backtransformed and the regional trend added to obtain the final OCC simulated values.
2.3.2 Simulation of the hydraulic parameters
For the hydraulic parameters (X2-X4), mean values and variances are available for 5 FAO soil classes in the HYPRES data base (W¨osten, 2000), thus defining Gaussian distributions. A Monte Carlo simulation process is set up with the following steps:
1. A random number p is drawn in a uniform distribution.
2. For each FAO soil class, the p-quantile on the Gaussian distribution with corresponding mean and variance is computed to obtain the water contents (i) at saturation θsat (pF=0),
(ii) at field capacity θcap (pF=1.8), and (iii) at permanent wilting point θwp(pF=4.2).
3. If necessary, a correction is applied to respect the minimum and maximum values spec-ified in the HYPRES data base by resetting the values out of the bounds to the nearest bound.
4. Variables X2 to X4 are then computed by
θavail = 100 × (θcap− θwp) (1)
θnotavail = 100 × θwp (2)
cair = 100 × (θsat− θcap) (3)
5. The values computed at step 4 are assigned to all the grid nodes sharing the same soil class.
6. Steps 1 to 5 are repeated 100 times, generating 100 maps for the hydraulic parameters. A similar procedure is applied for simulating the saturated hydraulic conductivity (X5). The empirical distributions contained in the HYPRES data base for this variable are used to draw the values at step 2. The resulting values are in cm/day units and must be transformed using
Ks0= 1000 × Ks
3600 × 24 (4)
in order to match the units in 0.001 cm/sec. required by Horn & Fleige (2003). 2.3.3 Simulation of the mechanical parameters
Minimum and maximum values for parameters X7 and X8 are given in Horn & Fleige (2003, table 2, p. 91). For each of the 100 realizations, the same procedure as explained at Section 2.3.2 was used. At step 2, as no additional information about the distribution of the values was available, a uniform distribution having the given minimum and maximum as bounds was considered.
2.4
Additional problems
As can be seen from the above explanations, soil texture fractions and soil texture classes are important parameters at each step of the process. On one hand, to apply the PTF of Hollis et al. (2012) to compute bulk density, the texture fractions are needed. On the other hand, texture classes are required to choose the adequate PTF of Horn & Fleige (2003) and the right distribu-tions for the hydraulic and mechanical parameters. This section details how those parameters are obtained.
2.4.1 Texture fractions
Texture fractions, i.e. sand, silt and clay percentages, are simulated independently using the same approach as the one described at Section 2.3.1 using the texture fraction measures avail-able in the Aardewerk data base. The variogram models all have a nugget effect of resp. 0.56, 0.66 and 0.68, and an exponential structure with a range of 5000 m and a sill equal to 0.36,
0.32 and 0.32 resp. for sand, silt and clay. In order to respect to sum to 100% constraint, the simulated values for the three fraction are renormalized at each grid node. This type of variable submitted to a constant sum constraint are called compositional data (Aitchison, 1986, 1997). In the literature, various methods are proposed to simulated them geostatistically (e.g., Pawlowsky et al., 1995; Walvoort & De Gruijter, 2001). However, D’Or (2001; 2003) has shown that no significant different could be revealed between specific methods for compositional data and independent SGS.
2.4.2 Texture map
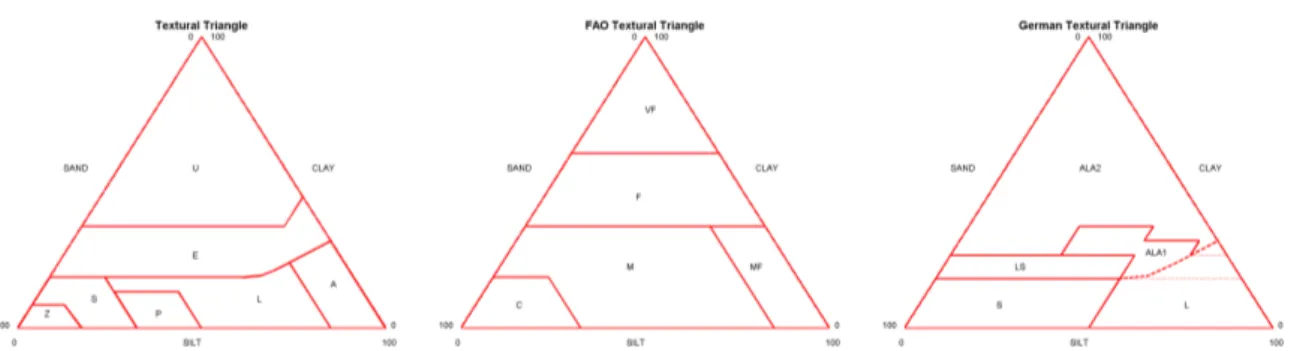
As seen above, various texture classifications have to be used: the FAO one to assign the right hydraulic parameter values, the German one to assign the right mechanical parameter values and choose adequately the PTF of Horn & Fleige (2003), and the Belgian one as main data source.
There is thus a need to be able to convert the Belgian soil classes into FAO and German ones. This is done by superposing the different texture triangles as shown in Figure 2. To better match the boundaries observed on the soil profiles, the boundary between classes L and ALA1/ALA2 on the German triangle was modified to match the boundary between classes A/L and E on the Belgian triangle.
An additional problem is brought by the fact that the Belgian texture classification uses a G symbol for stony silty soils with more than 5% of stones, that is not represented on the texture triangle. As almost 45% of the Walloon soils are classified in this class, a solution must be found to convert it into a class appearing on the texture triangle. It thus has been decided to classify the simulated texture fractions (see Section 2.4.1) according to the Belgian texture triangle in the corresponding regions. Elsewhere, the texture class read on the digital soil map of Wallonia is retained.
The conversion between the three classifications is made according to the conversion rules exposed in Table 2. When more than one FAO or German class is corresponding to a given Belgian class, the texture fractions simulated at Section 2.4.1 are used to determine the most frequent class among the 100 realizations in the target classification. Resulting texture map are shown at Figure 3. Note that it was chosen to ignore the uncertainty on the soil texture classes at this stage. Hence, unique texture maps are used all along the process. This point could be improved in future developments of the methodology.
3
Results
The main goal of the study was to determine the susceptibility of soils to compaction. This can be assessed through the Pc maps (Section 3.1). For the public authority, it is then usefull to delineate areas where the compaction risk is high according to various scenarios in order to promote soil-friendly farming and forest practices. This is explained in Section 3.2.
Figure 2: Belgian (left), FAO (middle) and modified German (right) texture triangles. On this last triangle, the dotted lines of the original classification have been replaced by the dashed line to match the Belgian classification border between classes A/L and E.
Table 2: Conversion table between the three texture classifications.
Belgian FAO German
U F or VF ALA2 E M or MF LS, ALA1 or ALA2 L M S, L or ALA1 A MF L P M S S C S Z C S
3.1
Pc maps and uncertainty quantification
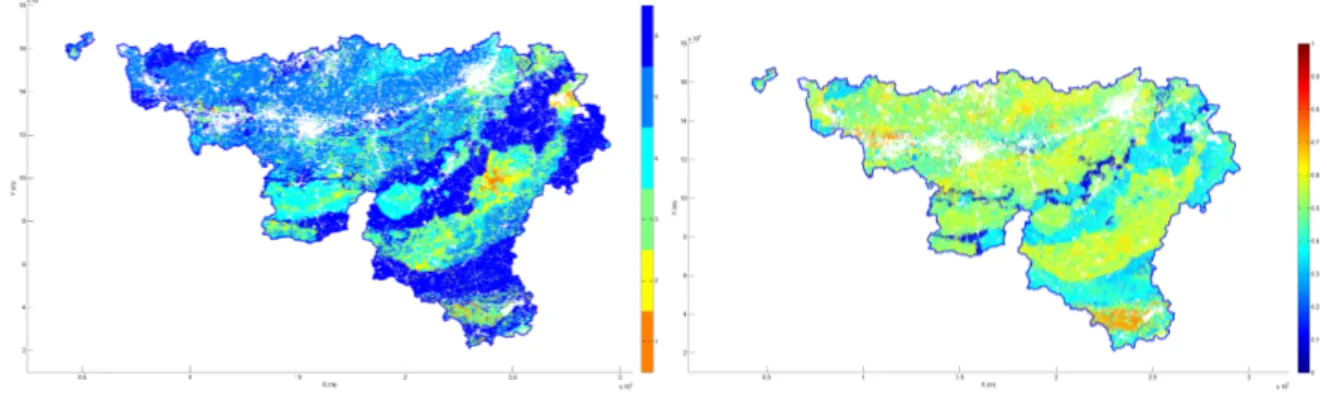
According to Horn & Fleige (2003), Pc values are classified into 6 classes (0-30, 30-60, 60-90, 90-120, 120-150, >150 kPa) on each realization. A map of the modal Pc class at each grid node at pF 1.8 is computed from the 100 realizations of the simulation process (Figure 4, left). Lower the Pc class, higher the susceptibility of the soil to compaction. This map reflects also very well the underlying soil texture classification and the organic matter content with higher susceptibility for silty soils (Belgian texture classes L and A), especially when the organic matter content is high.
Along with this map, a map of the corresponding estimation uncertainty is computed. The classification error probability (CEP) has been chosen as uncertainty measure (Figure 4, right) and is computed as CEP = 1 − Pm, where Pmis the probability of the modal class, computed as
Figure 3: Belgian (left), FAO (middle) and modified German (right) texture maps.
Figure 4: Map of the modal Pc class at pF 1.8 (left) and of the corresponding uncertainty (right).
3.2
Risk maps
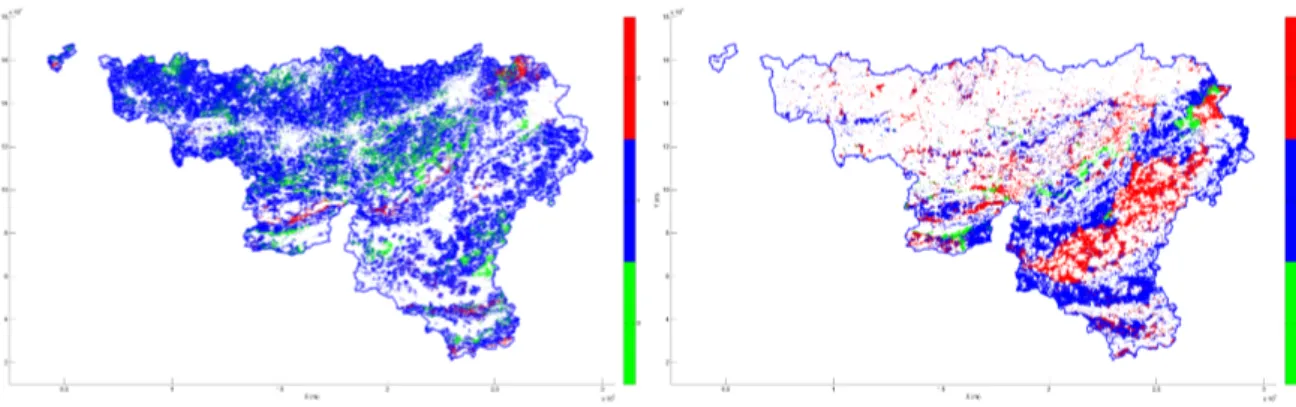
The risk of soil compaction is then quantified for various scenarios corresponding to the usage of agricultural or forestry machines. From the weight and tire characteristics of the machine, the vertical stress σzapplied to the soil at 40 cm depth is computed with the Terramino R model
(Stettler et al., 2010). If σz > Pc, the soil will be compacted by the machine. Using the 100
simulation maps of Pc values, the risk of soil compaction is computed as the probability that σz> Pc at a given grid node by
R=
100
∑
k=1
Ik(σz> Pc) (5)
where Ikis an indicator variable: Ik= 1 if σz> Pc ; Ik= 0 else.
Two scenarios are shown here :
1. Scenario 1 with an agricultural tire, equipping a harvesting machine, with a load of 6300 kg at 1.2 bar.
2. Scenario 2 with a forest tire equipping a grapple skidder, with a load of 4625 kg at 4.0 bars.
Figure 5: Risk maps at pF 1.8 for a scenario in agricultural land (left) and in forest land (right). Three classes of risk are defined: Low risk (R ≤ 10%, in green), intermediate risk (10% < R ≤ 90%, in blue) and high risk (R > 90%, in red).
Results are shown at Figure 5. On each map, the risk values are only shown where applicable, i.e. on agricultural (resp. forest) land for scenario 1 (resp. scenario 2). To facilitate the inter-pretation of the maps and the design of areas submitted to relevant policy measures, raw risk values are classified in three classes : Low risk (R ≤ 10%), intermediate risk (10% < R ≤ 90%) and high risk (R > 90%).
High risk areas should be protected by preventing the concerned machine to work there. In intermediate risk areas, the passage of the machine may be envisaged if some precautions are taken, like not working in wet conditions, trying to always use the same access path, etc.
4
Conclusion
Assessing vulnerability of soils to compaction is a difficult task to achieve at a regional scale because of the number of parameters involved. Measuring them on an exhaustive manner would be prohibitive in time and cost. Modeling appears to be a valuable solution.
Using a well established set of pedotransfer functions for computing the precompression stress and only yet available data bases, a model is proposed here, combining geostatistical Monte Carlo simulations, to map the precompression stress at the regional scale. A measure of uncertainty on the prediction is also given. From this model, specific machine usage scenarios could also be investigated. Soil compaction risk maps have been drawn and can be used as a decision tool for policy makers in order to protect soils against long-term damages.
References
Aitchison, J. 1997. The one-hour course in compositional data analysis or compositional data analysis is simple. (CIMNE).
Batey, T. & McKenzie, M. 2006. Soil compaction: identification directly in the field. Soil Use and Management, 22, 123–131.
CNSW 2013. Carte Num´erique des Sols de Wallonie. Service Public de Wallonie. http://cartopro3.wallonie.be/CIGALE/viewer.htm?APPNAME=CNSW.
COM 2006. 232 final. http://eur-lex.europa.eu/LexUriServ/LexUriServ.do?uri=COM: 2006:0232:FIN:EN:PDF. COSW 2013. Carte d’Occupation des Sols de Wallonie. Service Public de Wallonie.
http://cartopro3.wallonie.be/CIGALE/viewer.htm?APPNAME=COSW.
D’Or, D. 2003. Spatial prediction of soil properties, the Bayesian Maximum Entropy approach. Ph.D. thesis, Facult´e d’Ing´enierie Biologique, Agronomique et Environnementale, Universit´e catholique de Louvain. D’Or, D., Bogaert, P. & Christakos, G. 2001. Application of the BME approach to soil texture mapping. Stoch.
Env. Res. Risk A., 15, 87–100.
Frey, B., Kremer, J., R¨udt, A., Sciacca, S., Matthies, D. & P., L. 2009. Compaction of forest soils with heavy logging machinery affects soil bacterial community structure. European Journal of Soil Biology, 45, 312–320. Goovaerts, P. 1997. Geostatistics for Natural Resources Evaluation. (Oxford University Press., New York). Goutal, N. 2012. Modifications et restauration de propri´et´es physiques et chimiques de deux sols forestiers
soumis au passage d’un engin d’exploitation. Ph.D. thesis, Institut des Sciences et Industries du Vivant et de l’Environnement, AgroParisTech.
Greacen, E. & Sands, R. 1980. Compaction of Forest soils. A Review. Aust. J. Soil Res., 18, 163–189.
Hakansson, I. & Reeder, R. 1994. Subsoil Compaction by Vehicles with High Axle Load Extent, Persistence and Crop Response. Soil and Tillage Research, 29, 277–304.
Hamza, M. A. & Anderson, W. 2005. Soil compaction in cropping systems - A review of the nature, causes and possible solutions. Soil and Tillage Research, 82, 121–145.
Heuvelink, G. & Pebesma, E. 1999. Spatial aggregation and soil process modelling. Geoderma, 89, 47–65. Hollis, J., Hannam, J. & Bellamy, P. 2012. Empirically-derived pedotransfer functions for predicting bulk density
in European soils. European Journal of Soil Science, 63, 96–109.
Horn, R. & Fleige, H. 2003. A method for assessing the impact of load on mechanical stability and on physical properties of soils. Soil and Tillage Research, 73, 89–99.
Jones, R., Spoor, G. & Thomasson, A. 2003. Vulnerability of subsoils in Europe to compaction: a preliminary analysis. Soil and Tillage Research, 73, 131–143.
Lipiec, J., Horn, R., Pietrusiewicz, J. & Siczek, A. 2012. Effects of soil compaction on root elongation and anatomy of different cereal plant species. Soil and Tillage Research, 121, 74–81.
Nelson, D. & Sommers, L. 1996. Total carbon, organic carbon, and organic matter. In: Methods of Soil Analysis. Part 2, Agronomy(American Society of Agronomy, Inc., Madison, WI.).
Pawlowsky, V., Olea, R. A. & Davis, J. C. 1995. Estimation of regionalized compositions - A comparison of 3 methods. Math. Geol., 27, 105–127.
Soane, B. D. & van Ouwerkerk, C. 1995. Soil compaction problems in World agriculture. In: Soil Compaction in Crop Production, (eds. B. D. Soane & C. van Ouwerkerk) (Elsevier).
Stettler, M., Keller, T., Schjonning, P., Lamande, M., Lassen, P., Pedersen, J. & Weisskopf, P. 2010. TERRANIMO - A web-based tool for assessment of the risk of soil compaction due to agricultural fieldR
traffic. In: Proceedings of AgEng 2010. Paper 384.
Van Orshoven, J., Maes, J., Vereecken, H., Feyen, J. & Dudal, R. 1988. A structural database of Belgian soil profile data. Pedologie, 38, 191–206.
Walvoort, D. J. J. & De Gruijter, J. J. 2001. Compositional kriging: A spatial interpolation method for composi-tional data. Math. Geol., 33, 951–966.
W¨osten, J. 2000. The HYPRES database of hydraulic properties of European soils. Advances in Geoecology, 32, 135–143.