Impact of the Freezing of Member State
Quota Contributions during the
1995-2008 Period
Main Document
San Jose, Costa Rica
Informational Document Original: Spanish May 2009
Table of Contents
1. Introduction ... 1
2. Income and main operating costs ... 2
2.1 Income ... 2
2.2 Main operating costs ... 4
3. Funding of technical cooperation services ... 8
4. Conclusions ... 10 Appendix
1. Introduction
The IICA Medium Term Plan establishes the medium-term institutional strategy through which the Institute will support its Member States in their pursuit of progress and prosperity through the modernization of the rural sector, the promotion of food security, and the development of an agricultural sector that is competitive, technologically prepared, environmentally managed, and socially equitable for the peoples of the Americas.
This important statement proceeds from an institution which, in order to fulfill its mandate, must develop technical cooperation services in areas of high priority to its Member States, meet growing demand for its services, and address crucial issues involving its growing operating and personnel costs. This must be done notwithstanding the fact that Member State quotas, which are the Institute’s main source of income, have been frozen since 1995.
While quota contributions have been frozen in nominal terms, in practice the purchasing power of these funds has declined significantly, due to the recurring impact of several factors, including the following: (i) changes in the Consumer Price Index (CPI) and the Exchange Rate (ER) of Member States, which have weakened the purchasing power of the Institute’s income1; (ii) the growing operating costs of the Institute – both in terms of personnel and the price of goods and services acquired to provide technical cooperation to Member States.
This document will attempt to identify the main effects of the freezing of Member State quotas on the financial situation of the Institute, as well as its ability to develop the capabilities required to provide technical cooperation services.
The document provides a brief overview of funding sources since 1995, in both nominal and real terms; the evolution of the Institute’s main operating costs; and the conclusions of an analysis of these factors.
At the request of the Special Advisory Committee on Management Issues, an updated version of the study submitted to the SACMI during the 2004 Regular Meeting has been prepared, using information available as of 31 December 2008.
2
2. Income and main operating costs 2.1 Income
IICA possesses three sources of income: (i) Member State quotas; (ii) miscellaneous income generated by the sale of services or assets, financial returns, and tax refunds; (iii) income arising from the recovery of indirect administrative and technical costs (CATIs/TIN), following the administration and execution of technical cooperation projects funded by governments or international organizations.
Quotas are the Institute’s main source of income. Their nominal value increased at a yearly rate of 3.5% between 1990 (US$23.1 million) and 1995 (US$27.5 million). Since 1995, however, they have remained constant. This has led to a significant decline in the Institute’s purchasing power; in real terms, the quotas approved for 2008 were equivalent to US$19.9 million, which represents a 27.5-percent drop in the purchasing power of quotas, compared to 1995. In absolute terms, this is equivalent to US$7.6 million (Figure 1).
Miscellaneous income increased significantly between 1995 and 1997, rising from US$1.5 million to US$3.3 million in nominal terms. It declined between 1998 and 2000, rose once again in 2001, and remained relatively stable until 2007. It rose significantly in 2008, thanks to the US$1.3-million increase approved that year by the IABA. Nevertheless, the deflated value of 2008 miscellaneous income is almost equivalent to that of 1995, due to a significant decline in purchasing power. Thus, the nominal growth recorded between 1995 and 2008 has barely offset the reduction in purchasing power which occurred during the same period (Figure 2).
Between 1995 and 1998, CATIs/TIN grew steadily, rising 74.5% to reach a nominal value of US$9.6 million in 1998. Between 1998 and 2003, however, they declined by 45%. Between 2004 and 2008, they rose once again, growing by 129.4%. The real value of CATIs/TIN has followed a similar trajectory; 2008 figures are slightly lower than those recorded in 1997. This is attributable to the loss of purchasing power of CATIs/TIN over the last ten years; the significant increase in nominal value recorded between 2004 and 2008 has only served to recover a degree of purchasing power similar to that of 1998 (Figure 3).
4
The overall budget of the Institute (quotas, miscellaneous income, and CATIs/TIN) trended upward between 1995 and 1997, in both nominal and real terms, thanks to a substantial increase in CATIs/TIN and miscellaneous income; the Institute’s budget reached a nominal value of US$40.4 million in 1997. From that point onward, the trend was reversed. A decline of 11.2% took place between 1997 and 2003. Sustained growth returned, however, between 2004 and 2008, driven once again by CATIs/TIN. A nominal amount of US$43.8 million was achieved in 2008 (Figure 4).
In terms of real value, the Institute’s overall income clearly reflects the distressing negative trend observed over the last few years. While the growth of CATIs/TIN between 1996 and 1998 did offset and exceed the loss of purchasing power caused by the freezing of quotas, since 1999 the income of the Institute has been lower, in real terms, than the sum of resources available in 1995 (US$34.6 million). In 2008, the loss of total-income purchasing power, compared to 1995, was estimated to be 16.7%, or US$5.8 million.
2.2 Main operating costs
The salaries of international professional personnel (IPP), local professional personnel (LPP), and general service personnel (GSP) constitute the main operating cost of the Institute. Over the past seven years, this item has accounted for 60% of the Institute’s regular budget, on average (Appendix 3, Table 7).
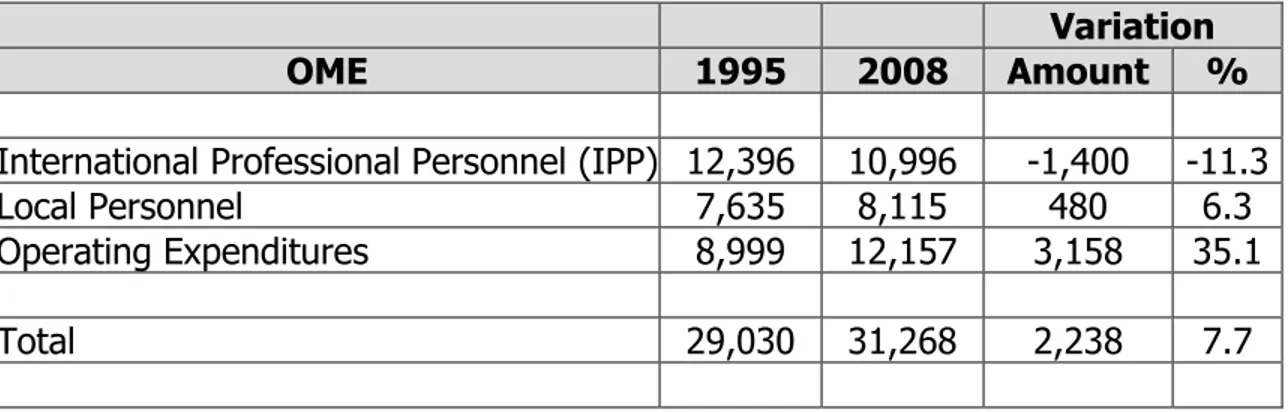
During the 2002-2008 period, an average of 40% of the regular budget was allotted to operating costs. Its nominal value rose by 35.1% between 1995 and 2008.
5
Table 1. Variation in IPP, local personnel and operating personnel expenditure
1995-2008 (Thousands, US$)
Variation
OME 1995 2008 Amount %
International Professional Personnel (IPP) 12,396 10,996 -1,400 -11.3 Local Personnel 7,635 8,115 480 6.3 Operating Expenditures 8,999 12,157 3,158 35.1
Total 29,030 31,268 2,238 7.7
Between 1992 and 2008, the IPP payroll was cut by 29.9%, GSP was cut by 34.4%, and local professional personnel increased by 59.8%. The Institute currently possesses 94 IPPs, 131 LPPs, and 227 GSPs.
In order to maintain an adequate ratio between the Institute’s payroll expenditures and its overall budget, IPP and GSP spending has been reduced considerably (11.3% since 1995). An effort has been made to partially offset IPP cuts by expanding the LPP payroll and hiring consultants.
The technical cooperation capabilities of the Institute have declined, however, as has its ability to mobilize international personnel between countries.
The annual unit cost of international professional personnel has increased in recent years, rising from US$93.9 thousand in 1995 to US$117.0 thousand in 2008 (Appendix 3, Table 9). Nevertheless, a significant reduction (28.8%) in the number of international professionals has made it possible to reduce overall spending on that item from US$12,396 thousand to US$10,996 thousand.
6
Table 2. Positions funded by IICA personnel budget, by type
Year IPP Personnel Category LPP GSP Total
1992 134 82 346 562 1993 134 79 344 557 1994 132 80 349 561 1995 132 81 312 525 1996 121 87 289 497 1997 117 95 285 497 1998 110 98 249 457 1999 103 101 247 451 2000 99 97 251 447 2001 99 97 251 447 2002 96 101 238 435 2003 93 120 221 434 2004 94 126 230 450 2005 94 126 230 450 2006 94 131 237 462 2007 94 131 227 452 2008 94 131 227 452 Variation (%) -29.9 59.8 -34.4 -19.6
The average annual unit cost of LPP and GSP rose by 16.7% during the same period, from US$19.4 thousand in 1995 to US$22.7 thousand in 2008.
Another important technical cooperation expenditure, aside from technical staff salaries, is travel and per diem. It should be noted that the cost of air travel along the routes most frequently used by IICA employees has risen by 35 to 40% over the last ten years, according to data provided by the International Air Transport Association (IATA).
Per diem scales also increased significantly between 1997 and 2008 – particularly in North America, Central America, and the Caribbean, as shown in Table 3.
7
Table 3. Changes in per diem scales for selected cities between 1997 and 2008
(US$/day)
Selected Cities 1997 2008 Variation (%)
North America Montreal (Canada) $132 $308 133.3 Washington D.C. (USA) $194 $289 49.0 Mexico D.F. (Mexico) $168 $197 17.3 Central America Guatemala (Guatemala) $125 $122 -2.4 San Jose (Costa Rica) $135 $165 22.2 San Salvador (El Salvador) $145 $158 9.0
Caribbean
Kingston (Jamaica) $153 $267 74.5 Santo Domingo (Dom. Rep.) $102 $202 98.0 Port of Spain (Trinidad and Tobago) $138 $306 121.7 South America
Caracas (Venezuela) $170 $216 27.1 Lima (Peru) $221 $161 -27.1 Santiago (Chile) $192 $119 -38.0 Buenos Aires (Argentina) $214 $170 -20.6
The cost of leasing office space in Member States also rose substantially between 2003 and 2008, as shown in Table 4.
8
Table 4
Office leases funded with IICA resources – quotas, CATIs/TIN, miscellaneous income, and self-financing
2003 vs. 2008
IICA Office 2003 Execution 2008 Percentage Variation
Guatemala 44,400 34,500 -22.3% Honduras 22,306 40,000 79.3% Panama 2,008 26,580 1224.0% Haiti 16,000 15,000 -6.3% Jamaica 20,000 20,000 0.0% Trinidad and Tobago 33,828 37,442 10.7% Ecuador 30,240 40,320 33.3% Peru 10,150 43,000 323.6% Brazil 58,754 164,280 179.6% Canada 42,200 67,040 58.9% USA * 127,708 163,980 28.4% Mexico 120,499 166,912 38.5%
TOTAL 530,094 US$ 821,062 US$ 54.9%
Includes Washington and Miami office leases.
3. Funding of technical cooperation services
As explained above, the overall income of the Institute as fallen in real terms over the last 11 years, even as its main operating costs have steadily increased. Its ability to address technical cooperation needs in a timely manner has suffered as a result.
Figure 5 charts the evolution of the resources allocated from the Regular Fund to direct technical cooperation services2 between 1995 and 2008. While technical cooperation
funds did grow slightly in relative terms (11.7% in real terms) until 2003, they declined thereafter, falling to a real value equivalent to 85.5% of 1995 resources in 2008 (US$22.3 million), as shown in Appendix 3, Table 8.
9
This is a direct result of the financial limitations faced by IICA during the period in question. These limitations have been partially offset by measures designed to improve the efficiency and effectiveness with which the Institute’s scarce available resources are used, in order to ensure the continued provision of a minimum of technical cooperation services, amid growing and diverse demand on the part of Member States.
Financial constraints have limited the ability of the Institute to properly address a number of important hemispheric, regional, and national technical cooperation needs. Nevertheless, thanks to the approval by the Executive Committee and the IABA of special budgets for the 2004-2005 (US$3.0 million), 2006-2007 (US$2.6 million), and 2008-2009 (US$1.0 million) periods, the Institute has been able to fulfill specific mandates from its governing bodies in fields such as the promotion of agricultural trade in Member States, agricultural health and food safety, agricultural insurance, agro-tourism, the Center for Leadership in Agriculture, and horizontal cooperation between Member States.
This, however, is only a temporary solution to the loss of purchasing power caused by the freezing of Member State quotas. In the medium and long term, other measures will be required to remove the underlying causes of the problem.
10
4. Conclusions
The “freezing”, in 1995, of Member State quotas has had a negative impact on the Institute’s ability to finance technical cooperation actions. Due to the progressive loss of the purchasing power of these resources, the quotas assigned to IICA between 1995 and 2008 have declined by 27.5% in real terms.
The measures adopted to mitigate this loss have significantly changed the overall funding structure of the Institute. The shift began in 1993, when, in order to remain in step with the technical cooperation needs of Member States, the Institute began to offset its budgetary shortfalls by taking in revenues from the administration of external resources (CATIs/TIN) and miscellaneous income. The relative importance of these income sources increased substantially as a result; they represented 20.4%, 28.1%, and 37.2% of the Institute’s annual budget in 1995, 2005, and 2007, respectively (Appendix 1).
CATIs/TIN have become a strategic component of the Institute’s budget. Accordingly, as part of its financial strengthening policy, the Institute centralized the administration of these resources in 2004. They are now allocated as part of the regular planning process followed by the Institute as a whole.
By systematically reducing its international professional personnel (28.8%) and general service personnel (27.2%) between 1995 and 2005, IICA has maintained an adequate ratio between its payroll costs and its overall budget. IPP cuts have been partially offset by an increase in local professional personnel.
Rapid increases in personnel costs and other expenditures essential to technical cooperation have significantly curtailed the Institute’s operating capabilities, as well as its ability to address the growing and diverse technical cooperation needs of Member States. This is due to the fact that the resources available for the Institute’s units have been outstripped by rising operating costs.
Consequently, the Institute’s technical reach has been reduced, as has its ability to mobilize international personnel between Member States. Measures have thus been taken to sharpen the focus of technical cooperation activities, in order to ensure that the scarce resources available are used efficiently and effectively, thereby enabling the Institute to continue providing a minimum of technical cooperation services.
In short, the factors described above have led to structural adjustments, including a reduction in the number of employees payrolled by the Institute, a redistribution of functions, the scaling back of efforts to develop new institutional capabilities, the reduction of pre-investment resources, and an emphasis on the development of effective partnerships.
11
Thus far, IICA has, with some difficulty, been able to overcome the problems resulting from the financial limitations it has faced since 1995. It is essential, however, to ensure that both the 2010-2020 Strategic Plan and the next 2010-2014 Medium-term Plan include measures to guarantee the future financial sustainability of the Institute. Any solution must be based on a comprehensive analysis that takes into consideration the thematic focus of technical cooperation efforts, as well as the organizational structure of the Institute and the need for financial prudence, fiscal discipline, and an increase in the quota contributions of Member States.