UNIVERSITY OF QUEBEC AT MONTREAL
THE EVOLUTION OF A SECTORAL SYSTEM OF INNOVATION: A STUDY OF THE SOLAR PHOTOVOLTAIC SECTOR
THESIS PRESENTED AS
PARTIAL REQUIREMENT FOR DOCTORAL PROGRAM ON SCIENCE, TECHNOLOGY AND SOCIETY OF THE
UNIVERSITY OF QUEBEC IN MONTREAL
BY XUEHAN
Avertissement
La diffusion de cette thèse se fait dans le respect des droits de son auteur, qui a signé le formulaire Autorisation de reproduire et de diffuser un travail de recherche de cycles supérieurs (SDU-522 - Rév.0?-2011 ). Cette autorisation stipule que «conformément à l'article 11 du Règlement no 8 des études de cycles supérieurs, [l'auteur] concède à l'Université du Québec à Montréal une licence non exclusive d'utilisation et de publication de la totalité ou d'une partie importante de [son] travail de recherche pour des fins pédagogiques et non commerciales. Plus précisément, [l'auteur] autorise l'Université du Québec à Montréal à reproduire, diffuser, prêter, distribuer ou vendre des copies de [son] travail de recherche à des fins non commerciales sur quelque support que ce soit, y compris l'Internet. Cette licence et cette autorisation n'entraînent pas une renonciation de [la] part [de l'auteur] à [ses] droits moraux ni à [ses] droits de propriété intellectuelle. Sauf entente contraire, [l'auteur] conserve la liberté de diffuser et de commercialiser ou non ce travail dont [il] possède un exemplaire.»
UNIVERSITÉ DE QUÉBEC À MONTRÉAL
L'ÉVOLUTION D'UN SYSTÈME SECTORIEL D'INNOVATION: UNE ÉTUDE DU SECTEUR SOLAIRE PHOTOVOLTAÏQUE
THÈSE PRÉSENTÉE
COMME EXIGENCE PARTIELLE
DU DOCTORAT EN SCIENCE, TECHNOLOGIE ET SOCIÉTÉ
PAR
XUEHAN
et les méthodologies du système sectoriel d'innovation. Les questions, y compris les raisons pour lesquelles le secteur a évolué si vite, les différences parmi les pays et les régions, les rôles des scientifiques et des petites entreprises dans l'innovation technologique et la façon dont la Chine peut se développer si rapidement, même sans les fortes capacités technologiques et le soutien industriel gouvernemental, sont explorées.
En intégrant l'analyse quantitative en employant le brevet USPTO et les données de publication SCOPUS, et une étude qualitative avec des études de cas et la collecte de données secondaires, les caractéristiques distinguées du secteur photovoltaïque solaire, y compris la variation intensive et innovation cascade, les clusteurs déséquilibrés, les limitées d'entrepreneuriat des scientifiques étoiles et le soutien gouvernement limité lié aux militaires pour les petits innovateurs américains, sont détectés. Totalement, il y a neuf chapitres dans la dissertation, dont quatre articles ont été soumis aux journaux.
Les contributions théoriques et empiriques indiquent que l'étude donne plus de détails au concept de cascade d'innovation, que les clusteurs plus diversifiés pourraient être plus résistants, que l'esprit d'entreprise et l'innovation des. petites entreprises sont spécifiés par l'industrie.
Mots-clés: solaire photovoltaïque, système sectoriel d'innovation, évolution sectorielle, clusteur, scientifique étoile, entrepreneuriat, petites entreprises
ACKNOWLEDGEMENTS
Firstly, 1 want to express my deepest gratitude to my superviser, Prof. Jorge Niosi, for his· great support, diligent guidance and warmest encouragement. lt is be cause of him that 1 can retum to the track of academie research and continue to study again for another Ph.D. after ten years' practical works. lt is because of him that 1 can focus on the subject of innovation, so that my rich experience on science and technology policy can be integrated into research and development of the sector, which brings me not only a broader view ofresearch, but also a deeper understanding ofhigh-tech industries. lt is because of him th at 1 dare to insist on putting my efforts into publishing academie papers, the perfect way to enhance my academie capabilities for further achievements. Words only cannot express my gratitude, the only way to thank hirn is to pay my highest respect to him and dedicate myselfto the continuous academie work and produce more high-quality publications.
Secondly, 1 want to express my gratitude to Prof. Majlinda Zhegu, who has given me th~ opportunity to engage in a second Ph.D. program. She offered me ali the guidance I needed regarding courses, advanced ideas and the tools for improving my academie capabilities, as weil as the information to apply and succeed in the Quebec Research Fund to support my studies. Without her assistance, 1 would have never been able to embark in such a project.
Thirdly, 1 want to thank Prof. Xavier Olleros for stimulating my curiosity, showing me new ideas and methods for academie research and helping me all the time. Other professors 1 would like to express my sincere gratitude to include Prof. Marc Banik and Prof. Eve Seguin, who also kindly provided me with valuable tools for academie research.
Because 1 am a new resident to Canada, my son was born here and 1 have begun a new life. The warm culture and fair academie environment make it possible for me to concentrate on my studies without worrying about life and the future. I enjoy studying and living in Canada, and 1 hope 1 can contribute even more. Finally, I want to thank my fan1ily. My husband continuously gives me support and encourages me so that I can concentrate on my studies. My daughter tries hard to be independent and helps me with the housework and taking care of her brother, so that 1 can have enough time to collect data and write the papers and my thesis. My son is so cute that relieves me of a lot of pressure during the who le process of my study.
It is a difficult but enjoyable period oftime, but I want to thank you ali for transforming days!
TABLE OF CONTENTS
TABLE OF CONTENTS ... vi
LIST of FIGURES ... xi
LIST OF TABLES ... · ... xiii
ABSTRACT ... xv
CHAPTERI INTRODUCTION ... 1
1.1. The origin of the study ... 1
1.2. Starting point ... 3
1. 3. Theoretical framework ... 4
1.3 .1. The sectoral system of innovation ... .4
1.3 .2. The evolution of the sectors ... 6
1.3.3. Star scientists ... 7
1.3 .4. Entrepreneurship and small business ... 11
1.3.5. Regional system of innovation: Cluster ... 13
1.4. Methodology ... 16
1.4.1. Research routes ....... 16
1.4.2. Data collection ... 18
1.5. Structure of the thesis ... 25
CHAPTERII SOME KEY POINTS OF SOLAR PHOTOVOLTAIC SECTOR ... 31
2.1. Significance of the sec tor ... 31
2.2.1. Technology categories ... 3 7
2.2.2. Measurement of the solar cell efficiency ... 43
2.3. Regulations of the sector ... 46
CHAPTERIII SECTOR EVOLUTION UNDER INNOVATION CASCADE ... 48
3 .l.The evolution of industries from li fe cycles to innovation cascades ... .49
3.1.1. PLC and ILC ... 49
3 .1.2. System dynamics, complexity and his tory friendly models ... · ... 52
3 .1.3. The patterns of innovation ... 54
3.1.4.Innovation cascades ... 59
3.2. Methodology ... 66
3.2.1. For innovation cascade ... 66
3.2.2. For evolution of the solar PV sector ... 68
3.3. Results ... 71
3.3 .l.Innovation Cascade in the solar PV sector. ... 71
3.3.2. Evolution of the sector ... .' ... 87
3 .4. Conclusion and po licy recommendation ... 96
3.4.1. The influencing factors model ... 96
3.4.2. policy and managerial implications ... 97
CHAPTERIV THE CATCH-UP OF THE CHINESE SOLAR PV SECTOR ... 99
4.1. Introduction ... 99
4.2. Literature review ... 103
4.2.1. The new teclmo-economic paradigm ... 104
viii
4.2.3. Entrepreneurs benefit from the transnational technology diffusion 108
4.2.4. Production capability vs. technology capability ... 109
4.3. The Chinese solar PV sector ... 112
4.3.1. Government support before 2011 ... 112
4.3 .2. Hum an resources ... oo .. oo ... oo .. oo ... oo ... 118
4.3.3. Integrative production capability ... 122
4.4. Conclusion and discussion ... 126
CHAPTERV ANCHORED CLUSTERS: THE RISE AND FALL OF SOLAR PV AGGLOMERATIONS ... oo ... 130
5 .1. A theoretical introduction ... 13 0 5.2. The Solar PV clusters ... 135
5.3. Methodology ... 00 ... 137
5.4.Results ... 141
5.4.1.The solar PV clusters in the worldwide ... 141
5.4.2.The different performances among the different clusters ... 147
5.5. Conclusion and policy implications ... 152
CHAPTER VI STAR SCIENTISTS IN PV TECHNOLOGY AND THE LIMITS OF ACADEMIC ENTREPRENEURSHIP ... ··oo··· .... 159
6.1. Introduction ... oo ... oo ... 159
6.2. Hypotheses ... oo ... 164
6.3. The solar PV sector ... 164 6.4. Methodology ···oo···ooooooooooo•· 168 6.5. Results: Stars scientists in the photovoltaic industries 0000 00 00 0000 00000000000000 00 000 169 6.5.1. Definition of star scientist for solar PV sector 00000000000000000000000000000000169
6.5.2. The difference between solar PV and other high-tech disciplines .. 171
6.5.3. Venture capital in solar PV technologies ... 172
6.5.4. University patents ... 173
6.5.5. Star scientist performance ... 174
6.6. Conclusions and policy implications ... 175
CHAPTER VII THE LIMITED INNOVATION OF SMALL BUSINESSES IN THE SOLAR PHOTOVOLTAIC SECTOR IN THE US:IS THE SMALL BUSINESS INNOVATION RESEARCH (SBIR) PROGRAM ABOON FOR SMALL BUS INES SES IN THE US? ... 185 7 .1. Introduction ... 185 7 .2.Literature review ... 187 7.3. Method ... 193 7.3.1 Data ... 194 7.3.2. Data analysis ... 198 7.4. Results ... 200 7 .4.1. Descriptive statistics ... 201 7.4.2. FsQCA analysis ... 202 7.5. Discussion ... 208 7.6. Conclusion ... 213 CHAPTER VIII A SECTOR WITH INNOVATIONS DRIVEN B Y DEMAND ... 215
- - - --- - - -- - - -- - -
-x
8.2. Similarity with the semiconductor sector.. ... 216
8.3. User-innovation sector whose innovations are driven by demands? ... 217
8.4. Can the solar PV sector be taken as a new sub-category in the high-tech industries? ... 222
CHAPTERIX CONCLUSION ... 224
9 .1. Theoretical contributions ... 224
9.1.l.Theoretical contributions ... 224
9.1.2.Contributions for industrial practitioners ... 225
9.2. Policy implication of the study ... 227
9.3. Limits and orientation for further research ... 229
APPENDIX A ... 231
THE EVOLUTION OF SOLAR CELL TECHNOLOGIES ... 231
1.1 The study reasoning route ... 6
1.2 Re se arch route of the study ... 17
2.1 Renewable power generation and capacity as a share of global power, 2006-2014,% ... 32
2.2 Solar PV generation capacity ... 34
2.3 Global new investment in renewable energy by sector, 2014, and growth on 2013, $BN ... 34
2.4 Asset finance ofrenewable energy assets by sector, 2014, $BN ... 35
2.5 Global average levelled cast of electricity for wind and PV, Q3 2009 to Hl 2015, $ Per Mon th ... 36
2.6 Solar energy and its applications ... 37
2.7 Solar cell publications in Scopus(1990-2015) ... 39
2.8 Solar cell US patents granted by year (1976-2013) ... .40
2.9 The evolution of research solar cell efficiency (1975-2014) ... 45
3.1 Solar photovoltaic publication in main countries (1955-2015) ... 80
3.2 Number US patents by assignee country (1976-2013) ... 80
3.3 The percentage ofworld publications on the different continents ... 81
3 .4 The percentage of US patents on the different continents ... 82
3.5 The influence diagram of the solar PV sector innovation and production system ... 96
4.1 The !ife cycle of technology ... 105
4.2 The percentage of exports in Chinese solar PV equipment production ... 115
4.3 Annual US patents granted to Taiwan, Korea and China in 1G solar PV ... 123 4.4 Annual US patents granted to Taiwan, Korea and China in 2G solar PV ... 123
5.1 Patents distribution trends in US ... 14 7 5.2 Patents distribution trends in Asia ... 148
5.3 Patents distribution trends in Munich as the representative cluster in Europe148 5.4 Solar PV clusters according to main type ofpatentees ... 158
7.1 Influence diagram for SME innovation ... 195
7.2 SBIR awards in solar PV from the different government agencies (out of total number of awards) ... 209
XII
7.3 SBIR awards in solar PV from the different government agencies (out of total amount of awards) ... 209
Table Page
1.1 Top 1 0 PV co un tries in 20 14(MW) ... 15
1.2 The dimensions of patents employed in the different chapt ers ... 23
1.3 Description for each chapter ... 29
2.1 Time for sol ar energy poli ci es in the representative co un tries ... 41
3.1 Four stylized cases ofindustry evolution ... 54
3.2 Incrementai and radical innovation defined ... 64
3.3 NAICS and SIC codes of the sol ar photovoltaic sector. ... 67
3.4 Initial innovative organizations in solar cells (1975-2014) ... 73
3.5 The major players in the sectoral system of innovation ... 74
3.6 Top 10 PV modules suppliers, by sales, 2013 ... 75
3.7 Solar cell PV patents by metropolitan areas and type of assignee ... 76
3.8 Four periods in the development of the solar PV technology ... 85
3.9 the inventors of the solar cell technologies till 1976 ... 89
3 .1 0 Top 1 0 patents assignees and specialized mass-market manufacturers ... 91
3.11 The role of top 10 assignees in the sol ar PV industry ... 92
3.12 Top 1 0 specialized manufacturing assignees of the solar PV patents ... 93
4.1 Comparing the industrial supporting policies in different representative countries ... 114
5.1 Definition of anchor tenants ... 132
5.2 USPTO solar PV patents by country, 1976-2013 ... 143
5.3 Solar patents by main metropo1itan area (MA), 1976-2013 ... 144
5.4 Main patentees by regional clusters ... 146
5.5 Factors influencing the growth and resilience ofsolar PV clusters ... 156
5.6 Large and small organizations as patentees by cluster (1976-2013) ... 157
6.1 Star scientist definitions ... 161
6.2 Statistics for cutting point of the criteria for star scientist.. ... 171
6.3 The authors with more than 200 documents in Scopus ... 178 6.4 The nun1ber of academie star scientists in terms of solar PV papers in different
xiv
co un tries ... 180
6.5 Solar PV academie patents by country, state and university ... 184
7.1 Variables for analysis ... 196
7.2 Correlation coefficients between the dependent and independent variables. 199 7.3 Truth table for configurations when considering TEA outcome ... 203
7.4 Sufficiency analysis results ... 204
7.5 ANOVA analysis of market position ... 205
7.6 Quantity of awards V.S. market position ... 205
7. 7 SBIR awardees with patents ... 206
7.8 Paired Samples Statistics ... 207
7.9 Paired Srunples Test ... 207 7.1 0 The SBIR awards of six public listed awardees ... 21 0
theories and the methodologies of sectoral system of innovation, to answer the
questions including why the sector developed so fast, what the country and regional
differences are, what are the roles of star scientists and the small frrms in the
technological innovation, and how China can developed so quickly even without the
strong technological capabilities and governmental industrial support.
By integrating quantitative analysis by employing the USPTO patent and SCOPUS
publication data, and qualitative study with case studies and secondary data collection,
the distinguished characteristics of the solar PV sector including being variation
intensive and innovation cascade, the imbalanced clusters, the limited entrepreneurship
of the star scientists and the limited military-related governrnental support for the small
American innovators are detected. Totally, there are nine chapters in the dissertation,
out of which four papers have been submitted to the journals.
Theoretical and empirical contributions include that the study gives more fleshes to the
concept of innovation cascade, more diverse clusters could be more resilient, the
academie entrepreneurship and the innovation of small businesses are industry-specified.
Key words: solar photovoltaic, sectoral system of innovation, sectoral evolution, cluster,
star scientist, entrepreneurship, small firms
-CHAPTER I
INTRODUCTION
1.1. The origin of the study
In the process to review the sectors that Chinese companies caught up fast in the previous 20 years, the solar photovoltaic sector is distinguished from the other sectors. It is the only sector in which that Chinese companies without the strong technological capabilities or strong industrial government support in the early development stage of the sector can get the best market shares throughout the world. How it was realized? What are the factors leading to the success of the Chinese solar PV companies?
With the extensive study of the Chinese solar PV sector itself, it is found that only the
domestics factors cannat draw the conclusion on their successif the sector is not studied in the systematic way and in the worldwide.
So the ideas to study the sector comprehensively with the theories of sectoral system of innovation is formulated. The following questions are focused:
• How the sector evolves in both the technological and economical perspectives? Does the evolution helps the global diffusion of the technologies? How the technological diffusion promote the development of the sectors in the developing countries like China?
• What are the functions of innovation-active components in the sectoral system of innovation including scientists and small businesses? What are their innovation performance and contributions to the development of the sec tor?
Is there the developmental imbalance in the different regions of the world? What are the factors leading to the imbalances?
All the above questions are to be explored in the theoretical framework of sectoral system of innovation.
3
1.2. Starting point
In arder to explore the novelty and main tain the academie value of the study, severa! aspects have been reviewed. It was found that the solar PV sector is less studied:
• From the standpoint of "Sectoral System of Innovation": when searching the key words "sectoral system of innovation" and "solar photovoltaic", there are just four publications in Scopus. Only one of them is really on reviewing the solar photovoltaic sector with the theories and methodologies of the sectoral system of innovation, in which the case study is about just three countries. When the key words of "sectoral system of innovation" and "solar photovoltaic" are used to search Google Scholar, there is no other paper on the same subject. No paper has
been written on the global development of the sector in the world so far.
• From the standpoint of "clusters": when searching the keywords "clusters" and "solar photovoltaic", there are 19 publications in Scopus and just four papers are directly related. One is about Califomia, one is about Norway, one is about China, and the last one is a bq ut Taiwan. The re is no complete study of the clusters of sol ar PV sector in the world.
• From the standpoint of "Star Scientist": nothing can be found when seat·ching for the words "star scientist" and "solar photovoltaic " in the Scopus database. When
the combination oftwo phrases is searched in Google Scholar, there are no papers about the same subject.
After the complete literature review was done, it was found that these important aspects of the industries have not been studied yet. The virgin sector is waiting to be explored to formulate the novel ideas for the similar high-tech industries.
1.3.Theoretical framework
1.3.1. The sectoral system of innovation
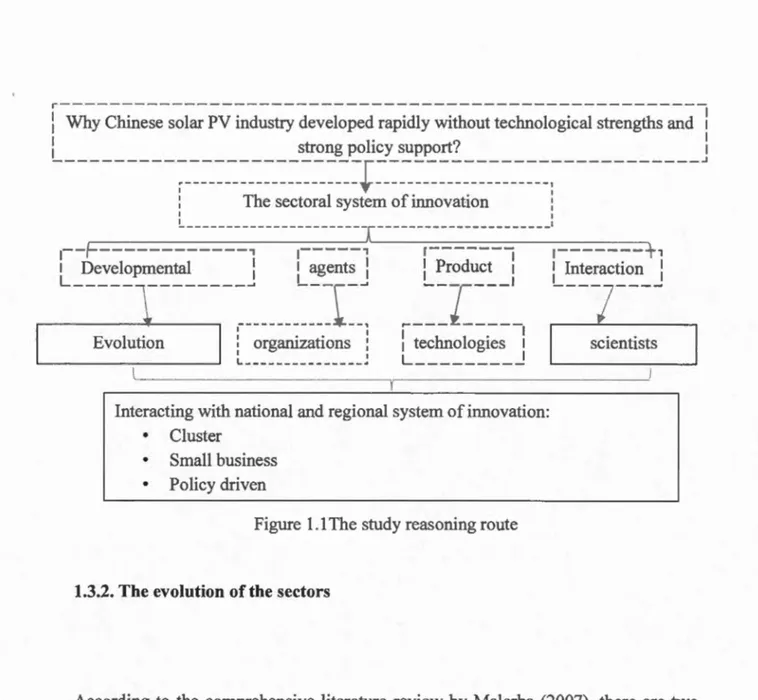
In order to formulate an integrated view of what the main dimensions of sectors are and what may account for the differences across sectors, the sectoral system of innovation concept is useful (SSI). It was put forward by Franco Malerba (1999,2002,2004) according to whom "A sectoral system is a set ofproducts and a set of agents carrying out market and non market interactions for the creation, production and sale of those products." (Malerba, 2002: 247). SSI highlights a different set of points: knowledge and its structure as a key element; the role of non-firm organizations such as universities, fmancial institutions, government, local authorities and of institutions and rules of the games such as standards, regulations, labour markets; the dynamics and transformation of sectoral systems is also emphasized.
5
According to Niosi (20 11), the SSI approach emerging from the work of Malerba is as
potentially fertile as the previous components of the innovation system perspective.
The SSI addition sheds new light on the complexity of the innovation process and helps
to understand the trajectories such as how sectoral systems interact with national and
regional ones, how sectoral poli ci es are to be understood in the light of national ones
and why sorne countries pull ahead or fall behind.
The sectoral system of innovation includes the following components:
• Different agents: large firms, small fim1s, public research organizations,
universities, and governments.
• Technologies and innovations: the categories of innovations, the process of the
innovation produced, the interaction of the organization and technology
evolutions
• The institutions: factors including standards, regulations, labour markets ali
influence the whole system.
These components will be integrated first by exploring the evolution of the sector, the
outstanding results about the different components in the evolution are explored further
1
Interacting with national and regional system of innovation:
• •
Cluster
Small business
Policy driven
Figure 1.1 The study reasoning route
1.3.2. The evolution of the sectors
According to the comprehensive literature review by Malerba (2007), there are two
basic models to study sector evolution: sector life cycle models (ILC), based on the product li fe cycle (PLC) and history-friendly mo dels. Sin ce the late 1970s, se veral
studies using the PLC-ILC model have pointed to the fact that a large number of
industries follow a life cycle in which a radical innovation and the related entry of small
new producers that introduce new products is followed by demand growth, a greater
7
concentrated market structure, and the decline of innovation (Abemathy and Utterback, 1978; Utterback, 1994 ). But it has been convincingly indicated that that the dynamic sequences are different from one sector to another (Klepper, 1997; Geroski, 2003, Malerba, 2007). Thus, individual-sector case studies are necessary to see the real industrial dynamics, particularly in high-technology sectors such as biotechnology, information technologies, nanotechnology and solar photovoltaic; these sectors became noticeable after the PLC had adopted its canonical form in the 1960s and 1970s. In the meantime, some cases studies have been developed, using history friendly models, for example the computer sector (Malerba et al., 1999, 2001), the pharmaceutical sector (Malerba and Orsenigo, 2002), as well as for other industries such as software and chemicals.
In the study, the quantitative analysis and the case studied will be integrated to explore the evolution paths of the solar PV sector.
1.3.3. Star scientists
When any high tech sector is studied, the contributions of the scientists need to be explored.
of firms depended on their human resources, highly qualified managers are in short supply and in addition, existing companies are usually employing them. Those comparues that can hire and keep this qualified human capital will have a sustained advantage over those who do not.
On the basis of Penrose's work, severa! successive !ines of theoretical thought and empirical work appeared in the human resources and strategy fields, linking competences of the finn to its performance. The resource-based theory of the frrm developed to argue that highly performing firms based their advantage on a series of internai resources, among which human capital played a pro minent role (Barney, 1991 ). Sustained competitive advantage and the related sustained performance come from resources that "a finn controls that are valuable, rare, imperfectly imitable and not substitutable" (Barney et al, 2001, p. 625). These resources are composed of managerial, but also organizational and informational elements.
A second line ofthought came with the competence view of the firm. For these authors, resources are valuable only if they translate into competences: the capacity to successfully combine those resources, incorporate new technical and scientific knowledge, to attract venture and intellectual human capital, be it administrative, scientific or other. Resources are important if and only if they can be organized in such a way that they deliver performance (Han1el and Heene, 1994). Following this approach, Colombo and Grilli (2005, 2010) argued that the competencies of the founders are key in new-technology-based firms. When they refer to competencies, they are painting at
9
technical work experience; yet, they found that new technology-based firms have su peri or performance when the team of founders includes people with both economic-managerial and scientific and technical education. In addition, skilled human capital is able to search for new knowledge and new competencies.
In sum, many empirical works have confirmed the link between managerial talent, including scientific and technical, and the long-term performance of the finn, particularly the high-technology-based firm (Colombo and Grilli, 2005; Hitt et al, 2001 ). Also, advanced human capital is linked to innovation, attraction of venture capital and growth in a positive feedback loop.
As the founders with the strong background in science and technology became more and more important in the high-tech firms development, the scientists with the spirit of entrepreneurship have drawn the attention of researchers. Who will contribute more to the development offirms and sectors? How do we recognize these scientists? What are their ways to connect the academie research and the business entrepreneurship? What is the performance oftheir academie entrepreneurship? All the above questions need to be answered.
But not all scientists can contribute to the development of the sector. Lynn Zucker and her colleagues at the University of Califomia Los Angeles (UCLA) launched a small but influential addition to this line of thought. They argued that the biotechnology revolution was the fact of star scientists, tho se biochemists, biologists, medical doctors
and other scientists who had published a large number of articles and appeared as the inventors of several influential patents (Zucker et al, 1994; Zucker et al, 1996). These stars were often the founders and advisors of bio tech companies.
In terms of the ways that star scientists can contribute to the development of the firms, it is necessary to see what is the role of the star scientist in the technology transfer from w1iversities and institutes to the industries. Sorne of these roles include licensing their patents, establishing the university spin-offs (USO), getting listed in the board of directors of start-ups, acting as chief scientists, etc. As to the factors explaining the growth ofthese spin-offs, using a database of 149 university spin-off companies, Walter et al (2006) argued that network capabilities and entrepreneurial orientation are key variables explaining the performance of these USOs. Other authors have found that spin-offs from different US universities have very different performance. More entrepreneurial universities have a much better score as licensors of technology to academie spin-offs. Using a very large sample of US academie spin-offs, Powers and McDougall (2005) found that universities with experienced (older) technology transfer offices (TTO) do incubate more successful spin-offs. More productive faculty (in terms of articles and citations) are also involved in more successful spin-offs. Early collaboration with the sector is also linked to spin-off growth.
Sorne studies show that a large percentage of academie spin-offs is related to biotechnology and health sciences. Mowery et al (2001) calculate that sorne 75% ofthe patenting and licensing in three of the most research-active universities in the United
Il
States (Califomia, Columbia and Stanford) occurred in biomedical research, particularly in biotechnology. The second most important sector they indicate is computer software. Similarly, in the annual survey of intellectual property generated in Canadian universities (Statistics Canada, annual), health sciences appear as number one, although not so prominent as in the USA. None of the studies mentioned the academie entrepreneurship of solar PV sector. So we will focus on the star scientists and their academie entrepreneurships in our specifie sector.
1.3.4. Entrepreneurship and small business
Schumpeter ( 1916) emphasized the role of entrepreneurs in economie dynamics, but for more than fifty years his insights were lost, as mainstream economies turned to equilibriurn, perfect rationality and costless diffusion of knowledge. Under these conditions there could not be entrepreneurs discovering hidden opportunities, technological, market or otherwise.
Yet, since the 1980s, entrepreneurship is a fast-growing field of research. Its rapid growth in the last decades accompanies a change in focus from the individual (psychological) characteristics of the entrepreneur to more environmental variables (Landstrom et al., 20 12). The industrial context was introduced later on (Klepper, 1996; Low and Abrahamson, 1997). The creation of new firms was found to be easier at the beginnings of the sector life cycle, and more difficult when industries are mature. Later
on, institutions were linked to entrepreneurship. Scholars underlined the birth of many new firms using academie research results (Wright et al., 2004). However, corporate spin-offs were found to be more successful than university spin-offs (Klepper and Thompson, 2007).
Small and medium enterprises (SMEs) significantly reinforce the performance of innovation-focused economies by creating technical and organizational novelty, employment and economie growth (Robson and Bennett, 2000; Jutla et al., 2002; Foreman-Peck et al., 2006). More precisely, it is argued that knowledge spillovers from universities and public laboratories allow entrepreneurs in the innovation-driven high-tech firms to identify and exploit new opportunities (Carlsson and Eliasson 2003; Acs et al., 2008). Thus, the revolutionary breakthroughs continue to come predominantly from small entrepreneurial enterprises, and by bringing vigorous competition, particularly in high-tech industries, entrepreneurial enterprises force incumbent firms to innovate in order to survive (Baumol, 2004).
Government support for entrepreneurial fmns has been analyzed under severa! conditions in different countries. Lemer (2009) represents the Jess optimistic point of view when it cornes to public efforts to boost entrepreneurship and venture capital. In his analysis, a few cases of successful support may be opposed to many more cases of failed efforts. Another sceptical view was that of Sternberg (2014), who found that in German y regional factors were much more important than govemment support of new firms.
13
While the difficulties involved in creating governrnent support for venture capital firms has been stressed time and again, severa! cases of undisputed success have also been studied. One is the case of Taiwan's Industrial Technology Research Institute, which has incubated numerous extremely productive semiconductor firms, including in the area of solar technology (Mathews et al, 2011: Mazzoleni and Nelson, 2007).
Among the direct subsidy incentives directed to small and medium sized enterprises in OECD countries, the US Small Business Innovation Research program (SBIR) appears among the most successful (Chu et al., 2006; Allen et al, 2012). Yet it has also been proven that the level of further venture capital success of SBIR subsidies depends on the sector in which new frrms are founded (Lemer, 1999; Toole and Czarnitzki, 2006).
The study of how the entrepreneurial and small firms are supported and developed is one indispensable part for the sectoral system of innovation.
1.3.5. Regional system of innovation: Cluster
'Clusters' were defined by Michael Porter as 'geographie concentrations of interconnected companies, specialized suppliers, service providers, firms in related industries, and associated institutions (for example, universities, standards agencies and trade associations) in particular fields that corn pete but also coopera te' (Porter,
1998: 197-8). A clear condition for the existence of a cluster was the presence of linkages between companies and institutions. Niosi (20 11) concluded that external economies, regional knowledge spillovers, cluster absorptive capacity and the existence of anchor tenants are an1ong the reasons why the clusters are established. When some clusters are falling down while other clusters are developing are weil studied, the resilience of some clusters is understood. We will use the theories on the high-tech clusters for studying the solar PV sector.
It seems that solar PV sector also has the phenomenon of geographie agglomerations. Vidican, Woon and Madnick (2009) found that the solar photovoltaic sector in the U.S. has been concentrated in these two states, with California hosting the largest share of comparues over the years. Mathews, Hu and Wu (2011) found in Taiwan, the Fast-Follower Strategy (FFs) on solar PV sector, which aims at spanning as many steps in the value chain as possible and as quickly as possible, is adopted to promote the solar PV sector by capturing agglomeration and cluster effects for solar PV technology.
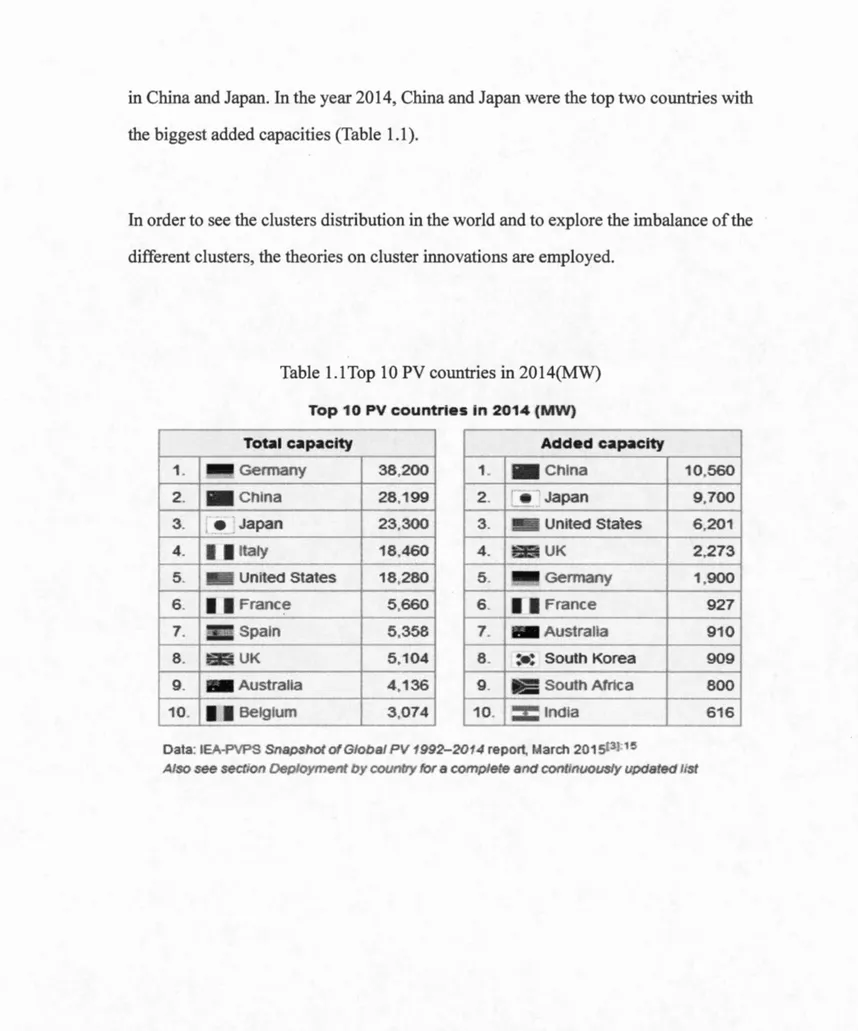
The development of solar PV sector shows its financial imbalance in the recent years. With the withdrawal of the governmental subsiding policies, severa! big European companies including Siemens, closed their operations in 2013. According to Greentech Media, 112 solar energy companies in the United States and the European Union have declared bankruptcy, closed their doors or been acquired by competitors under suboptimal conditions since 20091• But at the same time, the solar PV sector grew well
15
in China and Japan. In the year 2014, China and Japan were the top two countries with the biggest added capacities (Table 1.1 ).
In order to see the clusters distribution in the world and to explore the imbalance of the
different clusters, the theories on cluster innovations are employed.
Table 1.1 Top 1 0 PV countries in 20 14(MW)
Top 10 PV count.rles in 2014 (MW)
Total capacity Added capacity
38,200 1. - China 10,560 nited States rance 7.
Ill
spain 8. S Ut< 9. - AustraHa 10.1
.
1
Belglum 28,199 5,358 5,104 4,136 3,074 2. • JapanData: IEA..PVPS Snapshot ofGJobaf P\/1992-20 4 report, March 2015l3J:t5
9,700
1.4. Methodology
1.4.1. Research routes
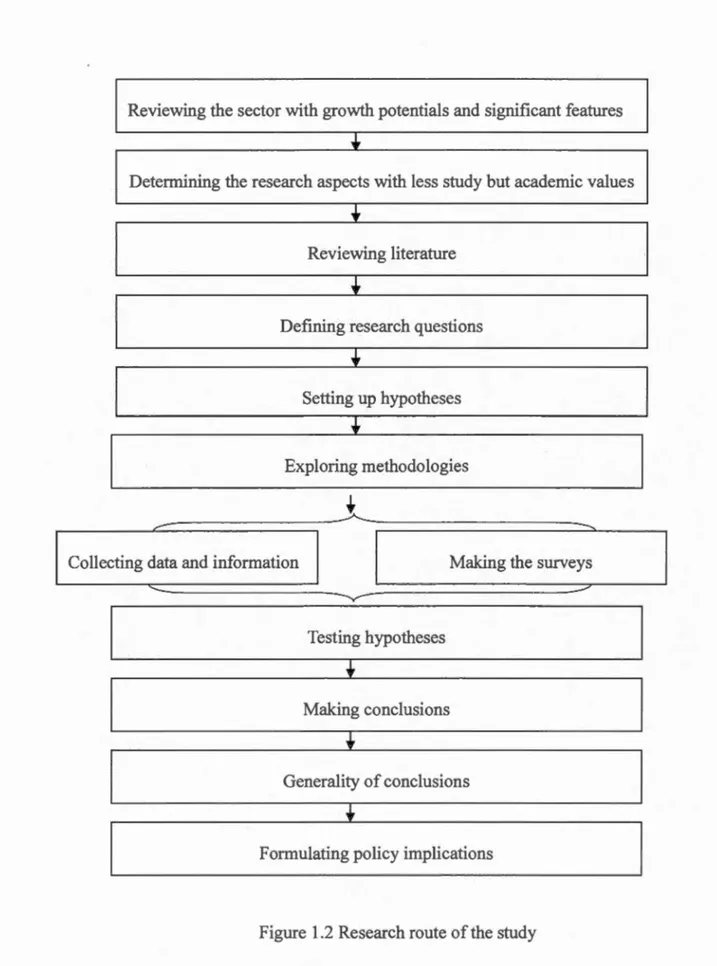
After selecting the solar PV sector, the secondary information of the sector was explored and the research questions were defined. After searching the academie databases and reviewing the related literatures, our hypotheses were set up. The methodology and the databases were selected to explore the findings, and then the conclusions were put forward. By extending the findings to the related areas, policy implications were made. The research route is see in Figure 1.2.
17
Reviewing the sector with growth potentials and significant features
...
Determining the research aspects with Jess study but academie values
...
Reviewing literature
..
Defining research questions
...
Setting up hypotheses
...
Exploring methodologies
/ " -..,
Collecting data and information Making the surveys . /
-v-Testing hypotheses
...
Making conclusions
...
Generality of conclusions
...
Formulating policy implications
1.4.2. Data collection
In order to get the complete analysis of the solar PV innovation all over the world, both data on patents and publications were employed. Besides, in order to see the reasons for the significant findings, case study and secondary data collection were used for the analysis at the different levels.
1.4.2.1. Patents
Patent is the good indicator for assessing the technological capability. Patents can be analysed by in the patent number or patent citation. Business literature argues that the number of patents is an appropriate indicator for comparing the innovation performances of companies in terms of new technologies, processes, and products (Cassiman et al., 2008; Gittelman, 2008). Even the strongest critics of the general use of patents as performance indicators (Arundel and Kabla, 1998; Mansfield, 1986) admit that patents could represent appropriate indicators in many high-technology sectors. Consequently, the identification of the inventors listed in patents provides key information on the history of R&D pro cesses related to a technical invention and th us, a means for retracing knowledge flow through innovation systems or regional clusters of frrms. Y et, a growing number of researchers use patent citations as indicators of the R&D output of firms, or as determinants of innovation performance that could impact
19
on their growth. Unlike a simple counting of patents, which is purely quantitative, patent citations also include a measurement of patent quality because there appears to be a positive relation between a patent's importance and the number of times that it is cited. Patent citations can be very useful as indicators of a patent quality in economie studies of biotechnology-firm innovation and performance (Ja:ffe and Trajtenberg, 2002).
Hu and Ja:ffe (2003) initiated a new line of work examining patterns of knowledge diffusion from advanced countries to latecomer catch-up countries with their study of USPTO patents taken out by Korea and Taiwan over the 22-year period from 1977 to 1999. Four stylized facts emerged from their work which have formed a benchmark for subsequent studies of knowledge diffusion, or what be called knowledge Jeverage by latecomers.
Since then further work has been devoted to taking the analysis to the industry level. Starting with the DRAM industry, Lee and Yoon (20 1 0) investigated patterns of catch -up by Taiwan and Korea, and Lee and Wang (2010) then extended the net to include China. Analysing the patents taken out at the USPTO by Korean and Taiwan over the period 1985-1999, Lee and Yoon (2010) argued that they had found evidence that with regard to relative citation propensity, the order of patent citation follows the order of national entry into the industry, namely that Japanese firms tended to cite US patents;
Korean firms tended to cite Japanese patents; and Taiwanese firms tended to cite Korean patents. Lee and Wang(20 1 0) th en extended the se results to China, arguing that
Chinese firms tended to cite Taiwan patents, and that as the latecomer, China exhibited the lowest level ofintra-national knowledge flows (reflecting low absorptive capacity).
The next industry so studied was FPD(flat panel displays (FPD)); Hu (2008) used US patents registered by top five Taiwanese FPD manufacturers to trace their knowledge sources of FPD technologies. The finding suggests that the knowledge source in latecomers, such as Taiwan, is mostly secured from Japan on specifie core technologies,
rather than fromthe US. Jang et al. (2009) further assessed the innovative capability and international knowledge flows amongst technological forerunners (US and Japan) and latecomers (Taiwan and Korea) in the FPD sector, and confirmed that significant knowledge flows are leveraged by the latecomers (Korea and Taiwan) from the teclmological leaders (US and Japan). But in contrast with earlier studies, Jang et al. found that Japan dominates knowledge flows for Korean firms in FPD industry (lapan accow1ting for 56% oftotal citations by Korean firms at the USPTO between 1976 and 2005, compared with only 20% for the US); likewise Taiwan firn1s' patenting favored. Japan has been over the US as a knowledge source, but with less divergence (39% for Japan vs. 34% for the US). This too presents a very interesting finding that calls for further examination in emerging industries such as solar PV.
Lee and Jin (20 1 0) then turned their attention to the mobile telephone industry, covering patents taken out at the USPTO by Korean, Taiwan and Chinese firms over the period 1976-2008, and found again that in terms of relative citation propensity, the order of patent citation follows the or der of entry into the industry, with J apan following the US,
21
Korea following Japan, Taiwan following Korea, and China following Taiwan.
In the study, the patent numbers are counted as the proof of the innovation capabilities.
It is only acted as the preliminary research to get the full picture of the solar PV sector,
the patent citation will be employed in the continuous studies to explore the detailed
process and product innovations.
As the focus is for the solar PV sector, the key words selected are the "solar cell", "solar cells", "photovoltaic cell" and " photovoltaic cells". After studying the patent data in United States Patent and Trademark Office (USPTO) and in the European Patent
Office (EPO), we found that the data in USPTO is more applicable that EPO's due to
the following reasons:
1. There are many more patents in EPO and Chinese Patent Bureau database than in
USPTO, but the above keywords in EPO and Chinese Patent Bureau database do not
produce results as exact as in USPTO, which means by reviewing the patents randomly
selected from EPO database, sorne with the key words in the abstract are not in the domain. And when the patents issued in USPTO in the databank ofEPO are compared
with the patents directly from USPTO, there is a big difference. So we have to choose
the USPTO database for the patent analysis.
2. The list of issues within each individual patent in USPTO is more comprehensive
but not the data in EPO.
3. As the biggest inventing country, the United States assignees own nearly 50% of the
solar PV patents. Also, competitors in Japan, Germany, Taiwan or the Popular Republic
of China also patent their inventions in the United States in arder to protect them from
potential infringers.
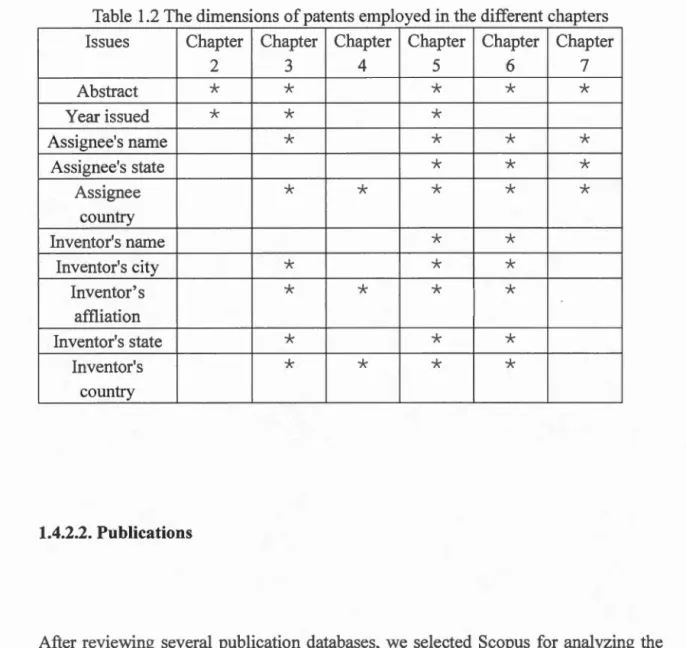
So the patents data in USPTO have been selected as the base for patent analysis. Except
three chapters including introduction, characteristics of the sector and conclusion, the
different issues in the individual patents are taken as samples in the other six chapters
23
Table 1.2 The dimensions of patents employed in the different chapters Issues Chapter Chapter Chapter Chapter Chapter Chapter
2 3 4 5 6 7 Abstract
*
*
*
*
*
Year issued*
*
*
Assignee's name*
*
*
*
Assignee's state*
*
*
Assignee*
*
*
*
*
country Inventor's name*
*
Inventor's city*
*
*
Inventor's*
*
*
*
affliation Inventor's state*
*
*
Inventor's*
*
*
*
country 1.4.2.2. PublicationsAfter reviewing severa! publication databases, we selected Scopus for analyzing the the solar PV sector due to its quality in terms of journal selection and better taxonomy for academie research papers. Ail the papers in the databases were searched with the key words of "solar cell", "solar cells", "photovoltaic cell" and "photovoltaic cells",
and then all the publications obtained by these key words were taken as the new database for analysis. As it was found that nearly all the authors have the publications in the other domains, their publications in the other domains were also searched and
analyzed to explore their academie behaviours, and knowledge transfer.
In order to see the relationship between the academie behaviour and their entrepreneurship for the star scientists, both the patents and publications for the star scientists were studied to see the interrelationship.
1.4.2.3. Case study
In order to explore the reasons and the differences in the world for the solar PV sector, such as how the SSI evolved, the differences among the clusters and why the performance of universities in terms of academie entrepreneurship, case studies with the interviews of sorne key persons were employed.
1.4.2.4. Secondary data collection
For sorne important case studies where there is no response for the request of the survey, the secondary data collections are conducted for getting the relevant information. Secondary data were found in the annual report, statistical repo11, news published in the comparues' websites and data in the government departments' websites. For example, in order to seek the influence of the venture capital in the academie
25
entrepreneurship, annual studies from the venture capital association were employed.
1.5. Structure of the thesis
There are ten chapters in the thesis and they are organized in the following way:
Chapter 1 is the "Introduction", which begins with the research questions raised after reviewing the solar PV sector. After highlighting the starting points, the theoretical frameworks and the methodology are introduced. Then the complete research route is described and the structure of the thesis is included.
Chapter 2 is the introduction of the se veral key points of the solar PV sectors in terms of industrial performance, technologies and regulations. This chapter is employed as the foundation for understanding further specifie studies.
Chapter 3 is about the evolutionary path of the sector. It verified that the variation intensive is the distinctive characteristics of the sector within its evolution. It acts as an independent academie paper that has been submitted to the jomnal for revision and publication. In the thesis, it was kept as originally submitted. It is composed of an introduction, a review of the sector, the methodology, results, conclusion and policy
Chapter 4 is about the innovation cascade of the sector. It acts as an independent academie paper that has been submitted to the journal for revision and publication. In the thesis, it was kept as originally submitted. lt is composed of an introduction, a review of the sector, the methodology, results, conclusion and policy implications.
Chapter 5 is the analysis of how China can realize the catch-up in the solar PV sector. The new techno-economic paradigm, the government support, human resource context,
and integrative production capabilities are studied to formulate the answers.
Chapter 6 is about the geographie agglomeration of the innovations, the clusters of the solar PV sector are defmed in the world and the resilience of the clusters are explored. It acts as an independent academie paper that was submitted to the journal for revision and publication. In the thesis, it was kept as originally submitted. It is composed of an introduction, a review of the sector, the methodology, results, conclusion and policy implications.
Chapter 7 is about the star scientists and their academie entrepreneurship in the solar PV sector. The criteria for defining the star scientist in the world are recalled, and their academie entrepreneurship is explored. It acts as an independent academie paper that was submitted to the journal for revision and publication. In the thesis, it was kept as originally submitted. lt is composed of an introduction, a review of the sector, the methodology, results, conclusion and policy implications.
27
Chapter 8 is about the small innovators in the sector in US. lt is found that the military -related governrnent agencies including by Department of Defense (DOD) or National Aeronautics and Space Administration (NASA) through the Small Business Innovation Research Pro gram (SBIR) and Small Business Technology Transfer Research Program (STTR) support most of the small innovators. The small innovators positioned in the niche rnilitary market can get more awards. lt acts as an independent academie paper that was submitted to the journal for revision and publication. In the thesis, it was kept as originally submitted. lt is composed of an introduction, the data and methodology, results, discussion and conclusion.
Chapter 9 is about the features of the solar PV sector. After studying the evolution of the sector, its geographie agglomeration and the behaviours of the star scientists, sorne divergence in terms of innovation from the other high-tech industries are detected. By comparing with the semiconductor sector, it is found that the solar PV sector is one whose innovation is mostly driven by demand, but not pushed by science and technology progress. Three abnormal aspects are put forward, and whether its distinctiveness is significant enough to be a sub-category of the high-tech sector should be studied further.
Chapter 10 is the conclusion. The contributions of the studies are highlighted, the policy implications are made, and the limits of this enquiry and the further research directions are suggested.
The theme, the research question, theories, methodologies, theoretical or empirical contribution of each chapter are see in Table 1.3.
29 Table 1.3 Description for each chapter Cha methodo l o theoretical and empirical pters them es research questions theories g1es contributions 1 Introduction Key points 2 of the sector Evolution 1 . what is the evo l ution of the Sectora l system of Redefinition of term " and so l ar PV sector ? 2. what is the innovation, Product Quanti tati innovation cascade " , the innovation characteristics of the life cycle and ve & case debate ofPLC -ILC 3 cascade techno l ogical trajectory? Industria l life cycle studies theories Horizonta l technologica l Case policies , the key studies entrepreneurs and the and integrative production China How the Chinese so l ar PV sector secondary capabilities are the 4 Catch -up can realize the catch-up? Catch -up theories data important factors . l.Does the solar PV has the There are 23 clusters in the innovation clusters ? 2.Where do quanti tati v world , there is the the clusters locate? 3 . What are e analysis imbalances in the cluster the di f ference among different & case development in Europe , 5 Cluster clusters ? Cluster studies North America and Asia .
The d efinition of l. What are the definition of the scientists;the academie star scientists for the so l ar entrepreneurhsip photovoltaic sector? 2. Is there a q u anti tati v ventural capitals lot of the academie e analyis i s l imited; famous university entrepreneurships in the solar & case and their techno PV sector? 3 . What are the roles studies & offices do not play Star of ventural capital , universities secondary important ro l e 6 scientist and tehno l ogy transfer offices? Star scientists data academie entrepreurship The innovation small businesses what factors influence the small business in the solar PV innovation Small innovation of the sma ll preformance quanti tati v has been restricted 7 business business ? eva l uation e ana l yisis military interna Demand-What is the characteristics of the evoultion of the compar1so The solar PV sector 8 driven solar PV sector ? sec tor n study demand -driven 9 Conclusion
CHAPTERII
SOME KEY POINTS OF SOLAR PHOTOVOLTAIC SECTOR
2.1. Significance of the sector
Today, about 80% of the world's energy production cornes from fossil fuel, and to date,
coal is the major source of electricity with a share of 42% of electricity and will
continue to be the prime source of electricity in many countries in the coming few
decades. But after a few years, it will be impossible to generate electricity from fossil
fuels like coal and the others. Different organizations such as the US Energy
Information Administration (ElA), International Atomic Energy Agency (IAEA),
International Energy Agency (IEA), World Energy Council (WEC) have published
their projections of future energy demands for 2020, 2030 and 2050,which shows that
only the clean energy systems have the capacity to neutralize the environmental
impacts.
Clean energy is renewable energy that could have the capability of meeting the energy
demands as well as mitigating global warming. In the past few years, it has been
observed that renewable energy technology is steadily maturing and its share of energy
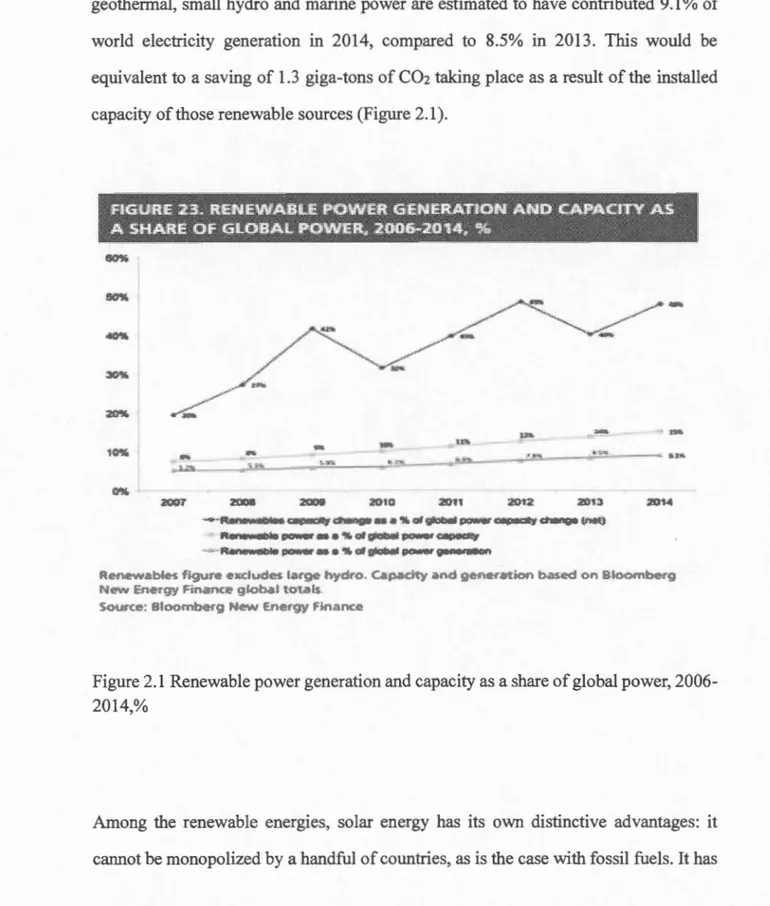
geothermal, small hydro and marine power are estimated to have contributed 9.1% of
world electricity generation in 2014, compared to 8.5% in 2013. This would be
equivalent to a saving of 1.3 giga-tons of
co
2
taking place as a result of the installed capacity of tho se renewable sources (Figure 2.1 ).FiGURE 23~ RENEWABΠPOWER GENERATION AND CAPACrTV AS
A SHARE Of GLOBAL POWER# 2006-2014 .. %
Re "' bi ~ f1gure e eludes larg~ hydro C.apac1 " and gen ration b.ased on 81oomberg New En •tgy Fm t"IC:C global tot.ah
Source. Bloombctg ew En rg fm n<:.c
Figure 2.1 Renewable power generation and capacity as a share of global power,
2006-2014,%
Among the renewable energies, solar energy has its own distinctive advantages: it
33
neither excessive maintenance and management costs nor conversion mechanisms producing troublesome emissions, and it can easily be integrated into both public and private buildings without external environmental impacts, such as those incurred by wind turbines. According to the International Energy Agency (IEA), solar energy could be the largest source of electricity by 2050.
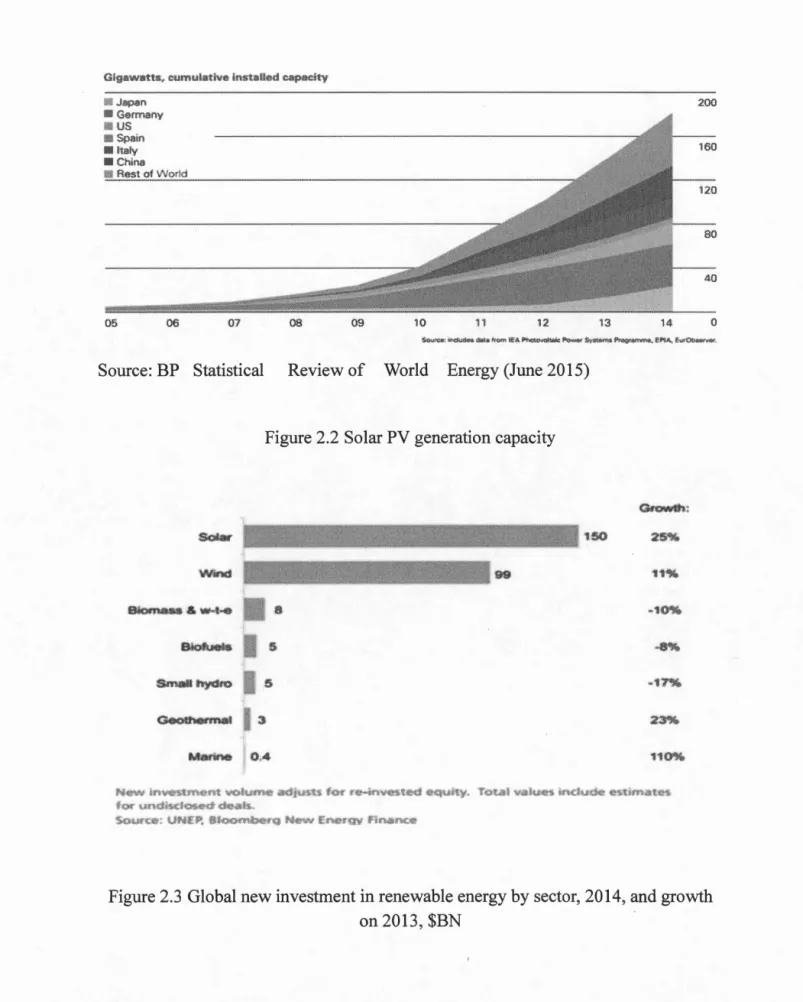
According to Pew Charitable Trusts, in 2013, for the first time, solar outpaced all other clean energy technologies in terms of new generating capacity installed with an increase of 29% compared with 2012. From then on, the sol ar PV generation capacity keeps on growing (Figure 2.2). This is due in part to ongoing priee reductions, including significant cuts in manufacturing costs, but also as a result of investment shifting from small-scale projects to less expensive large-scale ones. Added to this is the fact that electricity priees have increased in general. This has led to a situation where grid parity (the moment when electricity from solar panels costs as much or is even cheaper than electricity purchased from the grid) is within reach. China was the top global market in 2013 with 11.8 GW. Germany topped the European market with 3.3 GW, while the UK was runner-up with 1.5 GW. Europe's role as the PV market leader has come to an end, but various markets within Europe still have almost untapped potential.
Gigawatts, cumu~ative installed cap.aclty Il! Japan IIIIGerrnarw qus USpain llllllialy Ill China 05 06 07 Source: BP Statistical 08 09 10 11 12
Review of World Energy (June 2015)
Figure 2.2 Solar PV generation capacity
81~1
s
Smd ttydro
1
5Goo~m
13
13 14
Nct•w >fh•C'SHn~t vt:th.~m~ .adp.J:U:s ~ r rt ... rnvest~.ed e~u•ty. Total v.Jiu<t.~ 1n<lY~ II!S>titt>.atc~
tot· UII(Îi;~..<:IQSO'tt d~;.Jh:,
SoutC(} UNE • S,lootnt>er~ New E'n.crqy f<J'tdl'l(~
200
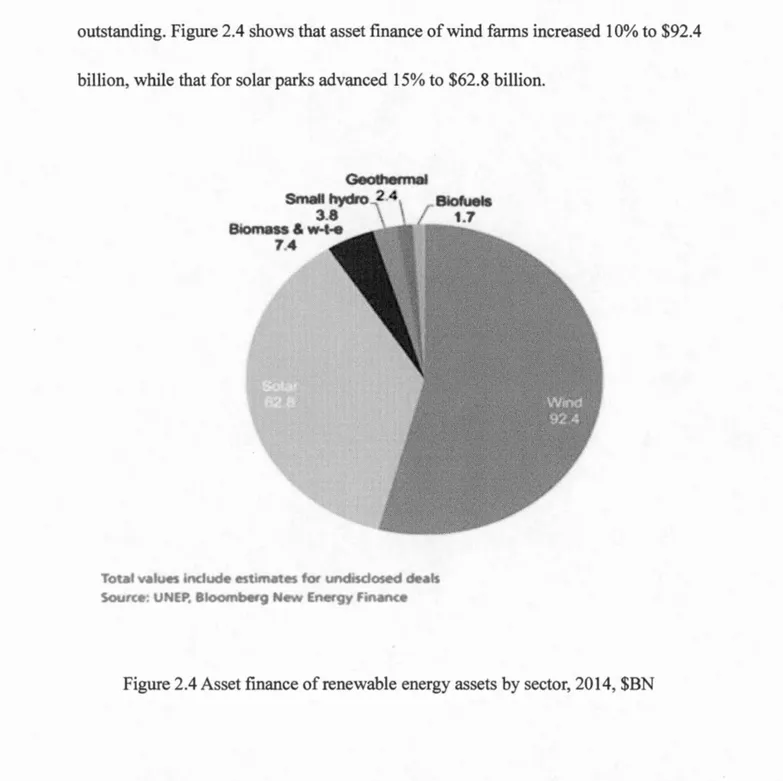
0
Figure 2.3 Global new investment in renewable energy by sector, 2014, and growth on 2013, $BN
- - - · - - - -- - - -- - - -- - - -- - - -
-35
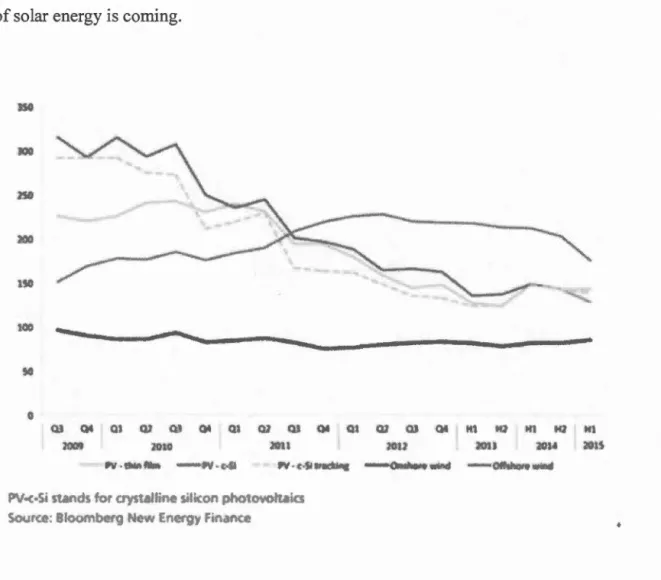
Figure 2.3 shows that solar PV is the renewable energy sector with the highest global new investment and with the highest growth rate in 2014. Although wind was the largest sec tor in terms of utility-scale as set finance in 2014, the growth of sol ar is outstanding. Figure 2.4 shows that asset finance of wind farms increased 10% to $92.4 billion, while that for solar parks advanced 15% to $62.8 billion.
~fl'tffrtnal
Sma:tJ hydro 8Jofue:ls 3.& 1.7 Biomau & w..t....,
7.4
Totat valu~ 1t\dude esbm.:tt~ t'or urH:1lS<:loscd d~als Sour<:é. !JNU•, Sloombefg New fnergy fînarH.
The costs of solar generation are meanwhile continuing to faU. Figure 2.5 shows that the global average levelled costs was $315 per MWh for crystalline silicon PV projects in the third quarter of 2009, but this had fallen to $129 per MWh in the first half of 2015, a reduction of 59% in just five and a halfyears. All ofwhich shows that the age of solar energy is coming.
'
~-c---~~.---~
~0~---~---_.-'l .. , !oltNil NH
-~·tii>"Ct
?\1 ·S• nds tor cryst lltM stii(Ort photovol ics Soor<e Sloomberg w Energy Fm.:tm:e
Figure 2.5 Global average levelled cost of electricity for wind and PV, Q3 2009 to Hl 2015, $ Per Month
37
2.2. Technological innovations
2.2.1. Technology categories
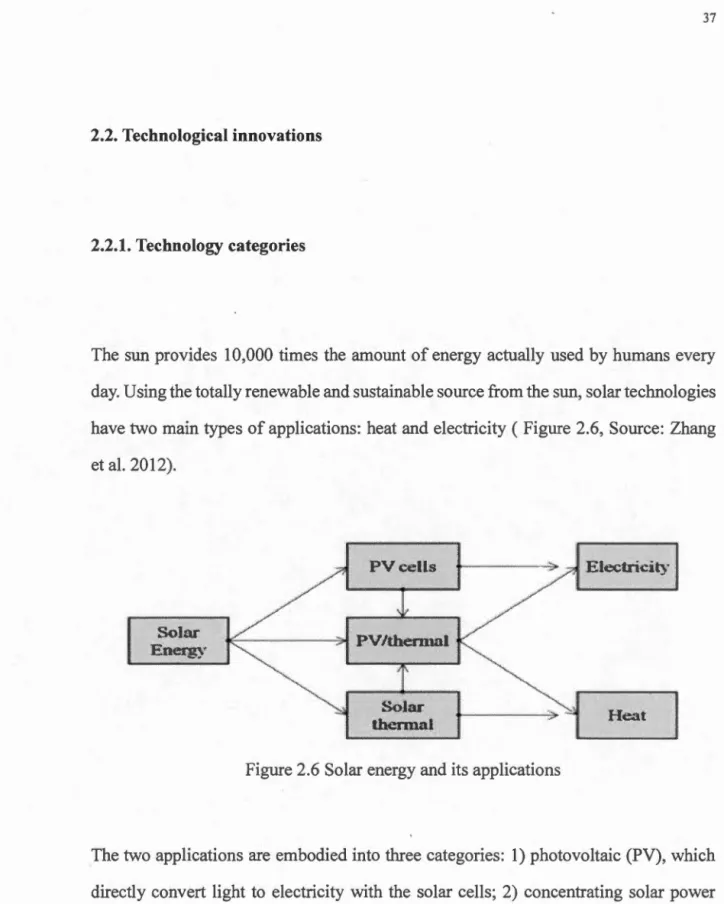
The sun provides 10,000 times the amount of energy actually used by humans every
day. Using the totally renewable and sustainable source from the sun, solar technologies have two main types of applications: heat and electricity ( Figure 2.6, Source: Zhang et al. 2012).
Sol ar Energ)·
thermal
Figure 2.6 Solar energy and its applications
lectricity
He3t
The two applications are embodied into three categories: 1) photovoltaic (PV), which
directly couvert light to electricity with the solar cells; 2) concentrating solar power
(CSP), which uses heat from the sun (thermal energy) to drive utility-scale electric
turbines; 3) heating and cooling systems, which collect thermal energy to provide hot
-water and air conditioning. In this research, only the solar PV sector, the most promising, is studied.
Solar PV cells are at the core of solar energy technologies. Solar cells made of silicon have rapidly become the key component of solar modules (Pari da et al, 2011 ). These cells are specialised semiconductors that convert solar light into electrical energy, with different levels of efficiency. Other elements are less important, but are gaining a more central role in the efficiency of solar equipment. Solar glass is among them. Initially,
conventional glass was used to protect solar panels from damage caused by hail or any falling object. New advanced glass increases the efficiency of solar PV systems.
This science-based set of technologies has enom1ously evolved in its 50-year development2, but just arow1d 2008, innovation began to boom ( 8 & 9). The
development of the sector is quite slow, particularly when compared with
biotechnology and information technology (the evolution of solar cell technology is seen in the Appendix). The reason is partly that solar energy has always had strong competition from other sources of energy (co al, gas, oil, hydro and nuclear, as well as wind among renewable energy sources). The technological development of solar PV
sector be gan to boom sin ce the beginning of the 21 st century due to the strong po licy
support began since 1990s from the different central governments in severa! countries.
2 Although some people associate sol ar panels with new-age technology. scientists have actually been
working with solar cells for nearly 200 years. The evolution of solar panels bas been a slow but
(see Figure 2.7 & 2.8). 14000 +---~-12000 +---~---10000 +---~~---8000 +---~~---6000 4000 2000 +---~~~~---0 +---~---~---~---~---~ 1990 1995 2000 2005 2010 2015 Source: Scopus
Figure 2.7 Solar cell publications in Scopus(1990-2015)
Source: USPTO
Figure 2.8 Solar cell US patents granted by year (1976-2013)
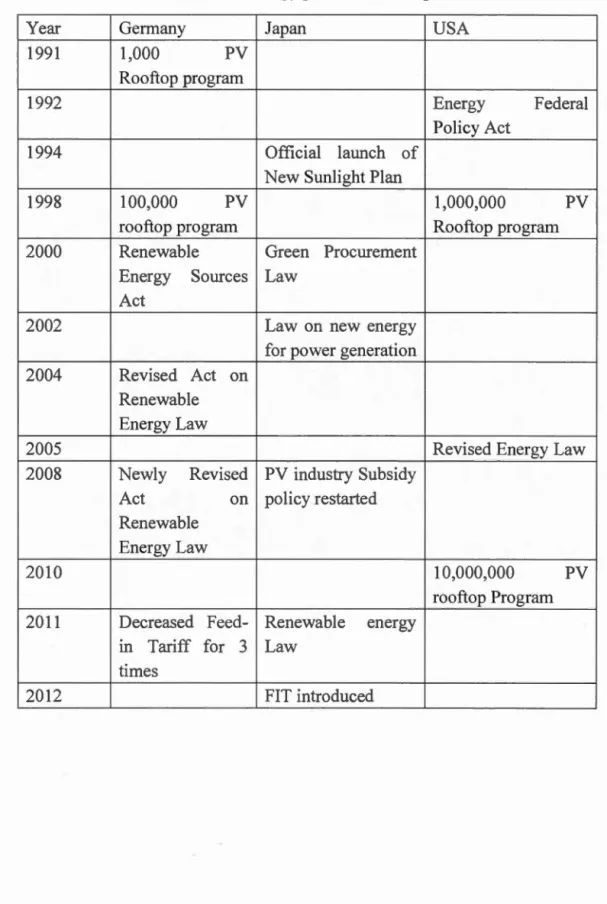
lt is deemed that the science and technological innovation boom from 2000s are due to the strong support ofthe government. (see Table 2.1)
41
Table 2.1 Tirnetable for solar energy policies in the representative countries
Year German y Japan USA
1991 1,000 PV
Rooftop prograrn
1992 Energy Federal
Policy Act
1994 Official launch of
New Sunlight Plan
1998 100,000 PV 1,000,000 PV
rooftop prograrn Rooftop prograrn
2000 Renewable Green Procurernent
Energy Sources Law
Act
2002 Law on new energy
for power generation
2004 Revised Act on
Renewable Energy Law
2005 Revised Energy Law
2008 Newly Revised PV industry Subsidy
Act on policy restarted
Renewable Energy Law
2010 10,000,000 PV
rooftop Prograrn
2011 Decreased Feed- Renewable energy
rn Tariff for 3 Law
times
Currently, there are three generations of technologies in the solar PV sector:
• First generation solar PV cells are made in crystalline silicon. The cells are eut from a silicon ingot, casting, or grown ribbon. So far, this generation dominates the market because of its high conversion efficiency, defined as the percentage of sunlight that is converted into electrical energy, as well as its extensive manufacturing base. Mono-crystalline PV cells today have an efficiency of 16 to almost 20 percent, while the cheaper-to-produce multi-crystalline PV cells achieve a slightly lower 14 to 15 percent efficiency. Crystalline solar PV cells are usually interconnected and encapsulated between a transparent front (typically glass) and insulating back cover material to form a solar PV module, which is usually mounted in an aluminum frame.
• Second generation solar PV cells are referred to as thin film because thin layers of PV materials are deposited on low-cost substrates like glass, stainless steel, or plastic. Their advantage is that they are significantly cheaper to produce, but they have much lower efficiency levels. The oldest and most prevalent thin-film cell technology is "amorphous silicon" with a conversion efficiency of just6 to 7 percent, while hybrid "amorphous/micro-silicon technologies" achieve about 8 percent. Other thin-film technologies, using compound semiconductors, such as germanium (an amorphous silicon thin-film), cadmium telluride (CdTe) or copper iridium di-selenide (CIS), have achieved commercial conversion efficiencies ofup to 11 to 12 percent (Barclays Capital 2009 and IEA PVPS 2009a). These
- - - -- - -
-43
improvements in thin-film efficiencies have led to a very rapid expansion of this segment of solar PV technologies in recent years; their market share has risen from less than 5 percent in 2004 to over 22 percent by 2008.
• The third generation of solar PV teclmologies is not yet being deployed on a large
scale. Work to date suggests there is scope for improving solar cell performance by
exploring approaches capable of giving efficiencies cl oser to thermodynamic limits. Low-dimensional structures seem to show sorne promise due to the small dimensions and new features offered. Common third-generation systems include multi-layer ("tandem") cells made of amorphous silicon or gallium arsenide, while
more theoretical developments include frequency conversion, hot-carrier effects
and other multiple-carrier ejection techniques. Emerging photovoltaic include:
Copper zinc tin sulfide solar cell (CZTS), and derivatives CZTSe and CZTSSe ;
Dye-sensitized solar cell, also known as "Gratzel cell" ; Organic solar cell
Perovskite solar cel! ; Polymer solar cell ; and quantum dot solar cel!.
2.2.2. Measurement of the solar cell efficiency
Energy conversion efficiency is taken as the most important indicator to measure the
teclmology progress. According to Green (2009), over the last two decades, terrestrial
cel! measurements have evolved to the stage where independent laboratories measure the same result for standard silicon ceiis within 1-2%. As a result of early initiatives
by SERI (the US Solar Energy Research Institute, now National Renewable Energy
Laboratory, NREL) that encouraged the development of high efficient silicon cells,
severa! key silicon cell results were measured at NREL in the earl y 1980s,the beginning
of what will be referred to as the 'modem phase' of silicon cell development. So the
calibration of NREL is here employed to show the progress of different categories of solar PV teclmologies (See Figure 2.9).