HAL Id: hal-01520138
https://hal.archives-ouvertes.fr/hal-01520138
Submitted on 9 Jul 2017HAL is a multi-disciplinary open access archive for the deposit and dissemination of sci-entific research documents, whether they are pub-lished or not. The documents may come from teaching and research institutions in France or abroad, or from public or private research centers.
L’archive ouverte pluridisciplinaire HAL, est destinée au dépôt et à la diffusion de documents scientifiques de niveau recherche, publiés ou non, émanant des établissements d’enseignement et de recherche français ou étrangers, des laboratoires publics ou privés.
”You see yourself like in a mirror”: The effects of
internet-mediated personal networks on body image and
eating disorders
Francesca Pallotti, Paola Tubaro, Antonio Casilli, Thomas W. Valente
To cite this version:
Francesca Pallotti, Paola Tubaro, Antonio Casilli, Thomas W. Valente. ”You see yourself like in a mirror”: The effects of internet-mediated personal networks on body image and eating disorders. Health Communication, Taylor & Francis (Routledge), 2018, 33 (9), pp.1166-1176. �10.1080/10410236.2017.1339371�. �hal-01520138�
1 “You see yourself like in a mirror”: The effects of internet-mediated personal networks
on body image and eating disorders1
Francesca Pallottia,b,* Paola Tubaroa,c Antonio A. Casillid,e Thomas W. Valentef
a
University of Greenwich, London (UK)
b
Universita’ della Svizzera Italiana, Lugano (Switzerland)
c
LRI-CNRS, Paris (France)
d
Telecom ParisTech, i3 research center, Paris (France)
e
CEM-IIAC EHESS, Paris (France)
f
University of Southern California, Los Angeles (US)
*
Corresponding author. Department of International Business and Economics, Centre for Business Network Analysis, University of Greenwich. Old Royal Naval College, Park Row, London SE10 9LS (UK). Tel: +44(0)20 8331 7916. E-mail: [email protected]
1 The present article draws on the research project “Ana-Mia sociability: an online/offline social networks
approach to eating disorders” (ANAMIA), supported by Agence Nationale de la Recherche (grant ANR-09-ALIA-001). We acknowledge help from Doctissimo.fr and B-eat, the British Eating Disorders Association, in advertising our survey to participants.
2 Abstract
Body image issues associated with eating disorders involve attitudinal and perceptual components: individuals’ dissatisfaction with body shape or weight, and inability to assess body size correctly. While prior research has mainly explored social pressures produced by the media, fashion, and advertising industries, this paper focuses on the effects of personal networks on body image, particularly in the context of internet communities. We use data collected on a sample of participants to websites on eating disorders, and map their personal networks. We specify and estimate a model for the joint distribution of attitudinal and perceptual components of body image as a function of network-related characteristics and attributional factors. Supported by information gathered through in-depth interviews, the empirical estimates provide evidence that personal networks can be conducive to positive body image development, and that the influence of personal networks varies significantly by body size. We situate our discussion in current debates about the effects of computer-mediated and face-to-face communication networks on eating disorders and related behaviors.
Keywords
3 “You see yourself like in a mirror”: The effects of internet-mediated personal networks on body image and eating disorders
INTRODUCTION
Body image is related to “self-acceptance, social self-confidence, popularity with the opposite sex, assertiveness, athletic ability, and self-understanding” (Hesse-Biber, Clayton-Matthews, and Downey 1987, p. 519), and the development of body image depends on the coherence between self-evaluation of the body, one’s expectations for the physical self, and the perceived evaluations of others (Rosenblum and Lewis 1999).
Disturbances in the way body image is experienced (Benninghoven et al. 2007) may have an attitudinal dimension – i.e., individuals’ dissatisfaction with their perceived body shape or weight – and a perceptual one – i.e., individuals’ inability to correctly assess their own body size (Waldman et al. 2013). Accompanying over-emphasis on body weight in self-evaluation, body image problems typically coexist with eating disorders (Stice and Shaw 2002), and form part of the diagnostic criteria (American Psychiatric Association 2013). Eating disorders such as anorexia nervosa and bulimia nervosa are characterized by extreme behaviors with insufficient or excessive food intake, often accompanied by purging, self-induced vomiting, and problematic exercising affecting both physical and mental health.
From among the multiple factors that can trigger body image disturbances, mass media and fashion are often blamed for socio-cultural idealization of (especially female) thinness. However, their effects are uneven and do not systematically result in dissatisfaction or pathological perceptions (Polivy and Herman 2004). Rather, women’s responses to media images can be mediated by their daily-life contexts and their relationships with others, such as partners, friends, and health professionals (Paquette and Raine 2004). Family expectations
4
and other social contacts in specific communities may attenuate the effects of media pressure (Odoms-Young 2008).
If social relationships in which individuals are embedded affect body image, how do they operate? There is no definitive answer to this question, but the literature on personal networks offers a promising direction of research. Drawing on insight from multiple disciplines including psychology, anthropology, and sociology (Borgatti and Halgin 2011; Butts 2009), researchers in social networks field have come to define the personal network of an individual (“ego”) as an ensemble of ego and ego’s social ties to others (referred to as “alters”), usually also including the ties between alters (Wasserman and Faust 1994). A personal-network approach provides a reliable picture of the relational environment in which ego is embedded, and can illuminate the way relationships channel norms, information, opportunities and constraints for action, thereby moderating the perception and possible internalization of body-type ideals. Other areas of health research (Hawe et al. 2004; Valente and Pitts, 2017) have already used personal network approaches, for example to assess vulnerability to fat-stigma in interpersonal relationships (Brewis, Hruschka and Wutich 2011). While many studies rely just on simple measures (count of alters), others draw on complex indicators such as breadth of relationship types (Ellwardt, Van Tilburg and Aartsen 2014), existence of ties between alters (Reeves et al. 2014), organization of alters into social circles (Tubaro, Casilli and Mounier 2014), reciprocity and shared acquaintances (Valente et al. 2009).
The present paper extends this literature and makes a twofold contribution. Firstly, we bring to bear insight from personal-networks research on the specific issue of body image and eating behaviors, thereby illustrating and strengthening existing evidence that social relationships are one relevant determinant of body image. Specifically, we capture the properties of personal networks through a range of indicators, and show how changes in these
5
indicators correspond to differences in attitudinal and perceptual distortions of body image. The social mechanisms that we uncover substantiate, and make more explicit, the intuition of previous researchers that social ties impinge on body image through social feedback, as the views of others about an individual’s appearance come to influence the individual’s own views, ultimately affecting body image (Costa-i-Font and Jofre-Bonet 2013). We also provide evidence that the relative strength, and significance, of these network effects vary across individuals depending on their body size – a novel result.
Secondly, we explicitly consider computer-mediated socialization and the role of digital social networking sites. In contrast to the traditional personal-networks literature which focused on face-to-face relationships in physical settings such as families, schools, and workplaces, we adopt a broad definition of personal networks that also includes ties formed and maintained through emails, chats, social media such as Facebook, and even the so-called “pro-anorexia” (or “pro-ana”) websites, blogs and forums. By so doing, we align with research that has stressed the seamless integration of online ties into socialization (Haythornthwaite 2000), and specifically account for the deliberate effort of eating-disordered persons to reshape their social networks using the internet. This approach enables us to also revisit the question of the linkages between use of “new” media, body image issues, and disordered eating, brought to the fore after high-profile controversies around “pro-ana” websites (Chang and Bazarova 2016; Knight 2006). While commonly seen as harmful, these websites can also offer help and support to participants, sometimes raising awareness and even facilitating recovery (Casilli et al. 2013; Yeshua-Katz and Martins 2013). Social support in this context may take various forms, including those most classically observed in health contexts: informational support on the illness, its symptoms, and available treatments; emotional support, or empathy and encouragement; companionship support and, to a lesser extent, material (concrete and practical) support (Tubaro and Mounier 2014). Our results
6
contribute to drawing a nuanced picture, indicating that under some conditions, internet socialization may be conducive to positive body image development.
THEORY AND EVIDENCE
The health effects of social integration via personal networks have been widely recognized in the general population. Berkman and Syme’s 1979 pioneering study of Alameda County, California, showed that individuals with no ties to others face higher mortality risk than individuals with many contacts. Researchers have since extended this result to a broad range of health outcomes including people's capacity to cope with stress (Thoits 1995), hypertension (Cornwell and Waite 2012) and suicide attempts (Mueller and Abrutyn 2015). Networks offer the comfort of companionship, channel informational and emotional support, and provide access to resources and material goods (Berkman et al. 2000; Wellman and Frank 2001).
Most early studies used personal network size (i.e., number of alters of an ego) as proxy for social integration, the underlying idea being that larger networks offer more benefits. Recognizing that network size is only a coarse measure of connectedness, recent research tends to collect richer data and to use additional indicators (Smith and Christakis 2008), also including network structure, that is, the pattern of ties between alters in a personal network, and composition, that is, the aggregated attributes of alters. Recent research has used various properties of personal networks to understand their effects on health outcomes. For example, Ellwardt, Van Tilburg and Aartsen (2014) find that elderly persons are likely to obtain more support if they have more contacts (larger size) and that this effect is stronger if such contacts are more diverse (not only children, but also friends, neighbors etc.). This general literature informs our reasoning on the specific case of eating disorders.
7
Network size
Secrecy about food intake, purging practices, and weight loss interferes with the formation of trusting relationships (Stice 2002) and is often associated with social isolation (Levine 2012). However, the advent of social networking services and online communication forums has created new opportunities for socialization, allowing individuals with eating disorders to interact with peers (Casilli et al. 2013). Consequently, the size of personal networks of members of “pro-ana” communities may signal potential support. An individual with a larger network (including online ties) will obtain feedback from many people, and will be able to compare and contrast different views, so that any extreme opinions (e.g., pressure for thinness) will likely offset opposing ones (e.g., encouragement to gain weight after anorexia). We thus expect an association between number of alters and greater availability of useful feedback. Together, these factors can moderate the desire for thinness and correct inaccurate perceptions, leading to our first hypothesis: Network size will be positively associated with smaller
attitudinal and perceptual distortions in body image (H1).
Network structure
Beyond size, inclusion of more complex structural features derived from relations between alters can be useful. One of the most important dimensions of structure is cohesion between alters in the personal network of ego, which can be interpreted in at least two ways. First, it can be the existence of ties between alters, as perceived by ego – what one would conventionally measure as personal network density. Second, it can be the existence of social
circles, or contexts of interpersonal interaction (such as school, workplace, or sports club),
known to ego and shared by two or more alters. Social circles are important as they link forms of sociability and forms of socialization, relating relationships to ego’s life experiences (Bidart and Charbonneau 2011). Sharing a context creates opportunities for, and is the first
8
step towards, the creation of a relationship – a tie is such when it becomes autonomous from the context in which it has first appeared and can survive its disappearance, for example in the case of classmates who remain friends after leaving school (Bidart, Degenne and Grossetti 2011).
Cohesive personal networks are more likely to convey less diverse feedback to ego, as alters will tend to share their views and be more similar to one another (Burt 1987). Further, cohesiveness may put pressure on individuals to conform to commonly accepted norms. In our study, this may involve increased pressure from peers toward standards of beauty and thinness, a greater sense of bodily inadequacy, and a stronger drive for change. This leads us to our second hypothesis: Network cohesiveness will be positively associated with larger
attitudinal and perceptual distortions in body image (H2).
Network composition
Network composition indicators shed light on the aggregate characteristics of alters in a personal network. One dimension is diversity, observed along relevant attributes such as gender, social role relative to ego (e.g., kin, friend, colleague), and channel through which the relationship is maintained (online, face-to-face, or both). In particular, the proportion of same-sex alters in a network captures the degree of homophily in ego's choices. While a more homogeneous network can be perceived as more supportive, a diverse network is more likely to provide the individual with a wide range of viewpoints (Burt 1987), thereby offering more scope for a balanced assessment and correction of any biases.
A second relevant dimension is the strength of a social tie, which Granovetter (1973) defined as a function of its duration, emotional intensity, intimacy, and exchange of services. Strong ties are more likely to increase the amount of social control exerted on ego (Valente
9
and Vlahov 2001), but can also generate social support (Wellman 1979) and provide feedback that helps correct attitudinal or perceptual distortions.
Accordingly, we formulate our third set of hypotheses: Network heterogeneity will be
positively associated with smaller attitudinal and perceptual distortions in body image (H3a); Strength of social ties will be positively associated with smaller attitudinal and perceptual distortions in body image (H3b).
DATA AND METHODS
We use data from our social network study of participants to websites on eating disorders, fielded as a web survey in 2011 – 2012 and completed by 284 English- and French-speaking European respondents (Tubaro, Casilli and Mounier 2014). They represent a relatively large population: about 600,000 people have some eating disorder in France (AFDAS-TCA 2014). However, the fact that many are undiagnosed does not allow drawing precise boundaries, and rules out random sampling. Therefore, we opted for purposive sampling, using a web scraping tool (Navicrawler) to identify and map relevant websites, blogs and forums, and then inviting their administrators and users to participate.
This survey is an ideal basis for this study for two main reasons. First, this population encompasses not only recovering and diagnosed sufferers but also persons with sub-clinical symptoms, who would escape notice in medical study settings. They exhibit a wide range of body shapes and sizes – from severe thinness to obesity – corresponding to diverse body image issues and types of disorders.
Second, this survey collected rich data on the respondent’s broadly defined social environment, including face-to-face and internet-based personal networks. We used a standard “name generator” question that invited participants (egos) to name alters as follows: “These are people whom I have talked to (more than just saying hello) and/or interacted with in the
10
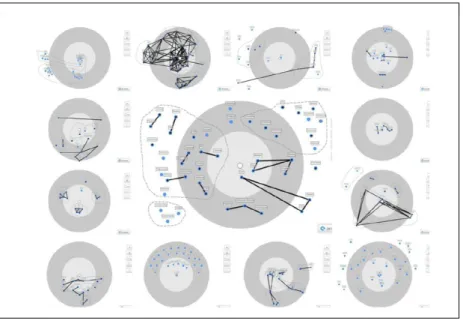
last six months”. This information was elicited through a playful graphical interface (Figure 1), embedded in our online questionnaire, to enable survey participants to draw their personal networks rather than fill lists of alters – a task that could have proven burdensome (Tubaro, Casilli and Mounier 2014). Participants were told: “I am the dot at the center of the target. I shall place the others (blue dots) around me, with those closest to me towards the centre and the others further away.” Each ego filled two such drawings, one for face-to-face ties (“[those] whom I interact with, for example, at school, in the workplace, with my family, or at my leisure centre”) and one for online ties (“[those] whom I interact with, for example, on discussion forums, blogs, email, MSN, and social networks (Facebook, Last.fm etc.)”). If relevant, an alter could be included both in the face-to-face and in the computer-based networks. In either graph, a “name interpreter” question asked for more information on each alter (only gender and type of relationship, to limit respondent burden). Participants were also prompted to draw ties between alters, and/or to group them in circles (Figure 1).
Because our name interpreter was kept to a minimum, we used post-survey in-depth semi-structured interviews to obtain more background information. A subset of respondents (n = 37) who had accepted to be re-contacted were thus interviewed for 50-90 minutes and asked to “tell the story” of alters in their networks. Standard qualitative analysis techniques (both manual and computer-based, with text-analysis software Alceste) helped us code data from the interviews, identify patterns and build overarching themes. We use interview material to aid interpretation of the statistical results obtained from our survey data.
11
Dependent variables: body image
To elicit information on body image, the survey used the Figure Rating Scale (FRS) developed by Albert J. Stunkard and co-authors in 1983, now widely used as self-reported measure (see e.g. Cardinal, Kaciroti and Lumeng 2006). It requires participants to self-rate by choosing a figure from among nine stylized silhouettes ranging from emaciated to corpulent. The scale was criticized for its ordinal and somewhat arbitrary nature, the restricted range of response options it offers, as well as an assumed Caucasian bias in the depiction of body shapes and complexions. However, it has been proven robust and highly correlated with self-reported height and weight in diverse samples (Bulik et al. 2001; Lo et al. 2012).
Specifically in our study, the figure scale was used to assess the complex nature of body image issues through three questions: (1) how respondents describe (D) themselves ("If I had to describe myself, I would say that I look like..."); (2) how respondents would choose (C) to look ("If I could choose, I would like to look as..."); and (3) how respondents think
others (O) see them ("People usually say that I look like..."). On this basis we created three
variables (D, C, and O), each taking integer values ranging from 1 to 9.
These variables are then used to calculate, for each individual in the sample, two discrepancy scores, namely D-C (Described-Chosen body image) and D-O (Described-Other-mediated body image). In line with the literature, and similar to Bulik et al. (2001), the former operationalizes the attitudinal component of body image distortions, that is, weight and shape satisfaction/dissatisfaction; the latter stands for its perceptual component, that is, the inability to correctly assess body size. Zero attitudinal discrepancy (D-C = 0) denotes satisfaction, whereas positive discrepancy (D-C > 0) indicates that perceived body image is heavier than the individual’s desired one, and negative discrepancy (D-C < 0) signals the opposite. Put differently, positive attitudinal discrepancy indicates an aspiration to lose weight, and negative discrepancy indicates an aspiration to gain weight.
12
The two discrepancy scores can theoretically vary between - 8 and + 8, taking only integer values. These scores cannot be taken as mere qualitative categories with no ordering. The literature (for example Cororve Fingeret, Gleaves and Pearson 2004) interprets differences as discrepancy scores to assess the extent of body image dissatisfaction: higher (absolute) scores indicate higher dissatisfaction, and therefore potentially higher health risk. For example, Napolitano and others (2010) studied children with a genetic condition affecting body weight and noticed a significant difference in mean dissatisfaction between males (mean = 3.07) and females (mean = 1.52). Of course, these differences are not continuous variables either, as they are derived from a scale with no direct numerical interpretation. What matters is the order of differences – whether they are smaller or larger – while their specific value is conventional and does not have a meaning per se (except the 0 value). For this reason, we interpret D-C as an ordered variable.
Positive perceptual discrepancies (D-O > 0) indicate that individuals over-estimate their body size compared to the views of others, and conversely, negative perceptual discrepancies indicate that individuals under-estimate their body size compared to others’ views; again, these are ordered categories that are not numerically interpretable, though they are not mere categories either. Zero discrepancy denotes alignment with peers' perceptions, while non-zero perceptual discrepancies mean that respondents are aware of differences between their own and others' judgments, whether or not they accept to revise their views as a result. In the sample, most individuals have positive but small perceptual discrepancies.
Figure 2 plots D-C (left panel) and D-O (right panel) by body-mass index (BMI) category, a widely-used measure computed as weight in kilograms divided by height in meters squared, allowing classification of adults as underweight (BMI < 18.5), normal weight (18.5 <= BMI < 25), and overweight (BMI >= 25) (World Health Organization 1995, 2000). It shows that in an eating-disordered population, body image issues differ depending on BMI
13
levels. If chosen body image (variable C) is always rather low, with most subjects wishing to have a skinny silhouette (usually selected from among the four thinnest, and never from among the three most corpulent), self-description (variable D) is more dispersed. One third of underweight individuals inconsistently chose one of the five most corpulent figurines, while normal-weight and overweight individuals were globally more accurate, mostly selecting (respectively) mid-range and larger silhouettes. As a result, the spread of D-C is larger among underweight individuals, some of whom wish to become much thinner than they believe to be while others conversely wish to gain weight; in contrast, the distribution of D-C is more concentrated for the other two groups (Figure 2, left panel).
Underweight individuals overwhelmingly selected the two thinnest silhouettes as best representations of how others see them (variable O). In this sub-sample, O is always lower than D (and predicts actual BMI better than D), suggesting some awareness of the gap between societal body norms and own assessments. Instead, O slightly under-estimates BMI in normal-weight individuals, some of whom describe themselves as less heavy than others perceive them to be; so do an even higher number of overweight individuals (Figure 2, right panel). Believing to be heavier in the eyes of others than in one’s own may be a sign of stigma associated with weight in our societies (Carr and Friedman 2005), and explains why the spread of D-O increases with BMI level.
[FIGURE 2 ABOUT HERE]
Independent variables: Network size, structure, composition
To test Hypothesis 1, we first consider network size, measured as the count of all unique alters included in each ego-network (whether face-to-face, online, or both). Globally, the size of these networks (15 alters per ego on average) is close to the size of networks elicited with
14
similar methods in previous studies of non-pathological individuals (Tubaro and Mounier 2014); it would be smaller (10 alters per ego) without online networks.
To test Hypothesis 2, we include an indicator of network cohesiveness. A standard indicator would be density, defined as the number of ties (count of the straight black lines in the two ego-networks of an individual, such as those depicted in Figure 1), divided by the number of possible ties (equal to size times size – 1, in that each alter can have at most one tie to each other alter in the personal network of ego). Here, we enrich this measure through data on social circles, i.e., groups of alters sharing some affiliation: we compute an adjusted
density which includes both regular ties and co-affiliations to social circles. Because the latter
can be construed as pre-conditions for the former to arise, we operationalize them as weaker ties, setting their weight operationally at 0.5. Adjusted density can thus be calculated as average strength across both types of ties (just as density in valued networks):
AD = (L + (0.5 * S)) / (0.5 * n * (n - 1))
where n = number of alters in a personal network (size), L = number of ties among them, S = number of their shared affiliations. Adjusted density can be equal to, or higher than, standard density.
Hypothesis 3 calls for the inclusion of network composition indicators. To test Hypothesis 3a, we use variables that capture heterogeneity of network members. To account for communication channel diversity (with and/or without computer mediation), we use Blau's (1977) index of diversity, a measure of categorical diversity among members of a group or network, and calculated as:
1 - (p12 + p22 + ... + pk2)
where alters in a personal network are spread across k qualitatively different categories (here, three: face-to-face, online, and both), and pk indicates the proportion of alters in the kth
15
category) to (k-1)/k (when alters are distributed equally across all categories). We also use Blau's index to account for heterogeneity of alters as defined by their social role with respect to ego. There are eight categories including spouse/partner/significant other, friend, family member, classmate, colleague, teacher, health professional, and the residual category of “other”. Regarding gender, we include two separate variables, the proportion of females in the personal network to account for homophily (as 95% of respondents are females), and gender
heterogeneity (computed as variance) to capture diversity.
To test Hypothesis 3b, we distinguish strong and weak ties by using information on emotional closeness collected through this survey, as respondents were prompted to rank their alters as intimate, very close, close, and not-so-close. The literature recognizes that emotional closeness is the best predictor of tie strength (Marsden and Campbell 1984), even in the absence of details on other classical strength dimensions such as frequency of contact or duration of the relationship. We use a single indicator (proportion of intimate), measured as the ratio of intimate and very close alters (strong ties) relative to the close and not-so-close ones (weak ties). We do not distinguish further between intimate and very close ties, and between close and not-so-close ones, as very few alters are in the first and last categories.
Control variables
To rule out other possible explanations for differences in attitudinal and perceptual body image distortions, we also use information on participants' socio-demographic characteristics, body measures and health status. Among socio-demographic variables, age has a lower bound at 16, imposed by the legal and ethical framework of the study, and reaches 42, with an average of 22. English (vs. French) is a binary indicator variable taking the value of 1 if the survey was administered in English, zero if French. Inclusion of this variable helps us control for sources of unobserved heterogeneity and assess the generalizability of our findings. France
16
and the UK – the two countries where most respondents come from – differ in respect to average BMI for women, both actual and ideal (de saint Pol 2009). So if results hold across these two groups, we have reasons to believe they are consistent and not produced by local or national idiosyncrasies.
Respondents were prompted to declare their current weight and height on the basis of which we calculated their body-mass index (BMI), according to the definition outlined earlier. We use this variable in its category ordinal format to split the sample into three sub-groups (see above). In the model estimated on the full sample, the variable is introduced as a binary indicator taking the value of 1 for individuals who are either over- or underweight, and 0 otherwise (BMI WHO). Notice that 54% of respondents fall in the latter group, a high proportion that is explained by the diverse range of eating disorders, which are not limited to anorexia nervosa and do not always entail extreme weight loss: in our sample, bulimia nervosa was reported by more than 20% of respondents, and Eating Disorders Not Otherwise Specified (EDNOS) account for over 45%. Relative to the general population, underweight is over-represented in our sample (28%), while overweight (18%) is under-represented.
We also use the continuous measure of BMI to define a variable (relative BMI) measuring the gap between each individual’s BMI and the average BMI of the individual’s country of residence (retrieved from the WHO BMI database). This variable, however crude, is meant to account for people’s worry about being fatter than others in their immediate physical surroundings (Blanchflower, Oswald and Van Landeghem 2009). Due to the small size of our sample and its gender homogeneity, we limit the comparison to the country level, without breaking it down to smaller geographical units.
To distinguish attitudes and perceptions that are motivated by health-related concerns and those that are motivated mostly by beauty concerns, the questionnaire invited participants to rate on a scale of one to four the extent to which they are concerned about their
17
appearance. It also included questions about frequency of exercise and sports practice, an
ordered scale from "hardly ever" to "daily". This variable takes into account at the same time the known tendency of eating-disordered individuals to over-exercise (Bratland-Sanda and Sundgot-Borgen 2015) and the pressure on high-level and professional athletes toward weight control (Smolak, Murnen and Ruble 2000). Finally, we include a binary variable indicating whether the individual is undergoing treatment for eating disorders.
For parsimony, we have not included variables that proved to be non-significant in all previous versions of the model (for example socio-economic information such as student or worker status; co-habitation and family structure; and type of eating disorder).
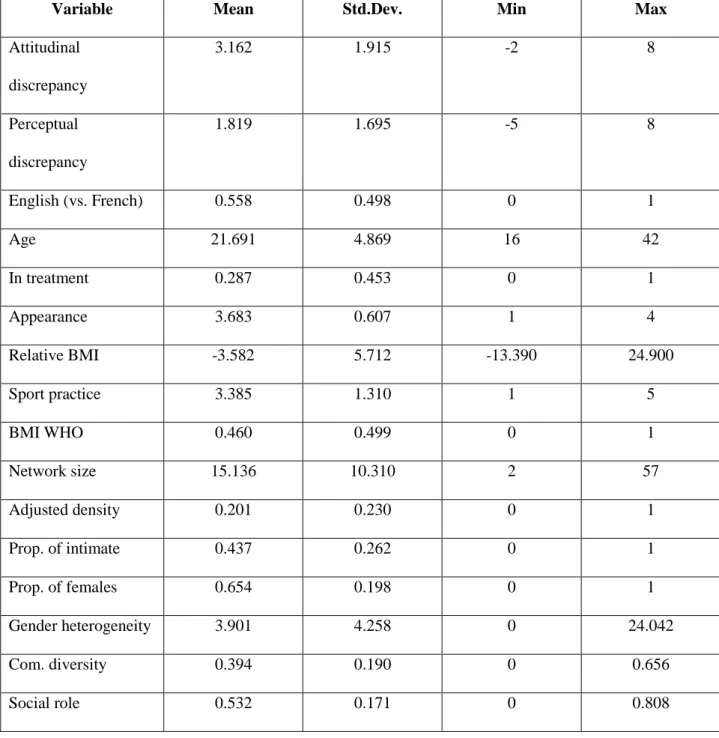
Table 1 provides a descriptive overview of our sample and summarizes essential information on the control variables included in our empirical model specifications.
[TABLE 1 ABOUT HERE]
Analysis
We proceed in two steps. First, we model discrepancies in attitudinal and perceptual body image for the whole sample. Second, we repeat the analysis separately for the three BMI categories of overweight, underweight and normal weight (as defined above), so as to highlight any variations in the determinants of attitudinal and perceptual discrepancies across the weight and body mass spectrum. We distinguish by BMI rather than type of eating disorder because, especially in a non-clinical setting like ours, people may be at different stages of a disorder, so that problematic attitudes and perceptions may coexist with different levels of BMI, including in the “normal” range. Indeed some extant research suggests that body image distortions and influence of social contacts on behaviors may operate differently depending on BMI (Eisenberg et al. 2005).
18
Given the ordered nature of our dependent variables D-C and D-O, we use an ordered discrete choice model (probit). More precisely, taking into account the correlation between the two variables which are both based on D, we use a bivariate ordered probit. This model can be treated as an extension of a standard bivariate probit model where the number of categories of the dependent variables is greater than two. The model estimates the correlated outcomes jointly, with the same set of covariates including individual attributes of ego and personal network (structural and compositional) characteristics. We use the bioprobit Stata program developed by Sajaia (2008). As our three sub-samples consist of a limited number of observations, we apply a stochastic re-sampling procedure based on bootstrapping (Efron 1979) to reduce the possible resulting bias.
RESULTS
Table 2 reports the results of our bivariate ordered probit regression for the whole sample (first column) and for the three BMI-related sub-samples (last three columns). The top panel reports parameter estimates for the effects of the covariates on attitudinal discrepancies (D-C); the bottom panel for perceptual discrepancies (D-O).
[TABLE 2 ABOUT HERE]
Let us first comment on the sign and significance of the estimated regression coefficients. The effect of network size is always negative, as expected (though it is not significant in the case of normal-weight individuals). This corroborates Hypothesis 1 and our expectation that larger personal networks convey more diverse information, so that opposing extreme views cancel out and a more moderate opinion emerges. This effect is driven by individuals in the tails of the BMI distribution, and is particularly strong for those who are underweight, reducing both
19
their attitudinal (D-C) and perceptual (D-O) body image discrepancies. Overweight persons are sensitive to network size insofar as D-C (attitudinal discrepancy) is concerned.
Adjusted density has a positive effect, in line with H2: more cohesive social
environments exacerbate body image discrepancies. Indeed in a dense network of given size, a person’s social contacts interact with one another and mutually reinforce their views, so that they provide less diverse feedback than would be the case in a sparser network, and put ego under greater pressure to conform to bodily norms. However, this is statistically significant only for attitudinal discrepancies in body image (D-C), not for perceptual ones (D-O), and it is not significant for underweight individuals.
Network composition is differentially associated with discrepancies for the three sub-samples, offering some support to H3a and H3b. The qualification of contacts by social role (e.g. family, friends) is not significant; neither is communication diversity, suggesting that there is no major split between online and face-to-face communication, and that social ties have the same effects whether they are kept mainly through physical meetings, digital tools and services, or both – a result that resonates with the view that internet socialization is now an integral part of social life, rather than a separate sphere (Haythornthwaite 2000). Network gender effects are noteworthy, particularly in the case of underweight persons whose discrepancies (both attitudinal and perceptual) in body image decrease with a greater
proportion of females in their personal network, and increase with greater gender heterogeneity. Underweight users of websites on eating disorders seem to benefit most from
gender-homogenous, mostly female personal networks, a result similar to what Wellman and Frank (2001) found for women in general. The same gender heterogeneity effect is also found among the overweight sub-sample, though only for attitudinal discrepancies, while the proportion of females has the opposite sign for the normal-weight group with respect to the perceptual component of body image. Emotional closeness (proportion of intimate) has a
20
weak effect overall, except in the overweight sub-sample, for which it has a strong negative effect on attitudinal discrepancies about body image. Whilst strong ties may provide more help to correct distortions, this is not true at all levels of BMI and here in particular, underweight individuals are not sensitive to their feedback.
Regarding control variables, results show some variation across the English and French sub-samples, the former having larger attitudinal (but not perceptual) discrepancies, an effect driven by the normal-weight group. Larger gaps between individual BMI and average BMI of the country of residence (Relative BMI) result in larger attitudinal discrepancies. This result confirms that inter-personal comparisons matter even at such a general level – comparing oneself with others beyond one's immediate circle of contacts (Blanchflower, Oswald and Van Landeghem 2009). Age has a negative effect, suggesting that older respondents have narrower attitudinal and perceptual gaps. Sport practice has a positive effect on both attitudinal and perceptual discrepancies over body image, presumably resulting from some degree of pressure on athletes (as the effect is driven by normal-weight individuals) and some form of problematic exercising among the underweight (for D-O). Finally, individuals under treatment have larger perceptual and attitudinal discrepancies, an indication that those with the largest gaps are those who seek, or are in, treatment: amongst our population, eating
disorders are not normalized.
Predicted probabilities
Table 2 is not informative of the magnitude of the effects because probit regression coefficients have no direct numerical interpretation; but we can use it to derive the predicted probabilities of given outcomes, and assess how much they change if a covariate changes. Table 3 reports the predicted probabilities of the D-C outcomes that are most common amongst, respectively, the underweight and the overweight sub-samples. We focus only on
21
these illustrative examples because predicted probabilities are not constant across all values of a variable, and cannot be explored exhaustively.
[TABLE 3 ABOUT HERE]
For example, an underweight individual has 21.2% probability of having D-C equal to 1 (small attitudinal discrepancy). We know from Table 2 that network size has a negative effect on D-C: indeed, Table 3 shows that a 10% increase in network size corresponds to a 0.15% decrease in the probability of D-C=1. Put differently, this outcome becomes slightly less likely to occur. The effect of the same size change is not the same across D-C values: in particular, the predicted probability of D-C=3 (medium attitudinal discrepancy), initially at 23.3%, drops by a much larger amount (-0.94%). An increase in network size, therefore, reduces the probability of observing larger values, relative to smaller values, of the attitudinal discrepancy indicator D-C. In other words, larger networks benefit underweight individuals, diminishing their chances of having larger attitudinal discrepancies.
From Table 2, we also know that gender heterogeneity has a positive effect on D-C for the underweight, and Table 3 indicates that if this variable grows by 10%, it counters the effect of a parallel 10% rise in network size: it amplifies the drop in the probability of D-C=1 (from 0.15% to 0.44%) while it shrinks the diminution in the probability of DC=3 (from -0.94% to -0.51%). Relative to its initial state, the relative ratio between the probability of lower D-C and the probability of higher D-C, changes little. Underweight persons are less able to benefit from larger networks if these networks are more diverse in terms of gender.
Table 2 shows that the coefficients of network size and gender heterogeneity have the same sign for underweight and overweight individuals, but Table 3 indicates that the latter react differently, notably because they are more likely to have higher attitudinal discrepancies. In particular, a 10% increase in their network size will reduce the probability of observing
22
medium attitudinal discrepancies (D-C=3) by a relatively large amount, while the probability of D-C=2 decreases less, and after a certain threshold, the effect may even turn positive: the probability of D-C=5 increases by 1.07%. A simultaneous 10% rise in gender heterogeneity attenuates these effects, without reversing them. Globally, higher values of D-C become more likely than smaller and medium values, suggesting that overweight persons are less able to draw on the more abundant feedback that a larger network might provide, to reduce their attitudinal discrepancies, especially when these discrepancies are already relatively high.
Robustness checks
To strengthen inference we have conducted extensive robustness checks, re-estimating the model with: a) exclusion of the 16 individuals with negative values in their attitudinal (D-C) and/or perceptual (D-O) body image gaps; b) exclusion of males – representing only 6% of the sample; c) use of different values of adjusted density, computed using different weights (i.e., 0.1, 0.25, 0.75, and 1); d) replacement of the variables representing the compositional diversity of the personal networks through the Blau index with variables computed using the Brillouin index, an alternative indicator of diversity; e) inclusion of squared BMI to check for any non-linearity. All these supplementary analyses support the results outlined above.
DISCUSSION
Social network theory and analysis has been applied to almost every area of health research (Valente and Pitts 2017), and we further extend its scope by exploring the effects of personal networks on body image and weight-related behaviors in persons with eating disorders. Two main results stand out from the quantitative analysis: that social ties affect body image distortions, and that their effect varies with BMI, noting in particular that high-BMI individuals are less able to benefit from their social networks to mitigate their body
23
image issues. To better understand the social mechanisms through which such effects operate, we rely now on our in-depth interviews for qualitative insight. In particular, participants’ own words confirm our supposition that it is through information and feedback received from peers that social ties operate on body image:
When you read other people, you see yourself like in a mirror and... you see what the illness involves (Resp. 12, French, BMI = 18.2).
On the forum… it's a bit like writing a diary, but with readers… readers and answers. Sometimes relevant answers... that suggest new directions (Resp. 65, French, BMI = 21).
While feedback can be received from all alters, the above quotations focus specifically on online ties and stress the importance of the internet for eating-disordered persons in their effort to form, maintain and manage their relationships. Against insistence on the risks of “pro-ana” websites in the press, our results suggest instead that opportunities for socialization arising online may help correct body image issues.
Such effects, as we saw above, tend to be more beneficial for underweight than for overweight persons. While public discourse emphasizes the risks of excessive thinness, ironically it is precisely those concerned that get most attention and help from others – including not only family and friends but also, at times, health professionals:
I feel like I was taken more seriously when, I mean, my weight dropped ... When I was normal weight, there was actually a nurse who said to me that they didn't think it was an eating disorder (Resp. 607, English, BMI = 29.6).
If overweight persons with eating disorders face particular difficulties, interviews suggest it is because of social norms valuing thinness and emphasis on “anti-obesity” measures in public policy, endorsed by their social surroundings and reflected in a greater sense of inadequacy:
24
You feel rejected because, beyond a certain weight, you cannot wear what you want … The others are perfect... When they go to a shop, they immediately find their size of trousers, dresses… and the clothes fit them wonderfully, while when I buy the same, one size larger, it doesn’t give the same result (Resp. 123, French, BMI = 29.7).
Focus on anorexia nervosa and extreme thinness in public discourse may lead to misinterpretation of the condition of overweight eating-disordered persons:
Binge eating is … I’ve had this for eight years but it was only five years ago that it was recognized .... Everybody blamed lack of will ... but it's not lack of will, it's more like bulimia .... But when I told my GP ‘I have bulimia’, he didn’t take me seriously (Resp. 103, French, BMI = 36.9).
CONCLUSION
Existing literature on body image has highlighted the relevance of several factors in the development of self-perception. Yet one specific aspect, the social networks of individuals, has largely been overlooked in previous empirical research on body image. In this paper we aim to fill this gap by placing emphasis on the role of personal networks, without any pretension to make it the only factor responsible for body image outcomes. Rather, we endeavor to demonstrate the importance of adding a personal network perspective to the combination of factors affecting body image outcomes, be they negative or positive.
We show that individuals’ concerns about their weight and appearance are significantly influenced by both their computer-mediated and face-to-face social networks, and that this influence varies by body mass index.
This result transposes insight from other areas of health research (Valente and Pitts 2017) to the field of body image studies. In line with much extant health-related network research, we confirm that network size matters, as larger networks may provide individuals
25
with more feedback. This result is encouraging under two respects: firstly, it facilitates future research, because size is the measure that is the easiest to collect and compute on a personal network. With restricted resources, or a difficult target population, researchers may still afford a social networks dimension by including size in their analytical method. Secondly, the importance of just larger networks suggests simple health interventions, aiming at increasing contacts, for example through events or matching initiatives. Charities and health organizations may find such actions relatively easy to implement and monitor.
We also show that the structure and composition of personal networks may affect body image outcomes, sometimes going as far as to offset the benefits of a larger size. We thus confirm the importance of further exploring the combined effects of different network characteristics, as researchers are now advocating (Smith and Christakis 2008).
We find that the varied ways in which properties of personal networks jointly affect body image outcomes largely depend on BMI, and that in particular, underweight and overweight persons with eating disorders react differently to similar characteristics of their personal networks. Our results point to the specific problems that overweight individuals might experience, as a result of their eating disorder itself, and more generally of fat stigma. Future research and clinical practice will need to better understand the social and psychological issues that arise with eating disorders that lead to excessive weight, and to identify possible supportive responses.
Whilst we have taken a comprehensive definition of social networks, encompassing both computer-mediated and face-to-face ties, we have devoted particular attention to internet networks, particularly in light of controversies around “pro-ana” websites and self-styled communities of persons with eating disorders. Our results do not characterize these online spaces as neatly separate from other contexts of socialization, and do not support the view, sometimes echoed in the media, that they might exacerbate the illness. Healthcare providers
26
and professional associations may exploit these opportunities and create appropriate, controlled online environments to foster socialization.
Our research is not without limitations, notably lack of probabilistic sampling, small size of the sample, and cross-section design of the study. The first two entail potential for bias, while the third implies that firm conclusions about the direction of causality cannot be drawn, and that the reported relationships among variables must be interpreted with caution. Whilst we are aware of these issues, we believe our study leverages the best available analytical tools to reach this sensitive and partly hidden population, and to derive results that may still illuminate public policy. If future replications of the study find ways to enlarge the sample or include a time dimension, they will shed further light on the generality of our findings.
27 REFERENCES
AFDAS-TCA (2014). Et si on arrêtait le gâchis? Report of the French association of eating disorders professionals, consulted on 5 February 2015, URL: http://www.anorexieboulimie-afdas.fr/rss-feed/290-et-si-on-arretait-le-gachis.
American Psychiatric Association (2013). Diagnostic and Statistical Manual of Mental Disorders, fifth edition (DSM-5). Arlington, VA: American Psychiatric Publishing.
Benninghoven, D., Raykowski, L., Solzbacher, S., Kunzendorf, S., & Jantschek, G. (2007). Body images of patients with anorexia nervosa, bulimia nervosa and female control subjects: A comparison with male ideals of female attractiveness. Body Image, 4, 51-59.
Berkman, L.F., Glass, T., Brissette, I., & Seeman, T.E. (2000). From social integration to health: Durkheim in the new millennium. Social Science and Medicine, 51, 843–857.
Berkman, L.F., & Syme, S. (1979). Social networks, host resistance, and mortality: A nine-year follow-up of Alameda County residents. American Journal of Epidemiology, 109, 186-204. Bidart, C., & Charbonneau, J. (2011). How to generate personal networks: Issues and tools for a
sociological perspective. Field Methods, 23, 266-286.
Bidart, C., Degenne, A., & Grossetti, M. (2011). La vie en réseau. Dynamique des relations sociales. Paris: Presses Universitaires de France.
Blanchflower, D.G., Oswald, A.J., & Van Landeghem, B. (2009). Imitative obesity and relative utility. Journal of the European Economic Association, 7, 528-538.
Blau, P.M. (1977). Inequality and Heterogeneity: A Primitive Theory of Social Structure. New York, NY: Free Press.
Borgatti, S.P., & Halgin, D.S. (2011). On network theory. Organization Science, 22, 1168- 1181. Bratland-Sanda, S., & Sundgot-Borgen, J. (2015). “I'm concerned – what do I do?” Recognition and
management of disordered eating in fitness center settings. International Journal of Eating Disorders, 48, 415–423.
Brewis, A.A., Hruschka, D.J., & Wutich A. (2011). Vulnerability to fat-stigma in women's everyday relationships. Social Science and Medicine, 73, 491-497.
Bulik, C.M., Wade, T.D., Heath, A.C., Martin, N.G., Stunkard, A.J., & Eaves, L.J. (2001). Relating body mass index to figural stimuli: population-based normative data for Caucasians. International Journal of Obesity, 25, 1517-1524.
28 Burt, R.S. (1987). Social contagion and innovation: Cohesion versus structural equivalence. American
Journal of Sociology, 92, 1287-1335.
Butts, C.T. (2009). Revisiting the foundations of network analysis. Science, 325, 414-416.
Cardinal, T.M., Kaciroti, N., & Lumeng, J.C. (2006). The figure rating scale as an index of weight status of women on videotape. Obesity, 14, 2132-2135.
Carr, D., & Friedman, M.A. (2005). Is obesity stigmatizing? Body weight, perceived discrimination, and psychological well-being in the United States. Journal of Health and Social Behavior, 46, 244-259.
Casilli, A.A., Mounier, L., Pailler, F., & Tubaro, P. (2013). Les jeunes et le web des troubles alimentaires: dépasser la notion de ‘pro-ana’. Report of the research project ANAMIA (ANR-09-ALIA-001). URL: http://www.anamia.fr/rapport-les-jeunes-et-le-web-des- troubles-alimentaires-depasser-la-notion-de-pro-ana/.
Chang, P.F., & Bazarova, N.N. (2016). Managing stigma: Disclosure-Response communication patterns in pro-anorexic websites. Health Communication, 31, 217- 229.
Cornwell, E.Y., & Waite, L.J. (2012). Social network resources and management of hypertension. Journal of Health and Social Behavior, 53, 215-231.
Costa-i-Font, J., & Jofre-Bonet, M. (2013) Anorexia, body image and peer effects: Evidence from a sample of European women. Economica, 80, 44-64.
de Saint Pol, T. (2009). Surpoids, normes et jugements en matière de poids: Comparaisons européennes. Populations et Sociétés, n. 455.
Efron, B. (1979). Bootstrap methods: Another look at the Jackknife. The Annals of Statistics, 7, 1-26. Eisenberg, M.E., Neumark-Sztainer, D., Story, M., & Perry, C. (2005). The role of social norms and
friends’ influences on unhealthy weight-control behaviors among adolescent girls. Social Science and Medicine, 60, 1165-1173.
Ellwardt, L., Van Tilburg, T., & Aartsen, M. (2014). The mix matters: complex personal networks relate to higher cognitive functioning in old age. Social Science and Medicine, 125, 107-115. Fingeret, M.C., Gleaves, D.H., & Pearson, C.A. (2004). On the methodology of body image
assessment: The use of figural rating scales to evaluate body dissatisfaction and the ideal body standards of women. Body Image, 2, 207-212.
Granovetter, M.S. (1973). The strength of weak ties. American Journal of Sociology, 78, 1360– 1380. Haythornthwaite, C. (2000). Online personal networks size, composition and media use among
29 Hawe, P., Webster, C., & Shiell, A. (2004). A glossary of terms navigating the field of social network
analysis. Journal Epidemiological Community Health, 58, 971-975.
Hesse-Biber, S., Clayton-Matthews, A., & Downey, J.A. (1987). The differential importance of weight and body image among college men and women. Genetic, social, and general psychology monographs.
Knight Lapinski, M. (2006). StarvingforPerfect.com: A theoretically based content analysis of pro-eating disorder Web Sites. Health Communication, 20, 243-253.
Levine, M.P. (2012). Loneliness and eating disorders. The Journal of Psychology, 146, 243-257. Lo, W.S., Ho, S.Y., Mak, K.K., & Lam, T.H. (2012). The use of Stunkard’s Figure Rating Scale to
identify underweight and overweight in Chinese adolescents. PLOS One 7(11), e50017. Marsden, P.V., & Campbell, K.E. (1984). Measuring tie-strength. Social Forces, 63, 482-501.
Mueller, A.S., & Abrutyn, S. (2015). Suicidal disclosures among friends: Using social network data to understand suicide contagion. Journal of Health and Social Behavior, 56, 131- 148.
Napolitano, D.A., Zarcone, J., Nielsen, S., Wang, H., & Caliendo, J.M. (2010). Perceptions of body image by persons with Prader-Willi syndrome and their parents. American Journal on Intellectual and Developmental Disabilities, 115, 43-53.
Odoms-Young, A. (2008). Factors that influence body image representations of black Muslim women. Social Science and Medicine, 66, 2573-2584.
Paquette, M.C., & Raine, K. (2004). Sociocultural context of women's body image. Social Science and Medicine, 59, 1047-1058.
Polivy, J., & Herman, P. (2004). Sociocultural idealization of thin female body shapes: An introduction to the special issue on body image and eating disorders. Journal of Social and Clinical Psychology, 23, 1-6.
Reeves, D., Blickem, C., Vassilev, I., Brooks, H., Kennedy, A., Richardson, G., & Rogers, A. (2014). The contribution of social networks to the health and self-management of patients with long-term conditions: A longitudinal study. PLOS One 9(6), e98340.
Rosenblum, G.D., & Lewis, M. (1999). The relations among body image, physical attractiveness and body mass in adolescence. Child Development, 70, 50-64.
Sajaia, Z. (2008). BIOPROBIT: Stata module for bivariate ordered Probit regression, Statistical Software Components S456920, Boston College Department of Economics.
Smith, K.P., & Christakis, N.A. (2008). Social networks and health. Annual Review of Sociology, 34, 405-429.
30 Smolak, L., Murnen, S.K., & Ruble, A.E. (2000). Female athletes and eating problems: A meta-
analysis. International Journal of Eating Disorders, 27, 371-380.
Stice, E. (2002). Risk and maintenance factors for eating pathology: A meta-analytic review. Psychological Bulletin, 128, 825-848.
Stice, E., & Shaw, H.E. (2002). Role of body dissatisfaction in the onset and maintenance of eating pathology: A synthesis of research findings. Journal of Psychosomatic Research, 53, 985-993. Stunkard, A.J., Sorensen, T.I., & Schulsinger, F. (1983). Use of the Danish Adoption Register for the
Study of Obesity and Thinness. New York: Raven Press.
Thoits, P.A. (1995). Stress, coping and social support processes: Where are we? What next? Journal of Health and Social Behavior (Extra Issue), 53-79.
Tubaro, P., Casilli, A.A., & Mounier, L. (2014). Eliciting personal network data in web surveys through participant-generated sociograms. Field Methods, 26, 107-125.
Tubaro, P., & Mounier, L. (2014). Sociability and support in online eating disorder communities: Evidence from personal networks. Network Science, 2, 1-25.
Valente, T.W., Fujimoto, K., Chou, C.P., & Spruijt-Metz, D. (2009). Adolescent affiliations and adiposity: a social network analysis of friendships and obesity. Journal of Adolescent Health, 45, 202-204.
Valente, T.W., & Pitts, S.R. (2017). An appraisal of social network theory and analysis as applied to public health: Challenges and opportunities. Annual Review of Public Health, 38, 4.1–4.16. Valente, T.W., & Vlahov, D. (2001). Selective risk taking among needle exchange participants in
Baltimore: Implications for supplemental interventions. American Journal of Public Health, 91, 406-411.
Waldman, A., Loomes, R., Mountford, V.A., & Tchanturia, K. (2013). Attitudinal and perceptual factors in body image distortion: an exploratory study in patients with anorexia nervosa. Journal of Eating Disorders, 1, 1-17.
Wasserman, S., & Faust, K. (1994). Social network analysis: Methods and applications. Cambridge: Cambridge University Press.
Wellman, B. (1979). The community question: The intimate networks of East Yorkers. American Journal of Sociology, 84, 1201–31.
Wellman, B., & Frank, K. (2001). Network capital in a multi-level world: Getting support from personal communities. In N. Lin, R. Burt, & K. Cook (Eds.), Social capital: Theory and research (pp. 233-274), New York: Aldine de Gruyter.
31 World Health Organization (1995). Physical status: The use and interpretation of anthropometry. Report of a WHO Expert Committee. WHO Technical Report Series 854. Geneva, World Health Organization.
World Health Organization (2000). Obesity: Preventing and managing the global epidemic. Report of a WHO Consultation. WHO Technical Report Series 894. Geneva, World Health Organization.
Yeshua-Katz, D., & Martins, N. (2013). Communicating stigma: The pro-ana paradox. Health Communication, 28, 499-508.
32
Figure 1 : Examples of networks drawn by survey participants. In each of them, the central white point is ego, bleu points around it represent alters, straight black lines are ties between alters, and dotted grey lines delimit social circles; distance of an alter from ego captures relational proximity.
Figure 2: Scatterplot of attitudinal discrepancies, D-C (left panel) and perceptual discrepancies, D-O (right panel) in body image as a function of BMI, distinguishing individuals who are underweight (BMI < 18.5), normal weight (18.5<= BMI < 25) and overweight (BMI >=25). The size of each marker is proportional to the number of cases concerned.
33
Table 1: Sample characteristics (N = 265). The number of study subjects is lower than the original sample population due to missing items for network-related variables.
Variable Mean Std.Dev. Min Max
Attitudinal discrepancy 3.162 1.915 -2 8 Perceptual discrepancy 1.819 1.695 -5 8 English (vs. French) 0.558 0.498 0 1 Age 21.691 4.869 16 42 In treatment 0.287 0.453 0 1 Appearance 3.683 0.607 1 4 Relative BMI -3.582 5.712 -13.390 24.900 Sport practice 3.385 1.310 1 5 BMI WHO 0.460 0.499 0 1 Network size 15.136 10.310 2 57 Adjusted density 0.201 0.230 0 1 Prop. of intimate 0.437 0.262 0 1 Prop. of females 0.654 0.198 0 1 Gender heterogeneity 3.901 4.258 0 24.042 Com. diversity 0.394 0.190 0 0.656 Social role 0.532 0.171 0 0.808
34
Table 2: Estimates of bivariate ordered probit models for attitudinal discrepancy D-C (top panel) and perceptual discrepancy D-O (bottom panel) for the whole sample (first column) and three sub-samples including, respectively, underweight, normal and overweight individuals (second, third and last column). All the variables are centered on their means.
N=265 ALL UNDERWEIGHT NORMAL OVERWEIGHT
Attitudinal Discrepancy (D-C) Individual (ego’s) attributes English (vs. French) 0.296* -0.076 0.502* -0.230 Age -0.041** -0.070* -0.050** 0.013 Treatment 0.343* 0.817** 0.196 1.388*** Appearance 0.032 -0.010 0.057 -0.049 Relative BMI 0.077*** 0.129 0.051 0.085* Sports practice 0.097* 0.123 0.148* -0.095 BMI WHO -0.281* Personal network characteristics Network size -0.012 -0.053** 0.008 -0.119*** Adjusted density 1.054*** 0.999 1.051* 1.946** Prop. of intimate -0.361 -0.824 0.197 -2.189*** Prop. of females -0.129 -1.663* 0.350 -0.831 Gender heterogeneity 0.029 0.095* 0.011 0.126* Com. diversity -0.211 -0.004 -0.052 -0.416 Social role -0.017 -0.686 0.041 1.614
35 Perceptual Discrepancy (D-O)
Individual (ego’s) attributes English (vs. French) 0.106 -0.475 -0.062 0.420 Age -0.035* -0.081** -0.034 -0.023 Treatment 0.320* 0.703* 0.257 0.447 Appearance 0.024 0.083 -0.007 0.166 Relative BMI -0.014 0.013 -0.143** 0.030 Sports practice 0.172** 0.173* 0.251*** -0.117 BMI WHO 0.169 Personal network characteristics Network size -0.006 -0.038* 0.008 -0.033 Adjusted density 0.244 0.571 0.592 -0.213 Prop. of intimate -0.155 0.204 0.270 -1.122 Prop. of females 0.028 -2.258** 1.252** -1.726 Gender heterogeneity 0.018 0.096* -0.012 0.045 Com. diversity -0.342 -0.363 0.323 -0.674 Social role -0.022 -0.805 0.102 1.523 N 265 73 143 49 LR-test of Independent Equations [chi2(1)] 102.69*** 85.43*** 100.76*** 3.890* Log likelihood -873.648 -215.551 -411.519 -158.222 Wald chi2 [prob>chi2] 65.49*** 35.94*** 36.17*** 52.27*** legend: * p<.05; ** p<.01; *** p<.001
36
Table 3: Predicted probabilities of most common values of D-C, for the underweight sample (top panel) and the underweight (bottom sample). The model estimates that the probability of D-C=1 for an underweight individual is 21.2%; this probability declines by 0.15% if network size increases by 10%, and declines by 0.44% if both network size and gender heterogeneity increase by 10%.
Outcome
Predicted probability
Percent change after 10% increase in network size
Percent change after 10% increase in both network size and gender heterogeneity Und er we ig h t D-C=1 21.2% -0.15% -0.44% D-C=2 16% -0.87% -0.73% D-C=3 23.3% -0.94% -0.5% O v er we ig h t D-C=3 19.8% -2.38% -1.8% D-C=4 21.5% -1.06% -0.62% D-C=5 16.6% +1.07% +0.92%