HAL Id: hal-01553607
https://hal-mines-paristech.archives-ouvertes.fr/hal-01553607
Submitted on 17 Jul 2017HAL is a multi-disciplinary open access archive for the deposit and dissemination of sci-entific research documents, whether they are pub-lished or not. The documents may come from teaching and research institutions in France or abroad, or from public or private research centers.
L’archive ouverte pluridisciplinaire HAL, est destinée au dépôt et à la diffusion de documents scientifiques de niveau recherche, publiés ou non, émanant des établissements d’enseignement et de recherche français ou étrangers, des laboratoires publics ou privés.
Validation of spatially resolved all sky imager derived
DNI nowcasts
Pascal Kuhn, Stefan Wilbert, David Schüler, Christoph Prahl, Thomas Haase,
Lourdes Ramírez, Luis Zarzalejo, Angela Meyer, Laurent Vuilleumier,
Philippe Blanc, et al.
To cite this version:
Pascal Kuhn, Stefan Wilbert, David Schüler, Christoph Prahl, Thomas Haase, et al.. Validation of spatially resolved all sky imager derived DNI nowcasts. AIP Conference Proceedings, American Institute of Physics, 2017, SOLARPACES 2016: International Conference on Concentrating Solar Power and Chemical Energy Systems, 1850 (1), pp.140014. �10.1063/1.4984522�. �hal-01553607�
Validation of Spatially Resolved All Sky Imager Derived
DNI Nowcasts
Pascal Kuhn
1,a), Stefan Wilbert
2, David Schüler
2, Christoph Prahl
2, Thomas Haase
2,
Lourdes Ramirez
3, Luis Zarzalejo
3, Angela Meyer
4, Laurent Vuilleumier
4, Philippe
Blanc
5, Jean Dubrana
5, Andreas Kazantzidis
6, Marion Schroedter-Homscheidt
7,
Tobias Hirsch
8, Robert Pitz-Paal
91Researcher, M.Sc. Physics, German Aerospace Center (DLR), Institute of Solar Research, Plataforma de Almería,
Ctra. de Senés s/n km 4, 04200 Tabernas, Spain, +34 950611743.
2German Aerospace Center (DLR), Institute of Solar Research, Plataforma de Almería, Ctra. de Senés s/n, 04200
Tabernas, Spain.
3 CIEMAT. Energy Department – Renewable Energy Division. Av. Complutense, 40, 28040 Madrid, Spain. 4MeteoSwiss, Les Invuardes, 1530 Payerne, Switzerland.
5 MINES ParisTech, PSL Research University, O. I. E. – Centre Observation, Impacts, Energy, CS 10207, F-06904,
Sophia Antipolis CEDEX, France.
6 Laboratory of Atmospheric Physics, Department of Physics, University of Patras, 26500 Patras, Greece. 7German Remote Sensing Data Center (DFD), German Aerospace Center (DLR), Oberpfaffenhofen, 82234
Weßling, Germany.
8German Aerospace Center (DLR), Institute of Solar Research, Wankelstrasse 5, 70563 Stuttgart, Germany. 9German Aerospace Center (DLR), Institute of Solar Research, Linder Höhe, 51147 Cologne, Germany.
a)Corresponding author: [email protected]
Abstract. Mainly due to clouds, Direct Normal Irradiance (DNI) displays short-term local variabilities affecting the
efficiency of concentrating solar power (CSP) plants. To enable efficient plant operation, DNI nowcasts in high spatial and temporal resolutions for 15 to 30 minutes ahead are required. Ground-based All Sky Imagers (ASI) can be used to detect, track and predict 3D positions of clouds possibly shading the plant. The accuracy and reliability of these ASI-derived DNI nowcasts must be known to allow its application in solar power plants. Within the framework of the European project DNICast, an ASI-based nowcasting system was developed and implemented at the Plataforma Solar de Almería (PSA). Its validation methodology and validation results are presented in this work. The nowcasting system outperforms persistence forecasts for volatile irradiance situations.
INTRODUCTION
Solar irradiance on earth’s surface presents large temporal and spatial variabilities affecting the reliability of solar power plants. For timescales below 60 minutes, this variability is mainly caused by clouds. To enable profit-yielding operation and to avoid blackouts, irradiance forecasts with high spatial and temporal resolutions (e.g. 25 m2,
60 seconds) for the next 30 minutes are required [1]. These real-time and high-resolution forecasts with the specified forecasts horizons are called nowcasts. Due to technical limitations, neither numerical weather predictions nor satellite forecasts can provide this information, but only ground-based All Sky Imagers (ASI).
Within the framework of the European project “Direct Normal Irradiance Nowcasting methods for optimized operation of concentrating solar technologies”, different approaches to achieve nowcasts are investigated at PSA [2, 3]. Located in the Tabernas Desert in the south of Spain, the PSA is a research center focusing on solar thermal technologies. Scientists from CIEMAT (Centro de Investigaciones Energéticas, Medioambientales y Tecnológicas) and DLR (German Aerospace Center) operate several meteorological measurement stations including ASI cameras, radiometers and a shadow camera system.
This paper introduces the validation methodology and the benchmarking framework, which can be used to benchmark and compare different nowcasting approaches. This way, the optimum nowcasting configuration can be determined. The validation is conducted for an example nowcasting data set provided by Patras University and MINES ParisTech, which is presented in [3].
BENCHMARKING FRAMEWORK AND METHODOLOGY
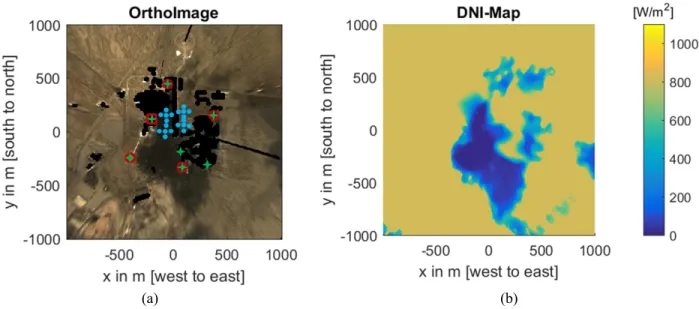
For the validation of the ASI-derived DNI maps, twenty pyranometers, seven pyrheliometers and a shadow camera system are available to derive reference data. Six shadow cameras take photos of the ground from the top of an 87 m high solar tower (CESA1). Six concurrent images are combined to one so-called orthoimage, which is a geometrically corrected image (Fig. 1a).
Using the orthoimage of the investigated timestamp and two reference orthoimages, taken when no shadow fell on the PSA and when the PSA was completely shaded, as well as corresponding DNI measurements, a spatially resolved DNI map is calculated. In addition to DNI values, the reference system is able to calculate global horizontal irradiance (GHI) and global tilted irradiance (GTI) reference irradiance maps.
(a) (b)
FIGURE 1. (a) Instrument setup at PSA. Black pixels are excluded from the evaluation. Red circles indicate the position of the
ASIs. The red square is at the position of all six shadow cameras. The green stars represent two-axis trackers with pyrheliometers and pyranometers. The blue circles mark Si-pyranometers. (b) Reference DNI map generated from the image on the left,
reference images and ground data.
An example of an orthoimage for Sept. 19th 2015, 12:57 UTC+1, is shown in Fig. 1a. Shadows are clearly
visible. The positions of the radiometers and cameras are marked. The derived reference DNI map for this timestamp is shown in Fig. 1b.
The benchmarking is conducted with nowcasts provided by the system presented in [3]. The configuration of this nowcasting system consists of two ASI cameras and one radiometer station (southernmost in Fig. 1a). A detailed validation of the reference system is given in [4] and preparatory works regarding the reference system are presented in [5]. In this paper, the focus lays on the methodology to validate and benchmark nowcasting systems. The results presented here are derived from selected days between September and November 2015. These months are especially
challenging due to low sun elevation angles, resulting in large deviations of cloud shadows for small errors in cloud height estimations.
Days without transient clouds and timestamps with hardware failures are excluded. The validation is conducted for lead times of 0 min, 5 min, 10 min, 15 min, 20 min and 30 min ahead, exploring the limits of ASI-derived nowcasts.
The validation process consists of three steps:
1. The one minute averaged DNI values in each pixel of the nowcasted DNI map which contain radiometers are compared to their corresponding ground measurements.
2. The average DNI over differently sized areas typical for solar plants are compared to the figures from the reference, derived from shadow cameras and ground measurements.
3. Furthermore, ASI-derived nowcasts are compared to persistence forecasts.
In this paper, we will give examples of these three steps. Additionally, requirements for applications in CSP plants defined in [1] and [6] are discussed.
Comparing Nowcasted Data with Radiometer Stations
Measurements from radiometers are compared to DNI values of the corresponding pixels in the nowcasts for different lead times. As an example, three pyrheliometers are compared to the corresponding pixels from the nowcasted data set. Bias, relative bias, mean absolute error (MAE), relative MAE, root mean square error (RMSE), relative RMSE, standard deviation (std) and relative std are calculated for each station and each day. The formulas are briefly explained in the following with oi as the DNI values from the observations in the reference data set and pi
as the predicted DNI values from the nowcasted data set at timestamp i. N equals the total number of timestamps included in the evaluated validation interval. Relative values are only derived for single days and Om is set to the
daily mean observed DNI. [7]
The bias is the arithmetic average of the values of the differences:
N i i io
p
N
bias
11
(1) The relative bias is given by:
N i i i mo
p
O
N
bias
relative
1100
(2) The Mean Absolute Error (MAE) is:
N i i io
p
N
MAE
1|
|
1
(3) The relative MAE is defined as follows:
N i i i mo
p
O
N
MAE
relative
1|
|
100
(4) The Root Mean Square Error (RMSE) is2 / 1 1 2
/
)
(
N i i io
N
p
RMSE
(5)The relative RMSE is defined as follows:
2 / 1 1 2
/
)
(
100
N i i i mN
o
p
O
RMSE
relative
(6)The standard deviation (std) is: 2 / 1 1 2 1 2
(
)
)
(
1
N i N i i i i io
p
o
p
N
std
(7)The relative std is defined as follows:
2 / 1 1 2 1 2
(
)
)
(
100
N i N i i i i i mo
p
o
p
O
N
std
relative
(8)Before calculating the error metrics for 9 days, we look at specific days to get an understanding of the system performance for different irradiance situations. These days are Sept. 18th 2015, Sept. 19th 2015 and Nov. 22nd 2015.
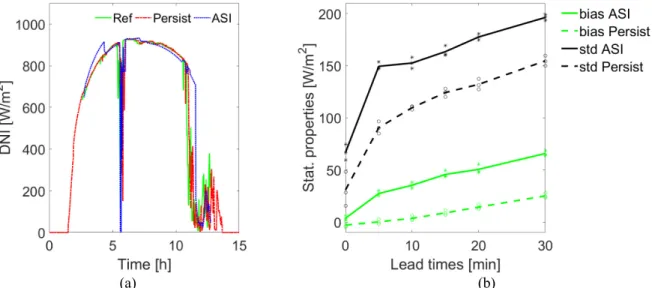
In Fig. 2a, the DNI values of Sept. 18th 2015 are displayed as measured by a reference station (green, solid), as
predicted by the persistence forecast (red, dashed) and as predicted by the nowcasting system at the station’s position (blue, dotted). The DNI values from both the nowcasts and the persistence forecasts are displayed at a lead time of 10 min. The reference DNI in this graph comes from the southernmost station in Fig. 1a and is only given for timestamps with available nowcasted data.
The persistence forecast uses the DNI from the southernmost station as input to derive the Linke turbidities following [8]. From these Linke turbidities, the future DNI is calculated.
In order to provide an understanding of the persistence forecast, its predictions are displayed for the whole day. Figure 2b depicts the bias and standard deviation for the nowcasts (“ASI”, solid) and the persistence forecast (“Persist”, dashed) at different lead times. The values for three pyrheliometers are depicted as stars for the nowcasts and as circles for the persistence forecasts. The lines show the average of the results for the three pyrheliometers. Both the persistence forecasts and the ASI system use the DNI measured at the southernmost station at the time of the creation of the nowcast, resulting in little deviation at lead time 0 min for the persistence forecast.
(a) (b)
FIGURE 2. (a) DNI values of a reference station (green, solid), the persistence forecast (red, dashed) and the ASI-derived
nowcasted values at the station’s position (blue, dotted) on Sept. 18th 2015. Persistence forecast and nowcasts have a lead time of
10 min. (b) Bias and standard deviation for the nowcasts (“ASI”, solid, stars) and the persistence forecast (“Persist”, dashed, circles) at different lead times. The values of three pyrheliometers are depicted as stars for the nowcasts and with circles for the
In Fig. 3a, RMSE and MAE for the nowcasts (“ASI”, solid, stars) and the persistence forecast (“Persist”, dashed, circles) at different lead times are shown in the same way as the bias and the std in Fig. 2b. Figure 3b shows the corresponding relative properties for the nowcasts.
For the often constant irradiance conditions present on Sept. 18th 2015 (clear sky with few transient clouds), the
nowcasting system does not beat the persistence forecast.
(a) (b)
FIGURE 3. Statistical properties of the nowcasted DNI map-pixels in comparison to three pyrheliometers on Sept. 18th 2015. (a)
RMSE and MAE for the nowcasts (“ASI”, solid, stars) and the persistence forecast (“Persist”, dashed, circles) at different lead times. The values of three pyrheliometers are depicted as stars for the nowcasts and with circles for the persistence forecasts. The
lines show the average of the results for the three pyrheliometers. (b) Relative bias, relative MAE, relative RMSE and relative standard deviation of the nowcasts at different lead times.
The corresponding graphs for Sept. 19th 2015 are depicted in Fig. 4 and Fig. 5. Unlike Sept. 18th 2015 (Fig. 2a),
this day displays a high volatility caused by transient clouds. In this situation, the nowcasting system surpasses the persistence forecasts for all lead times above 5 min.
(a) (b)
FIGURE 4. (a) DNI values of a reference station (green, solid), the persistence forecast (red, dashed) and the ASI-derived
nowcasted values at the station’s position (blue, dotted) on Sept. 19th 2015. Persistence forecast and nowcasts have a lead time of
10 min. (b) Bias and standard deviation for the nowcasts (“ASI”, solid, stars) and the persistence forecast (“Persist”, dashed, circles) at different lead times. The values of three pyrheliometers are depicted as stars for the nowcasts and with circles for the
(a) (b)
FIGURE 5. Statistical properties of the nowcasted DNI map-pixels in comparison to three pyrheliometers on Sept. 19th 2015. (a)
RMSE and MAE for the nowcasts (“ASI”, solid, stars) and the persistence forecast (“Persist”, dashed, circles) at different lead times. The values of three pyrheliometers are depicted as stars for the nowcasts and with circles for the persistence forecasts. The
lines show the average of the results for the three pyrheliometers. (b) Relative bias, relative MAE, relative RMSE and relative standard deviation of the nowcasts at different lead times.
Figure 6 and Fig. 7 are linked to Nov. 22nd 2015. This day displays less volatility than Sept. 19th 2015, but more
than Sept. 18th 2015. Due to low sun elevation angles below 33 degrees (resulting in large errors for small deviations
in cloud height detection) and fairly constant irradiance conditions, this day is a challenge for the nowcasting system, which does not outperform the persistence forecasts. For lead times below 20 min the deviations of the persistence forecasts and the ASI system are similar.
(a) (b)
FIGURE 6. (a) DNI values of a reference station (green, solid), the persistence forecast (red, dashed) and the ASI-derived
nowcasted values at the station’s position (blue, dotted) on Nov. 22nd 2015. Persistence forecast and nowcasts have a lead time of
10 min. (b) Bias and standard deviation for the nowcasts (“ASI”, solid, stars) and the persistence forecast (“Persist”, dashed, circles) at different lead times. The values of three pyrheliometers are depicted as stars for the nowcasts and with circles for the
(a) (b)
FIGURE 7. Statistical properties of the nowcasted DNI map-pixels in comparison to three pyrheliometers on Nov. 22nd 2015. (a)
RMSE and MAE for the nowcasts (“ASI”, solid, stars) and the persistence forecast (“Persist”, dashed, circles) at different lead times. The values of three pyrheliometers are depicted as stars for the nowcasts and with circles for the persistence forecasts. The
lines show the average of the results for the three pyrheliometers. (b) Relative bias, relative MAE, relative RMSE and relative standard deviation of the nowcasts at different lead times.
The error metrics for all considered 9 days increase with increasing lead times and are depicted in Fig. 8a and Fig. 8b. Depicted are the mean values averaged both over the days and three pyrheliometers. Due to the often constant sky conditions in Southern Spain and autumnal elevation angles, persistence forecasts and ASI nowcasts display similar error metrics. For days and periods similar to Sept. 19th 2015, the nowcasting system outperforms the
persistence forecast. As nowcasting systems are most relevant for volatile irradiance conditions, this result is encouraging.
(a) (b)
FIGURE 8. Statistical properties of the nowcasted DNI maps in comparison to three pyrheliometers for 9 days in September,
October and November 2015. Depicted are the mean values averaged both over the days and three pyrheliometers. (a) Bias and standard deviation for the nowcasts (NC, solid) and the persistence forecast (Fcast, dashed) at different lead times. (b) RMSE and
MAE for the nowcasts (ASI, solid) and the persistence forecast (Persist, dashed) at different lead times.
The results are in alignment with publications on other ASI systems: RMSE values between 155 W/m2 and
200 W/m2 for 10 min GHI forecasts are reported in [9] and RMSE values also for GHI forecasts up to 250 W/m2 for
A hybrid ASI/stochastic learning approach presented in [11] achieved RMSE values between 55 W/m2 and
140 W/m2 for DNI forecasts and a lead time of 10 min. In [12], RMSE values for DNI forecasts between 169 W/m2
for 5 min lead time and 191 W/m2 for 15 min lead time as well as MAE values between 139 W/m2 (5 min) and
152 W/m2 (15 min) are demonstrated. As the specifics of the selected days heavily influence the error metrics, a
large variety of conditions or the same data set must be included for detailed comparisons of these error metrics.
Comparing Field Averages
For CSP plant operation, point like DNI forecasts are less relevant than forecasting average DNI values for a given area, e.g. the whole solar field of a plant or subfields. The DNI forecast errors of spatially averaged figures are generally smaller as discrepancies are reduced. Hence, the statistical properties derived above do not provide the final quality information that is required for the plant operator working with nowcasting data.
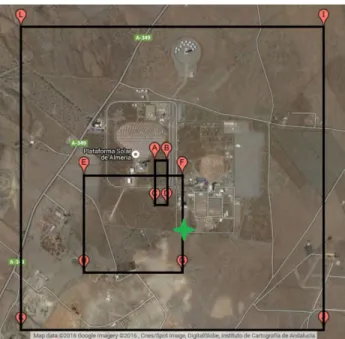
Therefore, spatially aggregated nowcasted DNI figures are compared to the corresponding reference values from the shadow camera system. Three different spatial aggregations are considered (Fig. 9): The first field corresponds to a whole CSP power plant having a size of 2 km × 2 km (“Whole field”). The second field corresponds to a subfield of a CSP plant with 650 m × 650 m (“Big subfield”). The third field corresponds to 60 m × 300 m (“Small subfield”). Choosing differently sized fields provides an understanding of the aggregation effects reducing error margins.
Besides whole field averages, CSP plant operators are interested in subfield figures, as these subfields can be managed separately (e.g. regarding mass flow rates of heat transfer fluid).
FIGURE 9. Three differently sized fields corresponding to solar power plants are chosen to compare spatially averaged DNI
values of the nowcasts to the reference. The position of the reference station is marked with a green star. [Google Maps]
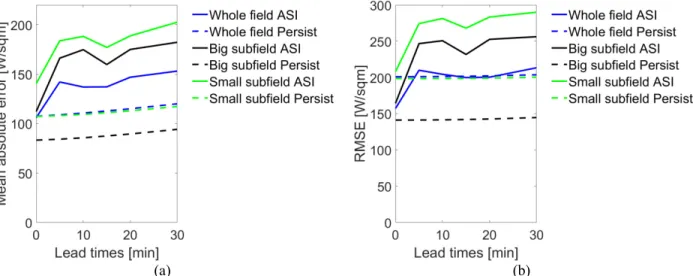
Figure 10a presents the MAE calculated for spatially averaged DNI values for the specified fields on Sept. 18th
2015. In Fig. 10b, the corresponding RMSE of Sept. 18th 2015 is shown (see Fig. 2a for DNI measurements of this
day). Figure 11a and Fig. 11b display spatial MAE and RMSE values for Sept. 19th 2015 (see Fig. 4a for DNI
measurements of this day).
As Sept. 18th 2015 is nearly a clear sky day with very low temporal and spatial irradiance variations, the
forecasts, benefiting from spatial averaging, also surpass the nowcasting system for more than 5 min lead time. Partially, this is caused by large deviations in the nowcasted data set visible for early hours in Fig. 2a and Fig. 4a.
For Sept. 19th 2015, the error metrics of the persistence forecasts are lowest for the big subfield. At first glance,
this is unexpected as the metrics should increase with decreasing field sizes due to spatial averaging. This is understandable as the pyrheliometer providing live DNI input to the ASI and to the persistence forecast systems is close to the big subfield but not to the small subfield. Furthermore, the dominant cloud direction on this day is westwards, from the reference station to the big subfield. Thus, the data for the big subfield benefits more from the station’s position than the whole field and the small subfield. The behavior of field aggregated persistence forecasts is totally different from the comparisons based on singular radiometers (see e.g. Fig. 2b): The field aggregated persistence error metrics do not rise significantly with increasing lead times as the considered temporal and spatial variabilities are similar for most situations. This effect is further discussed in [4].
(a) (b)
FIGURE 10. Statistical properties of the nowcasted DNI maps for different field sizes in comparison to the shadow camera
reference system on Sept. 18th 2015. (a) Mean absolute error for the nowcasts (“ASI”, solid) and the persistence forecast
(“Persist”, dashed) at different lead times and different field sizes. (b) RMSE error at different lead times and different field sizes.
(a) (b)
FIGURE 11. Statistical properties of the nowcasted DNI maps for different field sizes in comparison to the shadow camera
reference system on Sept. 19th 2015. (a) Mean absolute error for the nowcasts (“ASI”, solid) and the persistence forecast
CONCLUSION AND PERSPECTIVES
In this paper, the methodology to validate and benchmark nowcasting systems is presented using an exemplary data set. The nowcasts deviate from the reference system similarly to previous findings reported in the literature. For high variability in irradiance, the nowcasting system outperforms the persistence forecast. For periods with low irradiance variability, the persistence forecasts surpass the nowcasts. From a plant operator’s point of view, nowcasting systems are most important for volatile periods of time, in which persistence forecasts will fail. This indicates the applicability of ASI camera systems for CSP plant operation.
To the best of our knowledge, this is the first time nowcasted two dimensional irradiance maps are compared with spatially resolved reference irradiance maps. The reference system is briefly described here and in more detail in [4]. In this publication, a thorough validation of the reference system including additional improvements is presented.
The optimum ASI based nowcasting configuration has to be further investigated. Different algorithmic approaches, the optimal number of ASI cameras and the benefits of additional sensors such as ceilometers must be benchmarked. At PSA, a benchmarking framework for nowcasting systems is operational. With this reference system, large-scale comparisons for different nowcasting configurations can be performed. This way, the development of the optimum nowcasting system is supported.
ACKNOWLEDGEMENT
The research leading to these results has received funding from the European Union’s FP7 Programme under Grant Agreement no. 608623 (DNICast project).
REFERENCES
1. T. Hirsch, M. Schroedter-Homscheidt, S. Wilbert, N. Martín-Chivelet, L. González, M. Biencinto, (2015). “Towards the Definition of Requirements for Direct Normal Irradiance Nowcasting Systems”. SolarPACES 2015, 13.-16.10.2015.
2. P. Massip, P. Blanc, A. Kazantzidis, P. Tzoumanikas. “DNICast: Report on algorithms for nowcasting methods based on sky imagers”, Report D3.1, http://www.dnicast-project.net/, 2013.
3. P. Blanc, P. Massip, A. Kazantzidis, P. Tzoumanikas, P. Kuhn, S. Wilbert, D. Schüler, C. Prahl. „Short-term forecasting of high resolution local DNI maps with multiple fish-eye cameras in stereoscopic mode”. Paper submitted to SolarPACES conference, 2016.
4. P. Kuhn, S. Wilbert, C. Prahl, D. Schüler, T. Haase, T. Hirsch, M. Wittmann, R. Pitz-Paal, P. Blanc, L. Ramirez, L. Zarzalejo, A. Meyer, L. Vuilleumier. “Shadow camera system for the generation of solar irradiance maps”. Paper submitted to Solar Energy, December 2016.
5. H. Schenk, T. Hirsch, M. Wittmann, S. Wilbert, L. Keller, C. Prahl. “Design and operation of an irradiance measurement network”, Energy Procedia 69 (2015): 2019 - 2030.
6. T. Hirsch, N. Martin Chivelet, L. Gonzalez Martinez, M. Biencinto Murga, S. Wilbert, M. Schroedter-Homscheidt, F. Chenlo, J. F. Feldhoff. “DNICast: Technical report on the functional requirements for the nowcasting method”, Report D2.1, http://www.dnicast-project.net/, 2014.
7. C. Gueymard. “A review of validation methodologies and statistical performance indicators for modelled solar radiation data: Towards a better bankability of solar projects”, Renewable and Sustainable Energy Reviews, 39 (2014), 1024-1034.
8. P. Ineichen, P. Richard. "A new airmass independent formulation for the Linke turbidity coefficient." Solar Energy 73.3 (2002), 151-157.
9. D. Bernecker, C. Riess, E. Angelopoulou and J. Hornegger, “Continuous short-term irradiance forecasts using sky images,” Solar Energy, 110, 303–315 (2014).
10. T. Schmidt, J. Kalisch, E. Lorenz and D. Heinemann. “Evaluating the Spatio-Temporal Performance of Sky Imager Based Solar Irradiance Analysis and Forecasts,” Atmospheric Chemistry and Physics, 16, 3399-3412. 11. Y. Chu, H. T.C. Pedro, C. F.M. Coimbra, “Hybrid intra-hour DNI forecasts with sky image processing
enhanced by stochastic learning”, Solar Energy, Volume 98, Part C, December 2013, 592-603.
12. C.-L. Fu, and H.-Y. Cheng. "Predicting solar irradiance with all-sky image features via regression." Solar Energy 97 (2013): 537-550.