HAL Id: hal-03060520
https://hal.sorbonne-universite.fr/hal-03060520
Submitted on 14 Dec 2020HAL is a multi-disciplinary open access archive for the deposit and dissemination of sci-entific research documents, whether they are pub-lished or not. The documents may come from teaching and research institutions in France or abroad, or from public or private research centers.
L’archive ouverte pluridisciplinaire HAL, est destinée au dépôt et à la diffusion de documents scientifiques de niveau recherche, publiés ou non, émanant des établissements d’enseignement et de recherche français ou étrangers, des laboratoires publics ou privés.
Role of Transport in the First Atomic Layers of
Nanoparticles in Lithium Batteries
Frédéric Lantelme, Jiwei Ma, Damien Dambournet
To cite this version:
Frédéric Lantelme, Jiwei Ma, Damien Dambournet. Role of Transport in the First Atomic Layers of Nanoparticles in Lithium Batteries. Journal of The Electrochemical Society, Electrochemical Society, 2020, 167 (14), pp.140538. �10.1149/1945-7111/abc76b�. �hal-03060520�
Role of transport in the first atomic layers of the nanoparticles in lithium batteries 1
2
Frédéric Lantelme†,‡*, Jiwei Ma†,‡,×, Damien Dambournet†,‡ 3
4
† Sorbonne Université, CNRS, Physico-chimie des électrolytes et nano-systèmes interfaciaux,
5
PHENIX, F-75005 Paris, France. 6
‡ Réseau sur le Stockage Electrochimique de l’Energie (RS2E), FR CNRS 3459, 80039
7
Amiens cedex, France. 8
× Institute of New Energy for Vehicles, School of Materials Science and Engineering, Tongji
9
University, Shanghai 201804, China. 10 11 12 13 Abstract 14 15
A theoretical approach of the insertion/deinsertion of lithium in host materials is proposed to 16
take into account some phenomena not included in classical analyses of lithium battery 17
operation. This is mainly related to the variation of the transport properties in the first atomic 18
layers in the vicinity of the interface which can give rise to rapid storage phenomena. These 19
processes are of great importance in the case of electrodes made of nanoparticles as a result of 20
the considerable development of the interfacial surface. For example, they can be at the origin 21
of the important capacitive behavior of the system. A model based on the numerical integration 22
of transport equations is presented to describe these complex mechanisms. The theoretical 23
analysis is illustrated on the model case of lithium insertion in electrodes made of nanoparticles 24
of anatase and fluorinated anatase. 25 26 27 28 29 30 31 32 * E-mail: frederic.lantelme@upmc.fr 33 34
35 36 37 38 Introduction 39 40
The pressing need for transportable electrical energy sources has given rise to a great deal of 41
work in recent decades. Among these, lithium-based batteries occupy a prominent place due to 42
the electrochemical properties of this element joined to its low density. This sector has benefited 43
from intensive research which has improved performance1-3. A large part of the research was 44
devoted to the development of electrode materials which exhibit a suitable free energy of 45
formation and thus a high open circuit voltage for a high performance battery. In order to 46
improve the battery power, they also should allow a rapid transport of lithium atoms. A device 47
commonly used to fulfill these criteria is based on the lithium insertion in a host material, 48
generally a metal oxide such as V2O5, Nb2O5, LiCoO2, TiO2, etc4.
49 50
However, a weakness of the system comes from the very slow transport of lithium atoms in the 51
crystal lattice of the host material. An effective way to overcome this difficulty is to reduce the 52
size of host particles which reduces the diffusion length and promotes faster transport5. Hence
53
the idea of using particles of reactive material at a nanometric dimension, which considerably 54
increases the contact surface and facilitates the lithium storage; an issue of nanoparticles is 55
accelerated side reactions. The study of these systems has given rise to a large number of 56
research work which focus on the nature of the host material, its preparation and the properties 57
of lithium intercalation. Various systems have been developed which are essentially 58
characterized by the nature of the host material in order to obtain the best lithium intercalation 59
qualities. This work has led to a lot of research to get a more accurate view of the reaction 60
mechanisms. Here is a brief overview of the main work in this area. 61
62
The insertion of Li-ions within cathode materials during the discharging of a battery oftentimes 63
brings about one or more structural transformations6. A theoretical investigation of the effects 64
of elastic coherency strain on the thermodynamics, kinetics, and morphology of intercalation in 65
single LiFePO4 nanoparticles yields new insights into this important battery material7. The
66
kinetics of a two-phase electrochemical reaction in LixFePO4 indicates that the phase transition
67
proceeds with a one-dimensional phase-boundary movement8. The core–shell, the 68
compositional striping modulations and the resulting strain gradients point to the need to design 69
cathode materials and electrode architectures to mitigate such pronounced local 70
inhomogeneities in Li-ion intercalation and diffusion9.
71 72
The different specific constraints of the batteries have given rise to many analytical descriptions 73
of transport phenomena from conventional models. For example, concentration dependent 74
diffusion coefficients are found to be necessary to match experimental results10. On the other 75
hand, in a finer way, it was suggested to represent the phase transitions as moving boundary 76
points where jump discontinuities in concentration occur; the question of when it is necessary 77
to include these effects in a transport model is difficult to resolve, because the measured values 78
of the open-circuit voltage for real materials are never completely flat and always exhibit a 79
small dependence on state of charge; it was shown that the jump discontinuities arise as a 80
singular limit of a nonlinear diffusion equation when chemical potentials are used as the driving 81
force for transport11. It was also pointed out that variations in the chemical diffusivities over a 82
significant range of lithiation are shown to be explained by the inclusion of both the 83
thermodynamic factor and the flux of lithium due to bulk motion of material12, 13. 84
85
In addition to the influence of the thermodynamic properties and of the structural changes of 86
the materials described above, it is important to pay our attention to an essential characteristic 87
of the batteries, namely the nanometric dimension of the active particles. As already pointed 88
out, the use of nanoparticles has the advantage of significantly increasing the electroactive 89
surface. The increase in surface area is generally taken into account by the introduction of a 90
roughness factor in the calculation elements14, 15. But this correction does not take into account
91
the specific nature of the transport in the very first atomic layers of the surface thus introduced. 92
Indeed, another consequence of the use of nanoparticles is to considerably shorten the path of 93
lithium transport, which is now reduced to distances of the order of atomic dimensions. 94
Attention should be drawn to the fact that much of the transport is no longer carried out in the 95
compact layers but remains confined to the first atomic layers of the substrate. In the superficial 96
region the transport properties are greatly affected by the loosening of the surface structure of 97
the material. This phenomenon is generally negligible for large conventional systems but 98
becomes predominant when transport does not exceed a few atomic layers. 99
100
The purpose of this paper is to analyze and highlight the important role of transport phenomena 101
in the surface layers of the substrate material: given the nanometric nature of the particles, the 102
influence of transport kinetics in these few superficial atomic layers becomes significant. To 103
tackle in a more structural way the origin of these phenomena it seems interesting to take 104
inspiration from already developed models dealing with the analysis of the transport kinetics in 105
the first atomic layers of the host material16. 106
107
After a brief description of the materials and of the experimental setup, we will describe the 108
elementary principles involved in the reaction mechanisms. Particular emphasis will be placed 109
on deviations from ideality, on the variation of transport properties in the surface layers, and on 110
the formation of storage layers at the interface; then, to interpret the modifications thus 111
introduced we will briefly recall the principle of the integration of basic equations by the finite 112
difference method17, 18. Finally, the investigations will be illustrated on the model case of 113
lithium insertion in anatase or fluorinated anatase crystallites. 114
115
Experimental 116
117
Synthesis. The experimental study examined nanoparticles of anatase and fluorinated anatase;
118
in fact, the action of a fluorinated agent improves the storage properties of the battery. The 119
materials were synthesized using the sol-gel chemistry without and with a fluorinating agent, 120
as described in a previous report19. The degree of fluorination may vary depending on the
121
procedure employed; we used a compound with 22 % cationic vacancies, corresponding to 122
Ti0.780.22O1.12F0.40(OH)0.48, where represents a cationic vacancy.. For more details
123
concerning this formulation see ref. (19). 124
125
Electrochemistry. Electrochemical measurements were carried out with three-electrode
126
Swagelok-type cells. The working electrode was prepared with 80 wt.% active materials, 10 127
wt.% Super P and 10 wt.% polyvinylidene difluoride (PVDF), and lithium metal was used as 128
counter and reference electrodes. 1M LiPF6 in ethylene carbonate (EC) and dimethyl carbonate
129
(DMC) (1:1, v/v) was used as the electrolyte. The electrode is made of a thin layer of a mixture 130
of anatase (2.5 mg/cm2) and carbon (0.32 mg/cm2) nanocrystals with PVDF (0.32 mg/cm2). The 131
theoretical capacity of the material is 3.02 C/cm2. Cyclic voltammetry was performed at 132
different scan rates within a potential range of 1.0-3.0 V vs Li+/Li. Galvanostatic intermittent 133
titrations were carried out after one galvanostatic discharge/charge cycle, a constant-current 134
discharge pulse of 84 µA cm-2 was applied for 20 minutes, followed by a relaxation duration of 135
20 h; the current pulse corresponds to a capacity fraction of 1/30. 136
137
Results and discussion 138
139
Transport equations. A specific advantage of electrochemical techniques is to provide an easy 140
measurement of the reaction flux, J, at the electrode surface and of the concentration, c, of the 141
active species during the electrochemical process. The flux at the electrode surface is given by 142
the current density, i 143
𝐽° = − 𝑖
𝑛𝐹 (1)
144
For an ideal and reversible reaction, Ox + ne- → Red (such as, Li+ + e- → Li), the concentration, 145
c, of the Red species is deduced from the electrode potential from the Nernst law, the
146
concentration of Ox species is assumed to be constant, 147
𝑐 = exp (𝑛𝐹
𝑅𝑇 (𝐸° − 𝐸)) (2)
148
where, E0 = RT/nF × ln c0; E is the electrode potential vs the pure Red species, c0 is the 149
concentration of pure Red. 150
However, most systems exhibit large deviations from ideality; the Nernst equation gives access 151
to the activity, a, of the electroactive species which is linked to the concentration by a factor f 152
called the activity coefficient f: 153
𝑎 = 𝑓𝑐 = exp (𝑛𝐹
𝑅𝑇(𝐸° − 𝐸)) (3)
154
The activity coefficient demarcates the equilibrium (thermodynamic) response under 155
concentrated conditions. The intercalation electrodes represent very high concentrations (of the 156
order of 50 M) that the activity coefficient becomes a strong function of concentration. Various 157
theoretically consistent treatments were used to recover activity coefficient from the open 158
circuit potential (OCP) curves20. Here we refer to a previous work dealing with the system Li-159
V2O5 which exhibits various phase transformations21. It was shown22 that the large changes in
160
the activity factor vs the concentration were correctly described by the series: 161
ln𝑓 = ∑𝑛𝑗=10.5(ln𝑓𝑗 − ln𝑓𝑗−1)erfc{𝜓𝑗 (𝑐 − 𝑐𝑇𝑗)} (4) 162
lnfj is the activity factor corresponding to the plateaus of the potential curves; since the reference
163
is the pure compound, lnf0 = 0; the complementary error function, erfc, was used to describe
164
the change from one factor to the next, cTj is the concentration at the inflexion points of the
potential curve. ψi is the steepness of the change of the activity factor around the concentration
166
cTj. The various parameters lnfi and ψi were adjusted to obtain a suitable representation of the
167
OCP curves. The driving force for diffusion is the gradient of the chemical potential μ = μ° + 168
RT ln fc; the flux, J, of the electroactive species inside the electrode matrix writes:
169 𝐽 = − 𝐷̃ (1 + 𝑐𝜕 ln 𝑓 𝜕𝑐 ) 𝜕𝑐 𝜕𝑥 (5) 170
where 𝐷̃ is the component diffusion of the active species, it is related to the chemical diffusion 171
coefficient, D, by the equation23, 24 172
𝐷 = 𝐷̃ (1 +𝜕 ln 𝑓
𝜕 ln 𝑐) (6)
173
As pointed out by Levi et al.25 this expression may be modified according to the thermodynamic 174
model; to examine the influence of the gradient of the activity coefficient a damping factor, φ, 175
is introduced in the calculation 176
𝐷 = 𝐷̃ (1 + 𝜑𝜕 ln 𝑓
𝜕 ln 𝑐) (7)
177
The term Γ is called enhancement factor
178
𝛤 = 1 + 𝜑𝜕 ln 𝑓
𝜕 ln 𝑐 (8)
179
In a non-stationary state the concentration changes obey the mass balance equation 180 ∂𝑐 ∂𝑡= − ∇𝐽 = 𝜕 𝜕𝑥(𝐷 𝜕𝑐 𝜕𝑥) (9) 181
The integration of transport equations has been solved for different boundary conditions 182
corresponding to galvanostatic or potentiostatic regimes. For a constant value of D algebraic 183
equations are available in literature to interpret the results obtained from transient electro-184
chemical techniques26.
185 186
However, in nanoparticles the transport occurs over a few atomic layers and the specificity of 187
the motion in this region must be taken into account. Indeed, in the interfacial domain, the 188
looseness of the crystal lattice enlarges the mass transport facilities. In other words it is possible 189
to consider that over these short distances interfacial energy affects the dynamic response. Thus, 190
as a first approximation, it can be considered that the intercalation of ions in the very first atomic 191
layers is extremely rapid and corresponds to an accumulation process occurring instantaneously 192
over a distance δ. This analysis is in good agreement with the concept of relevant surface 193
activity thickness (RSAT) introduced by Verbrugge and Tobias27 to calculate by
electro-194
chemical techniques the surface activity of metallic alloys. 195
196
From a dynamic point of view, this approach amounts to considering that, in this film of 197
thickness δ, the coefficient of diffusion D has an infinite value. Of course, within the material, 198
the diffusion coefficient has a constant finite value which is usually the only one taken into 199
consideration; indeed, generally the diffusion phenomena last long enough and affect the deep 200
mass of the material; the amount of material involved in the surface film becomes negligible. 201
To refine our model it was considered that in the few atomic layers in the vicinity of the storage 202
layer, of thickness δ, the diffusion coefficient evolves to reach the classical value of the 203
coefficient in the mass of the material. Here, as in our previous articles16, 28, it was assumed that 204
D obeys the equation
205
D = D* exp(δ’/x) (10)
206
where D* is the bulk diffusion coefficient and δ’ is a characteristic distance called relevant 207
rapid diffusion thickness (RRDT). A diagram is proposed to illustrate the evolution of transport 208
in the surface layers (Fig. 1). 209
210
The current density is linked to the flux at the electrode surface Jo (Eq. 1). Now, the 211
accumulation process at the interface has to be taken into account 212 Jo = 𝛿𝜕𝑐0 𝜕𝑡 − 𝐷 ( 𝜕𝑐 𝜕𝑥)𝑥=𝛿 (11) 213
c0 is the concentration in the surface layer of thickness δ. The introduction of metal ions in the
214
matrix of the crystal creates a volume change of the electrode deduced from the partial molar 215
volume of the electroactive component 𝑉̅𝑀. It results that during the electrolysis the interface 216
moves with a velocity v 217
v = J 𝑉̅𝑀 (12)
218
The quantity 𝑉̅𝑀 takes account of the constraints introduced by the insertion of the active 219
element M into the substrate. In general 𝑉̅𝑀 is clearly lower than the molar volume VM; under
220
the action of strong stresses, 𝑉̅𝑀 can even become negative.
221 222
The displacement of the interface is introduced in the diffusion equation which becomes 223
𝐽 = −𝐷𝜕𝑐
𝜕𝑥+ v 𝑐 (13)
224
D depends on the distance, x, (Eq. 10) and, according to Eq. 9, the concentration change obeys
225 the equation 226 ∂𝑐 ∂𝑡= − ∇𝐽 = 𝐷 𝜕2𝑐 𝜕𝑥2− 𝐷∗ 𝛿 ′ 𝑥2exp ( 𝛿′ 𝑥) 𝜕𝑐 𝜕𝑥− v 𝜕𝑐 𝜕𝑥 (14) 227
However, in contrast with the classical treatment, it is no more possible to integrate the 228
complete diffusion equation into an algebraic form. It is proposed to solve the problem by 229
numerical integration of the diffusion equation according to a procedure already developed to 230
study the electrowinning of refractory metals28. The technique requires an analytical 231
representation of the thermodynamic and kinetic properties of the system. 232
233
Integration of the diffusion equations. The digital simulation technique used to calculate the 234
transient curve consists in solving the partial differential equation by numerical calculation17.
235
A numerical model is set up within a digital computer and the model is allowed to evolve by a 236
set of algebraic laws deriving from equations defining the mass transport. The space (x 237
coordinate) is divided in small intervals, Δx, and the time into small time steps, Δt. The 238
concentration of the electroactive reagent at the electrode surface, at the time t, is given by the 239
Nernst equation, and the current density is related to the concentration gradient at the electrode 240 surface 241 𝐽𝑜 = 𝛿𝑐(0,𝑡)−𝑐(0,𝑡−∆𝑡) ∆𝑡 − 𝐷 𝑐(0,𝑡)−𝑐(∆𝑥,𝑡) ∆𝑥 + v𝑐(0, 𝑡) (15) 242
c(Δx,t) is the concentration at the time t at the distance Δx from the electrode surface. D obeys
243
Eq. 10. Concentrations as a function of time and concentration profiles in the bulk of the 244
substrate were calculated from the diffusion equation (Eq. 14). In finite difference scheme the 245
continuous functions are finitized with centered finite scheme for space derivative: 246 𝜕𝑐 𝜕𝑥 = 𝑐(𝑥+∆𝑥,𝑡)−𝑐(𝑥−∆𝑥,𝑡) 2∆𝑥 (16) 247 𝜕2𝑐 𝜕𝑥2= 𝑐(𝑥+∆𝑥,𝑡)−2𝑐(𝑥,𝑡)+𝑐(𝑥−∆𝑥,𝑡) (∆𝑥)2 (17) 248
It must be pointed out that the stability conditions of the finite difference calculation require 249
that the space interval Δx be greater than the diffusion path during the time step: Δx > √2𝐷 Δ𝑡; 250
but, on the other hand, to correctly integrate the evolution of the diffusion coefficient (Eq. 10), 251
it is necessary that the space interval, Δx, be less than the length RRDT, δ’>Δx . For large time 252
intervals, such as in voltammetry at low sweep rate, these conditions may be difficult to meet. 253
More details concerning the calculation procedure can be found in previous papers17, 21.
254 255
Application to lithium insertion in anatase nanocrystals 256
257
Electrode structure – Anatase TiO2 has been extensively studied over the past decade due to its
258
application as electrode material for Li batteries29, 30. In a simplifying assumption and in 259
agreement with the known structure of the nanoparticles, the electrode material will be 260
considered as a collection of nano-platelets of parallelepiped shape31 (Fig. 2) in contact with 261
the electrolyte and with the carbon powder which provides the electric contact. For an electrode 262
containing m gram of active compounds per unit surface the number of particles is 263
np = m/(ρ×a×a×b) (18)
264
where ρ is the specific mass of the compound. It is assumed that the lithium diffusion occurs 265
only in one direction perpendicular to the surface a×a.31. The real active surface for the 266
electrochemical reaction is 267
Sp = np× a×a (19)
268
The electrochemical reaction occurring in the battery is described by the reaction 269
TiO2 + yLi+ + ye- ↔ LiyTiO2 (20)
270
where y is the lithium intercalation ratio. Upon lithiation to Li0.5TiO2, anatase is observed to
271
undergo a tetragonal to orthorhombic phase transition32. The thermodynamically stable ordered
272
phase at y = 0.5 can accommodate excess Li in vacant sites up to y = 0.633; in agreement with
273
the model developed above, it was shown that the diffusion in this phase is strictly one 274
dimensional31. In order to improve the storage capacity of the electrode, fluorinated anatase 275
crystals were also investigated. The samples used in the present description correspond to the 276
fluorinated anatase, Ti0.780.22O1.12F0.40(OH)0.48, as described in previous papers19, 34.
277 278
An estimate of the particle sizes is deduced from microscopic investigationshowing that the 279
anatase grains have a dimension of the order of ten nanometers19, 35. In our study, as a first 280
approximation, they will be assimilated to parallelepipeds according to the representation of 281
Fig.2, with, for dimension: a = 3 nm and b = 12 nm. 282
According to the synthesis of the electrodes, the cathodic layer has a thickness of 10 µm. In this 284
layer the weight of anatase or fluorinated anatase unit is 2.5 mg/cm2; the number of particles,
285
np, and their active electrochemical area, Sp, deduced from Eqs 18, 19 are reported in Table 1.
286 287
Electrochemical analysis − The electrode potential, E (vs pure lithium metal), corresponding
288
to the electrochemical reaction (Eq. 20) is given by the Nernst’s equation 289 𝐸 = 𝐸° −𝑅𝑇 𝐹 ln𝑓𝐿𝑖𝑐𝐿𝑖 (21) 290 with 291 𝐸° = 𝑅𝑇 𝐹 ln𝑐𝐿𝑖 𝑜 (22) 292
𝑐𝐿𝑖𝑜 is the concentration of pure lithium metal. The index y (Eq. 20) and cLi are linked through
293
the equation 294
cLi = y/𝑉𝐿𝑖𝑦𝑇𝑖𝑂2 (23)
295
𝑉𝐿𝑖𝑦𝑇𝑖𝑂2is the molar volume of the compound 296
𝑉𝐿𝑖𝑦𝑇𝑖𝑂2 = 𝑉𝑇𝑖𝑂2+ y𝑉̅Li (24)
297
𝑉̅Li is the partial molar volume of lithium. The above relation assumes that 𝑉̅Li remains constant
298
in the concentration range studied; however, the imprecision eventually introduced is very 299
small; indeed, as indicated above, 𝑉̅Li is much smaller than the molar volume of lithium (𝑉̅Li ≈
300
0.1 VLi). As a result, the variations in volume of the substrate during the insertion of lithium are
301
always small. 302
303
The value of the activity coefficient, fLi, is deduced from the Eq. 4; the parameters, fj and ψj, the
304
index j varying from 1 to 4, are adjusted in order to obtain a good fit between the calculated 305
curve and experimental OCP curve (Fig. 3). The goodness-of fit values of the parameters 306
involved in the calculation are shown in Table 2. 307
308
Analysis by cyclic voltammetry, pseudo-capacitive contribution − The cyclic voltammograms
309
on anatase, or fluorinated anatase Ti0.780.22O1.12F0.4OH0.45 particles are reported in Figs 4-5.
310
To analyze the voltammograms it was assumed that the electrochemical response depends of 311
two components36: the faradaic current, iF, coming from the lithium insertion process and from
the charge-transfer process with surface atoms (pseudo-capacity), and the non-faradaic current, 313
iC, arising from double layer capacitance, which corresponds, in our field of study, to a very
314
small current37; it can be neglected36. In the literature it is generally accepted that the faradaic
315
contribution is the sum of two terms36, 38: 316
iF = k1 ν ½ + k2 ν (25)
317
where ν is the scan rate; k1 and k2 are two constants, the first term arises from the diffusion
318
controlled insertion, and the second one from the pseudo-capacitive effect. 319
320
It is now proposed to interpret the cyclic voltammetry response in a more precise way by taking 321
into account the characteristic features of atomic-scale transport. 322
323
Surface transport and capacitive effect − The pseudo-capacitive behavior arises from the
324
transport properties in the first atomic layers and from the fast storage of the active material at 325
the surface of nanoparticles. These effects come from the properties of the interface at atomic 326
scale which result in a variation of the diffusion velocity (Eq. 10) and in the existence of an 327
instantaneously charged layer of thickness δ (RSAT). 328
329
The finite differences technique is used to calculate the current response during a cyclic 330
potential scan rate corresponding to lithium insertion (Figs 4-5). The morphological change of 331
the crystal lattice due to the lithium insertion induces a change of the thicknesses δ and δ’. It is 332
assumed that these values reach a maximum for c= cp; for anatase: cp = 15.9×10⁻³ mol/cm3, for
333
fluorinated anatase: cp = 12.3×10⁻³ mol/cm3. The corresponding intercalation ratios (Eq. 20)
334
are respectively: y=0.34 and y= 0.26. To make it easier to implement the calculation, it was 335
assumed that δ and δ’ obey the equations 336 𝛿 = 𝛿𝑚𝑎𝑥exp − (𝑐−𝑐𝑝)2 3𝑐𝑝2 (26) 337 and 338 δ’ = 0.25*δ (27) 339
The two above empirical relations, and the values of D* and δmax are adjusted in order to obtain
340
the best fit with the experimental curves (Table 3). It should be noted that the δmax values are of
341
the same order of magnitude as those obtained during the electrochemical preparation of metal 342
alloys28, 39 (a few nanometers). 343
344
The storage process can be interpreted in terms of pseudo capacitance, C. The charge density 345
q, stored in the RSAT layer is
346
q= F δ Sp c(0) (28)
347
c(0) is the concentration at the electrode surface at a potential, E. The value of the capacitance,
348
C, is deduced from the classical formula, C = dq/dE. The charge increment, dq, induced by a
349
potential increment, dE, can be deduced from concentration change, dc(0), calculated from the 350
Nernst equation (Eq. 3); then 351
C = dq/dE =Fδ Sp dc(0)/dE (29)
352
In Table 3 are reported the maximum values Cmax of the capacitance, which occurs when δ =
353
δmax, so, according to Eq. 26, when c= cp.. The values of the so-called capacitance may seem to
354
be enormous. However, they are in good agreement with the experimental observations. For 355
example, in the fluorinated anatase at a scan rate of 10 mV/s, almost all the current has a 356
capacitive origin (Fig. 6); thus, to obtain a current density, ic, of the order of 10 mA/cm2 with a
357
scan rate, ν, of 10 mV/s, a capacitive constant, C, of the order of one Farad is required (reminder 358
of the formula: ic = C × ν).
359 360
Due to the large increase in the electroactive surface it has sometimes been suggested that the 361
double-layer capacity could account for the large values obtained. This suggestion is hardly 362
conceivable: for usual solvents, the order of magnitude of the double-layer capacity40 is at most 363
around 18 μF/cm2, which corresponds, even for an area of around 550 cm2, to a capacity of 10 364
mF, a value much lower than those obtained experimentally (Table 3). For that matter, a large 365
part of this paper has been written in an attempt to analyze this phenomenon. The importance 366
of the so-called capacitive response is also underlined by the work of Wang et al.36 which show 367
that, even at low scan rates (0.5 mV/s), the capacitive response is not negligible. 368
369
This model also makes it possible to link the variations of the so-called capacity to the size of 370
the particles. Indeed, the capacitive effect depends directly on the contact surface, Sp, which is
371
inversely proportional to the particle size as can be deduced from Eqs 18, 19. This suggests that 372
the capacitive effect will also be inversely proportional to the particle size. This dependence is 373
well observed experimentally36. At lower sweep rates the influence of the capacitive current
374
decreases, concentration profiles indicate a deeper penetration of lithium atoms into the bulk of 375
the electro material, the electrochemical response is getting closer to the classical laws of 376
diffusion. 377
378
Diffusion and thermodynamics − In order to obtain a more accurate determination of the
379
diffusion into the bulk of anatase particles dependence a galvanostatic intermittent titration 380
technique is used. The procedure consists of a series of current pulses, each followed by a 381
relaxation time, in which no current passes through the cell. The digital simulation technique is 382
used to calculate the electrode response from the model presented above. As deduced from the 383
cyclic voltammetry investigations the surface storage capacity is taken into account and the 384
bulk diffusion coefficient is adjusted to obtain the best fit with the experimental results. As 385
shown in Fig. 7, the fitted curves correctly represent the experimental curves. The values of the 386
diffusion coefficients are shown in Fig. 8. 387
388
It should be noted that wide fluctuations in the diffusion coefficient are obtained as a function 389
of the degree of lithium insertion. These variations reflect the change in structure of the anatase 390
crystals; they can result in a change in the thermodynamic properties of the system that is 391
reflected in the evolution of the enhancement factor (Eq. 7). The curves of Fig. 8 show that 392
there is some correlation between the evolution of this factor and that of diffusion coefficients. 393
This approach makes it possible to envisage a reasoned study linking the structural, 394
thermodynamic and kinetic properties of the system. The anatase OCP curve (Fig. 3) exhibits 395
two potential plateaus at E1 = 1.808 V, and E2 = 1.605 V, which correspond respectively to the
396
compounds TiO2Liy, with y1 = 0.302 and y2 = 0.635. The Gibbs energies of lithium insertion in
397
the compounds are ΔG1 = -52.7 kJ and ΔG2 = -98.4 kJ. The formation of these compounds leads
398
to a large departure from ideality during the insertion of lithium. This results in significant 399
variations in the activity coefficient, f, which according to Eq. 5, influences the diffusional 400 behavior of lithium. 401 402 Conclusion 403 404
The analysis of lithium insertion, in a host material made of nanoparticles shows that special 405
attention needs to be given to the study of transport phenomena in the first atomic layers of the 406
interface. In this region the looseness of the crystal lattice enlarges the mass transport facilities. 407
It results in additional effects not included in the classical analyses. To describe the system 408
behavior it is required to introduce the characteristics of surface transport in the diffusion 409
equation which can be solved by numerical calculation. This model takes into account the actual 410
contact surface and includes the concept of storage layer correlated with the increase of the 411
diffusion coefficient in the vicinity of the interface. In addition, the variations of transport 412
kinetics are related to the thermodynamic properties of the medium. 413
414
This work highlights the primary and complex role of atomic-scale transport phenomena in the 415
surface layers of electrode materials. The analysis thus developed can be a useful tool for 416
directing research towards structure with rapid charge kinetics and thus increase the available 417
power. This is how the idea of fluorination of anatase came about: this treatment improves 418
diffusivity, surface storage and pseudo-capacitance (Table 3). In addition, the study focuses 419
directly on the capacitive properties of the electrode; it can thus be useful for the research, 420
development and processing of materials for super-capacitors 421
422
The significant effect of transport in the first atomic layers of the substrate is highlighted. To 423
facilitate the implementation of the model, simplifying assumptions were arbitrarily introduced: 424
shape of particles, variation of the thickness of the storage layers (Eqs 26, 27); in addition, the 425
finite difference treatment could be refined. Nevertheless, this study can be adapted and may 426
provide a useful basis for more accurate analysis of the electrochemistry of nanoparticle 427
systems. In the present work we have endeavored to develop a method of analysis of these 428
mechanisms. The theoretical procedure is illustrated on the model case of lithium insertion in 429
anatase nanoparticles studied by cyclic voltammetry or by galvanostatic titration; in particular, 430
it accounts for the high values of the observed capacitive effects. Moreover, it can be easily 431
extended to the analysis of charge-discharge processes under various experimental conditions. 432 433 434 Acknowledgement 435 436
The research leading to these results has received funding from the French National Research 437
Agency under Idex@Sorbonne University for the Future Investments program (No. ANR-11-438
IDEX-0004-02) and the Nature Science Foundation of China (No. 21805209). 439 440 441 References 442 443
1. M. Yoshio, R. J. Brodd, A. Kozawa, Lithium batteries, Springer, New-York (2009), doi: 444
10.1007/978-0-387-34445-4 445
2. R.Van Noorden, Nature, 507, 26–28 (2014), doi: 10.1038/507026a. 446
3. E. Samadani, M. Mastali, S. Farhad et al., Int. J. Energy Res., 40, 379–392 (2016), doi: 447
10.1002/er.3378. 448
4. J. B. Goodenough and Y. Kim, Chem. Mater., 22, 587–603 (2010), doi: 449
10.1021/cm901452z. 450
5. A. S. Aricò, P. Bruce, B. Scrosati, J.-M. Tarascon, and W. van Schalkwijk, Nature 451
Materials, 4, 366-377 (2005), doi: 10.1038/nmat1368.
452
6. R. Malik, F. Zhou and G. Ceder, Nature Materials, 10, 587-590 (2011), doi: 453
10.1038/nmat3065. 454
7. D. Cogswell and M. Bazant, ACS Nano, 6, 2215-2225 (2012), doi: 10.1021/nn204177u. 455
8. G. Oyama, Y. Yamada, R. Natsui, S. Nishimura and A. Yamada, J. Phys. Chem., 116, 456
7306-7311 (2012), doi : org/10.1021/jp300085n 457
9. L. R. De Jesus, P. Stein, J. Andrews, Y. Luo, B.-Xiang Xu and S. Banerjee, Materials 458
Horizons, 5, 486-498 (2018), doi: 10.1039/c8mh00037a.
459
10. K. Gallagher, D. Dees, A. Jansen, D. Abraham and S. Kang., J. Electrochem. Soc., 159, 460
A2029-A2037 (2012), doi: 10.1149/2.015301jes. 461
11. D. Baker and M. Verbrugge, J. Electrochem. Soc., 159, A1341-1350 (2012), doi: 462
10.1149/2.002208jes. 463
12. D. Bernardi, R. Chandrasekaran and J. Young Go, J. Electrochem. Soc., 160, A1430-464
A1441 (2013), doi: 10.1149/2.042309jes. 465
13. A. Mistry, F. Cano-Banda, D. Law, A. Hernandez-Guerrero and P. Mukerjee, J. Mater. 466
Chem., 7, 8882-8888 (2019), doi: 10.1039/c9ta01339c.
467
14. L. Kavan, J. Rathouský, M. Grätzel, V. Shklover, and A. Zukal, J. Phys. Chem. B, 104, 468
12012–12020 (2000), doi: 10.1016/S0167-2991(03)80455-X. 469
15. D. Fattakhova, L. Kavan, and P. Krtil, J. Solid State Electrochem, 5, 196–204 (2001), doi: 470
10.1007/s100080000138. 471
16. F. Lantelme and M. Chemla, Journal of Electroanal. Chem., 396, 203–209 (1995) doi: 472
10.1016/0022-0728(95)03933-8. 473
17. F. Lantelme, Computer Simulation of Electrochemical Processes, p.180 in Q. Zhiyu, X. 474
Zhihong and L. Honglin (eds), Computerized Physical Chemistry of
M
etallurgy and 475Materials, The Metallurgical Industry Press, (1999) Beijing. 476
18. D. Britz, Digital Simulation in Electrochemistry, Springer-Verlag, Berlin Heidelberg, 477
(1981), doi: 10.1007/978-3-662-21819-8. 478
19. W. Li, D. Corradini, M. Body, C. Legein, M. Salanne, J. Ma, K. W. Chapman, P. J. 479
Chupas, A.-L. Rollet, C. Julien, K. Zhagib, M. Duttine, A. Demourgues, H. Groult, and D. 480
Dambournet, Chem. Mater., 27, 5014–5019 (2015), doi: 10.1021/acs.chemmater.5b01407. 481
20. S. Srinivasan and J. Newman, J. Electrochem. Soc., 151, A1530-A1538 (2004), doi: 482
10.1149/1.1785012. 483
21. F. Lantelme, A. Mantoux, H. Groult, and D. Lincot, J. Electrochem. Soc., 150, A1202– 484
A1208 (2003), doi:10.1149/1.1595658. 485
22. F. Lantelme, A. Mantoux, H. Groult, and D. Lincot, Solid State Ionics, 177, 205–209 486
(2006), doi: 10.1016/j.ssi.2005.10.024. 487
23. L. S. Darken, Trans. Am. Inst. Mining Metall. Eng., 175, 184 (1948). 488
24. F. Lantelme, H. Groult, and N. Kumagai, Electrochim. Acta, 45, 3171–3180 (2000), doi: 489
10.1016/S0013-4686(00)00474-6. 490
25. M. D. Levi, and D. Aurbach, J. Phys. Chem. B, 101, 4630-4640 (1997), doi: 491
10.1021/jp9701909. 492
26. J. Heinze, Berichte der Bunsengesellschaft für physikalische Chemie, 85, 1085–1086 493
(1981), doi: 10.1002/bbpc.19810851204. 494
27. M. W. Verbrugge and C. W. Tobias, J. Electrochem. Soc., 132, 1298–1307 (1985), doi: 495
10.1149/1.2114106. 496
28. F. Lantelme and A. Salmi, Journal of Physics and Chemistry of Solids, 57, 1555–1565 497
(1996), doi: 10.1016/0022-3697(96)00061-3. 498
29. T. Ohzuku, T. Kodama, and T. Hirai, Journal of Power Sources, 14, 153–166 (1985), doi: 499
10.1016/0378-7753(85)88026-5. 500
30. S. Y. Huang, L. Kavan, I. Exnar, and M. Grätzel, J. Electrochem. Soc., 142, L142–L144 501
(1995), doi: 10.1149/1.2048726. 502
31. A. A. Belak, Y. Wang, and A. Van der Ven, Chem. Mater., 24, 2894–2898 (2012), doi: 503
10.1021/cm300881t. 504
32. M. Wagemaker, W. J. H. Borghols, and F. M. Mulder, J. Am. Chem. Soc., 129, 4323– 505
4327 (2007), doi: 10.1021/ja067733p. 506
33. K. Shen, H. Chen, F. Klaver, F. M. Mulder, and M. Wagemaker, Chem. Mater., 26, 1608– 507
1615 (2014), doi: 10.1021/cm4037346. 508
34. J. Ma, W. Li, B. J. Morgan, J. Światowska, R. Baddour-Hadjean, M. Body, C. Legein, O. 509
J. Borkiewicz, S. Leclerc, .H. Groult, F. Lantelme, C. Laberty-Robert, and D. Dambournet, 510
Chem. Mater., 30, 3078–3089 (2018), doi : 10.1021/acs.chemmater.8b00925.
511
35. W. Li, M. Body, C. Legein, O. J. Borkiewicz, and D. Dambournet, Eur. J. Inorg. Chem., 512
2017, 192–197 (2017), doi: 10.1002/ejic.201601160. 513
36. J. Wang, J. Polleux, J. Lim, and B. Dunn, J. Phys. Chem. C, 111, 14925–14931 (2007), 514
doi: 10.1021/jp074464w. 515
37. B. E. Conway, V. Birss, and J. Wojtowicz, J. Power Sources, 66, 1–14 (1997), doi: 516
10.1016/S0378-7753(96)02474-3. 517
38. T. Brezesinski, J. Wang, J. Polleux, B. Dunn, and S. H. Tolbert, J. Am. Chem. Soc., 131, 518
1802–1809 (2009), doi: 10.1021/ja8057309. 519
39. A. Salmi, Y. Berghoute, and F. Lantelme, Electrochim. Acta, 40, 403–411 (1995), doi: 520
10.1016/0013-4686(94)00288-C. 521
40. S. Srinivasan, Fuel cells. From Fundamental to Applications, Ch. 2, Springer (2006), doi: 522
10.1007/0-387-35402-6. 523
Figures 525
526
527
Figure 1. Diagram illustrating the transport in surface layers. 528 529 530 531 532 533 534 535
Figure 2. Platelet-like nano-particle31, simplified form used for the calculation. 536
538
Figure 3. Open circuit potential curve, anatase and fluorinated anatase (yLi+) is the intercalation 539 ratio). 540 541 542 543 544 545
Figure 4. Experimental (continuous line) and fitted (dashed line) cyclic voltammograms of 546
lithium insertion/deinsertion in anatase and fluorinated anatase; electrode surface: 0.78 cm2. 547
Sweep rates: (a) ν=10 mV s-1, (b) ν= 5 mV s-1, (c) ν=2 mV s-1. 548
549 550
551
Figure 5. Experimental (continuous line, after 2 cycles activation) and fitted (dashed line) 552
cyclic voltammograms of lithium insertion/deinsertion in fluorinated anatase; electrode surface: 553 0.78 cm2; scan rate: ν= 0.05 mV s-1. 554 555 556 557 558 559 560
Figure 6. Cyclic voltammograms of lithium insertion/deinsertion in anatase and fluorinated 561
anatase; electrode surface: 0.78 cm2; shaded region, capacitive current determined from the 562
procedure using Eq. 25 at ν=10 mV s-1. 563
565
566
567
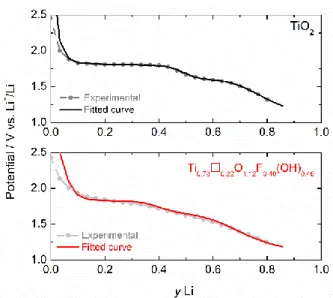
Figure 7. Galvanostatic intermittent titration. (a) Experimental and (b) fitted curves in anatase 568
and fluorinated anatase; current density: 84 µA cm-2, duration of the galvanostatic charge: 1200 569
s, relaxation time: 20 h (yLi+ is the intercalation ratio). 570 571 572 573 574 575
Figure 8. Diffusion coefficient deduced from the different sequence of the galvanostatic 576
intermittent titration curves. Calculated enhancement factors (Eq. 8, with φ = 0.26). (a): TiO2;
577
(b): Ti0.78□0.22O1.12F0.40(OH)0.48.
579 580
Table Content 581
582
Table 1. Characteristic quantities of the system. 583
584
Dimension of nano-particles
For 1 cm2 (electrode surface)
a (nm) b (nm) np, number of nano-particles Sp, electrochemical interface, (cm2) 3.0 12 6.18×10¹⁵ 556 585
Table 2. Values of the parameters used to describe the evolution of the activity coefficient (Eq. 4). 586
F--TiO2 represents Ti0.780.22O1.12F0.40(OH)0.48.
587
Logarithms of the activity coefficients, ln fj. 588
ln f1 ln f2 ln f3 ln f4
TiO2 -41 -57 -63 -138
F-TiO2 -40 -58 -63 -172
589
Concentrations at the transition points, cTj (mol cm-3)
590
cT1 cT2 cT3 cT4
TiO2 0.057 0.035 0.025 0.0004
F-TiO2 0.057 0.033 0.019 0.0002
591
Steepness factors to describe the changes of the activity coefficient, Ψj (cm3 mol-1)
592 Ψ1 Ψ2 Ψ3 Ψ4 TiO2 83 195 333 338 F-TiO2 91 143 257 273 593 594
Table 3. Values of the diffusion coefficient at the interface, D* (Eq. 10). Maximum value of the 595
storage thickness, δmax (Eq. 26), and pseudo-capacitance associated to that thickness (Eq. 29). 596 597 D* (10-17 cm2 s-1) δmax, ( nm) Cmax (mF cm-2) TiO2 1.3 2.0 283 F-TiO2 4.0 4.7 978 598