HAL Id: hal-01588497
https://hal.archives-ouvertes.fr/hal-01588497
Submitted on 15 Sep 2017
HAL is a multi-disciplinary open access archive for the deposit and dissemination of sci-entific research documents, whether they are pub-lished or not. The documents may come from teaching and research institutions in France or abroad, or from public or private research centers.
L’archive ouverte pluridisciplinaire HAL, est destinée au dépôt et à la diffusion de documents scientifiques de niveau recherche, publiés ou non, émanant des établissements d’enseignement et de recherche français ou étrangers, des laboratoires publics ou privés.
Theoretical investigation of Vernier effect based sensors
with hybrid porous silicon-polymer optical waveguides
Paul Azuelos, Pauline Girault, Nathalie Lorrain, Luiz Poffo, Isabelle Hardy,
Mohammed Guendouz, Monique Thual
To cite this version:
Paul Azuelos, Pauline Girault, Nathalie Lorrain, Luiz Poffo, Isabelle Hardy, et al.. Theoretical investi-gation of Vernier effect based sensors with hybrid porous silicon-polymer optical waveguides. Journal of Applied Physics, American Institute of Physics, 2017, 121 (14), pp.144501. �10.1063/1.4980010�. �hal-01588497�
1
Theoretical investigation of Vernier effect based sensors with hybrid porous
silicon-polymer optical waveguides
Paul Azuelos1, Pauline Girault1, Nathalie Lorrain1, Luiz Poffo1, Isabelle Hardy1,2, Mohammed Guendouz1 and Monique Thual1
1
UMR FOTON, CNRS, Université de Rennes 1, ENSSAT, F22305 Lannion, France
2
UMR FOTON, CNRS, IMT Atlantique, F29238 Brest, France
A new combination of porous silicon and polymer optical waveguides is investigated for two different designs of Vernier effect based sensors for the surface detection of Bovine Serum Albumin molecules (BSA). The hybrid structures studied consist of two cascaded micro-resonators for one and a micro-resonator cascaded with a Mach-Zehnder for the other. Because of its high specific surface and bio-compatibility, we use porous silicon to implement the waveguides in the sensing part of the sensor into which BSA molecules are grafted. Polymer waveguides are then used for the reference part of the sensor because of their low optical losses. We consider the opto-geometric parameters of both waveguides for single mode propagation. Finally, optimized designs, taking into account standard experimental wavelength shift measurement limitation are presented for both structures. We demonstrate a theoretical Limit Of Detection (LOD) of 0.019 pg.mm-2 and a sensitivity of 12.5 nm/(pg.mm
-2
) with these hybrid sensors. To our knowledge, these values are lower by a factor of 8 for the LOD and higher, by a factor of 200 for the sensitivity, as compared to state of the art Vernier effect biosensors.
I. INTRODUCTION
Nowadays, sensors for biological and medical applications are of great interest for detecting low concentrations of specific analytes in biological fluid or gas samples1. Various kinds of analysis methods, especially those based on the Surface Plasmon Resonance (SPR) effect, have been studied and some of them are commercially available with low Limits Of Detection (LOD) of 10-5 to 10-8 Refractive Index Unit (RIU) for homogeneous detection.2 Alternative structures based on refractive index variation such as micro ring resonators (MRs) and Mach-Zehnder (MZ) interferometers have also demonstrated both good sensitivity and limit of detection as low as 10-6 RIU.3,4
Porous silicon (PSi) is a particularly interesting material for sensing applications as it makes it possible to reach high sensitivities for homogeneous detection based on its refractive index variation caused by analytes, localized not only in the environment of the micro resonator (MR), but also in the porous core of the waveguide. Recently, a first publication on a PSi MR sensor gave sensitivities up to 380 nm/RIU for homogeneous detection based on refractive index variation.5 PSi is also biocompatible as its surface can be functionalized for grafting biomolecules. Surface detection differs from homogeneous detection in that the interaction between the EM-field and the grafted biomolecules is enhanced when the waveguide specific surface increases. Clearly, PSi is therefore interesting
2
for surface detection, as its high specific surface up to 800 m2/cm3 dramatically increases the waveguide sensitivity for surface detection of specific molecules which are grafted into the pores.6 A theoretical PSi MR surface sensitivity to Bovine Serum Albumin (BSA) has been calculated up to 0.02 nm/pg/mm2.7
One way to greatly increase the sensitivity of the sensor is to employ the Vernier effect8 using interferences between two or more interferometers. This effect has already been used, in case of homogeneous evanescent detection, with different designs of either a cascaded Silicon On Insulator MR9,10 with a sensitivity of 2.1 104 nm/RIU and LOD of 8.3 10-6 RIU, or an MR implemented with Mach-Zehnder interferometers with a sensitivity of 1.55 105 nm/RIU and a LOD of 2 10-6 RIU.11 Evanescent surface detection has also been experimentally studied with two cascaded MZs12 with silicon nitride (SiN) waveguides; a sensitivity of 0.06 nm/(pg.mm-2 ) and a LOD of 0.155 pg.mm-2 were obtained.
The novelty of our present work depends both on the choice of materials including PSi and on a comparative study of two different sensor designs based on the Vernier effect in order to obtain the best contrast, sensitivity and LOD for surface detection application. Theoretical calculations of LOD and sensitivity are respectively 0.019 pg.mm-2 and 12.5 nm/(pg.mm-2) for surface detection. These results are 8 times lower for the LOD and 200 times higher for the sensitivity than for state of the art Vernier effect biosensors.12
In the first section, we introduce the principles of sensors based on a single interferometric structure consisting of one MR or one MZ. The fundamental characteristics and the measurement method based on wavelength shift linked to these kinds of sensors are introduced as well. We then discuss the interest of the two proposed structures, which are based on the Vernier effect, for overcoming the limitations of sensors based on only one MR or one MZ. In a second section, we consider the appropriate choice of materials for these complex structures. This choice include for example, a porous material such as PSi, which is sensitive to refractive index variation induced by analytes grafting on its internal surface for the core of the sensing device; while a material such as a polymer, which leads to low waveguide propagation losses, can be used for the access waveguides and for the reference part of the sensing device. In the last section, we compare two different complex structures to select the best one for sensor applications and finally we point out the interest of the hybrid Vernier effect sensor.
II. THEORETICAL CONCEPTS ON INTERFEROMETERS AND COMPLEX GEOMETRIES
A. Transfer function of one micro resonator
MRs are used as sensors because they allow low limits of detection to be reached and moreover they make high integration possible. The expressions for important parameters and characteristics of the sensor are presented in this part.
In this study, the MR considered consists of two straight access waveguides (an add-pass port and a drop port) and a ring waveguide as shown in Figure 1.a. The input signal,
3
which consists of a broadband wavelength spectrum, is injected from the access waveguide add port into the micro-ring resonator by evanescent coupling. In order to increase the coupling between the access waveguide and the ring waveguide, the racetrack geometry represented in Figure 1.a can be used. The wavelengths , which are in tune with the incident wavelength, resonate, after round trips in the ring, by constructive interference. At the drop port, extinction peaks appear in the output spectrum represented in Figure 1.b. The amount of signal which is coupled in the coupling region between the access and the ring waveguides can be calculated semi-analytically using Marcatili’s theory13 for ridge waveguides or numerically for other waveguide geometries using, for example, 3D BPM14. They are defined similarly to the classical evanescent waveguide coupling configuration by:
- τ and τ’ the amplitude self-coupling coefficients in the access and in the ring waveguides respectively,
- κ and κ’ the amplitude cross-coupling coefficients from the access to the ring waveguide and from the ring to the access waveguides respectively,
- in case of symmetrical coupling, τ = τ’ and κ = κ’,
The relationship between the field amplitude and the coupling coefficients in the coupling region are developed by Yariv. 15 The complex transmission function which gives the ratio between the output drop port and the input add port optical fields, is given by7:
(1)
with:
(2)
And with the attenuation given by:
(3)
where L is the perimeter of the resonator, the MR propagation losses, the MR propagation constant, is the effective index of the propagated mode calculated semi-analytically using the effective index method16 and is the coupling loss coefficient between the access and ring waveguides. In case of lossless coupling =1 and . In the following, we will only consider lossless coupling.
4
FIG.1. (a) Schematic of an add-drop MR and (b) Normalized transmission spectrum at the drop port waveguide of the MR.
The expression for the Full Width at Half Maximum (FWHM) of the peaks in the transfer function at the drop port of a single MR as presented in Figure 1.b, is given by17:
(4)
with .
The quality factor (Q) is given by:
(5) with: (6) where p is an integer.
The Free Spectral Range (FSR) is defined as the difference in wavelength between two consecutive peaks and is given by:
(7)
with the group index defined by:
(8)
The MR presented above can be used as sensor based on surface detection of target molecules because the contrast and the resonant wavelengths depend on the waveguide refractive index. If the refractive index of the waveguide changes when target molecules are
5
grafted onto the internal surface of the porous waveguides, as shown in Figure 2.a for evanescent sensing, the resonant wavelength of the MR will shift and this shift can be measured. The important parameters of the MR sensor are: the minimum quantity of detected target molecules grafted, which is the Limit Of Detection (LOD) and the shift of the resonant wavelength, with the quantity of target molecules grafted onto the internal surface of the porous waveguide, which is the sensitivity.
FIG.2. Illustration of target molecule grafting: (a) MR optical waveguide, based on evanescent sensing, before and after target molecule grafting. (b) Output spectra of the MR before and after target BSA molecule grafting
In order to measure the quantity of molecules grafted onto the waveguide, a wavelength shift measurement method is studied. This method is based on the measurement of the displacement of the resonant wavelength ( as shown in Figure 2.b) induced by the
variation of effective refractive index of the waveguide when target molecules are grafted onto the surface. This method reaches the high sensitivity and low LOD that can be achieved using a high quality factor MR.
In our simulations, the molecules grafted onto the waveguide are Bovin Serum Albumin (BSA) molecules. The theoretical calculation of the surface sensitivity of PSi waveguides, with BSA grafting into the waveguide, will be presented further in part III.A. The sensitivity of a single MR for wavelength shift measurement is given by:
(9) with the mass of target molecules grafted on the waveguide per unit of surface.
To increase the sensor sensitivity, a small variation of must lead to a large variation
of . The interaction between the EM-field and the grafted molecules to be analyzed must
be maximized to obtain this high variation of versus and so to enhance the sensitivity of the waveguide defined as:
6
The Limit of Detection (LOD) is the minimum quantity of target molecules per unit of surface which can be measured by the sensor. For a single MR, it is given by:
(11)
with the standard deviation of all the noise contributions.18
The range of grafted molecule mass per unit area that can be measured depends both on the sensitivity and the free spectral range and is given by:
(12)
The values of and must be optimized to get the optimum values of and/or . For this purpose, perimeter and coupling length of the racetrack resonator must be adapted to the chosen material.
B. Transfer function of one Mach-Zehnder
Mach-Zehnder interferometers (MZ) have been demonstrated experimentally as surface PSi sensors6 and in Vernier effect structures with an MR filter or an MZ filter12. The MZ structure represented in Figure 3, is composed of two arms: a reference arm and sensor arm which will be exposed to the target molecules (BSA). The transfer function of an MZ is given by:
with and
. is the
length of the reference arm and is the length of the sensor arm, and
are the effective indices of the sensor arm and reference arm respectively,
and are the propagation losses in the reference arm and sensor arm respectively.
7
Just as for the MR, the MZ is sensitive to refractive index variation and the expression for its sensitivity is given by:
(14)
with the effective difference of group refractive index between the MZ arms:
(15)
In the next section, MZs and MRs are cascaded in Vernier effect structures to enhance their sensitivity.
C. Vernier effect based sensors
In order to improve the sensitivity, Vernier effect based sensors can be used. Two Vernier effect structures called “cascaded” for Figure 4.a and “MZ + filter” for Figure 4.b are simulated in this paper with a combination of polymer and PSi materials, which are presented later.
To this end, we now introduce the fundamental theoretical concepts of Vernier effect based sensors.
Each structure contains two interferometers. In this paper, the first one, called “filter” is used as a spectral reference and the second one, called “sensor” is exposed to the BSA target molecules and will be sensitive to their variation of concentration. The filter is protected from the solution by a superstrate of low refractive index polymer that masks all the structure except the sensor part which is exposed to the target molecules. A reservoir is etched above the polymer superstrate in order to graft target molecules onto the waveguides with a microfluidic setup. The effective index of the sensor waveguide then changes when target molecules are grafted onto the sensor waveguides inducing a shift of the resonant peaks pattern envelop.
A sensor ring is used for the cascaded structure in Figure 4.a or a sensor Mach-Zehnder is used for the MZ+filter structure in Figure 4.b.
All waveguide dimensions and material compositions are presented in parts III.A and III.B.
8
FIG.4. Schematic configuration of Vernier effect based sensors: (a) Cascaded resonators and (b) Mach-Zehnder interferometer with filter. Hybrid PSi and SU8 waveguides will be presented in part III.B.
The Vernier effect is illustrated in Figure 5. The transfer functions of the filter and sensor are represented in Figure 5.a. The difference of free spectral range between the filter and sensor ( ) generates the Vernier effect. Indeed, the transfer functions of the sensor and the filter interfere with each other, so that peaks that are at the same resonant wavelength for both filter and sensor have high contrast at the output port and peaks with no common resonant wavelength have lower contrast.
9
FIG.5. Vernier effect for two cascaded micro resonators: (a) Transfer function of the filter ring in dotted black line and sensor ring before and after grafting of BSA molecules for a quantity of 10 pg/mm2 in dashed blue line and red full line respectively; (b) Transfer function at the output of the cascaded structure presented in Figure 3(a) for a 1500 μm perimeter sensor and 1400 μm perimeter filter, without BSA in dotted blue line and with a BSA quantity of 10 pg/mm2
in full red line.
A constructive interference pattern, which can be fitted with an envelope function9 appears at the output of the Vernier effect structure for the condition:
(16) The envelope function shifts when the target molecules are grafted onto the waveguide surface. Such an envelope function, for a cascaded ring configuration, is illustrated in Figure 4.b. Its sensitivity can be calculated with
, which is the shift of the envelope function
after the grafting of target molecules. The Vernier effect sensitivity is the product of the sensitivity of a single MR ring and the factor , which is given by :
10
The condition (17) important in achieving high sensitivities compared to a single MR. Two expressions for sensitivities have been defined for Vernier effect structures. The first expression is defined, for cascaded configuration, by :
(18)
An analogous expression for the sensitivity of MZ+filter is given by:
(19) The free spectral range expression for the envelope function is the same for all structures. It is equivalent to the envelope period which is given by:
(20) Vernier effect based sensors are limited in LOD by the discreteness of their output spectrum. Indeed the minimum refractive index change is related to the difference between the FSRs of the filter and the sensor, and by the sensitivity of a single MR and MZ as defined in equations (9) and (14): (21) (22)
The maximum quantity of grafted molecules which can be measured in this setup can be calculated from the free spectral range and the sensitivity of the system and is given by:
(23)
The range of grafted molecule mass per unit area that can be measured with this setup is the same as for a single MR structure.
11
III. DESIGN OF A POLYMER-POROUS SILICON VERNIER EFFECT BASED SENSOR
A. Theoretical study of the surface sensitivity of PSi waveguides
PSi is fabricated by electro-chemical etching and an oxidation step is necessary to reduce its hydrophobicity and instability. It has a refractive index of between 1.4 and 2.2 at 1.55 µm wavelength, depending on the manufacturing conditions. Indeed, the refractive index of PSi depends on the porosity of the material which is controlled by electrochemical etching parameters, (current density, etching time and chemical solution preparation), the oxidation rate of the PSi layers and the choice of the doping type and level of the crystalline silicon substrate.19 The value of the refractive index of the porous material changes when its structure is infiltrated by molecules.
In order to evaluate the refractive index of the PSi core and the sensitivity
of the PSi waveguide configuration defined in III.B, it is necessary to investigate the evolution of the PSi refractive index during the functionalization process and the grafting of BSA molecules.
The functionalization process studied in this paper is based on a previous PSi functionalization process6 that has been optimized for the grafting of BSA molecules onto a PSi waveguide. The PSi structure is partially oxidized in order to chemically stabilize the surface of the porous material and to ease the formation of Si-OH groups which enables SiHx to be fixed during the silanization step of the functionalization process. The core layer functionalization is a 2 step procedure with a first step of silanization with Aminopropyltriethoxysilane (APTES) and a coupling step using Glutaraldehyde (GL) molecules. The BSA, APTES and GL refractive indices are assumed to be constant over the wavelength range studied. It is assumed that the cladding layer is not affected by the functionalization process because of the introduction of a low porosity PSi barrier layer during the fabrication of PSi layers as presented in III.B part. For the chosen PSi configuration, the diameter of the PSi pores in the core layer have been estimated by SEM observations to be about 20nm.
A modeling study and the use of the Bruggeman model developed in6,20 allow the variation of the effective index of a single-mode PSi waveguide with BSA volumic fraction variation in the PSi core layer to be calculated. The effective index method is used to evaluate the variation of the effective index during the grafting of BSA. The result is presented in Figure 6 for the TE00 mode whose sensitivity is better than that of the TM00. The linear slope of the effective index variation with quantity of BSA grafted corresponds to the sensitivity of the sensor waveguide presented above and its value is .
In part III.B, the material is selected in order to allow single-mode propagation in both the polymer and PSi waveguides over the range of effective index presented in Figure 6. In part III.C, characteristics of hybrid PSi-polymer Vernier effect sensors are then determined with the waveguide sensitivity calculated here.
12
FIG.6. Effective index of the TE00 mode in PSi waveguide versus BSA grafting area density.
B. Material selection for optimal light propagation
As mentioned above, PSi is a promising material for label free sensing since its high specific surface is interesting for molecule trapping and for surface functionalization for biomedical applications.5,6,19,21
FIG.7. (a) Bulk single-mode waveguide: Evanescent field interaction between the EM-beam and the grafted molecules to be analyzed; (b) PSi ridge single-mode waveguide consisting of two porous layers: the porous cladding confinement layer has a lower porosity than the squared core layer. Direct volume interaction of the EM-field with the grafted molecules which are to be analyzed.
The effective indices of such PSi waveguides are more dependent on the grafting of molecules as indicated on Figure 7.a since a large quantity of molecules can be grafted because of the high porous specific surface. Moreover, the molecules, which have been grafted into the core of the waveguide, interact with the strong EM-field confined in the waveguide in contrast to the purely evanescent field detection of grafted molecules with non-porous materials, as represented in Figure 7.b.
Otherwise, the high specific surface of PSi enhances the sensitivity of the PSi waveguide22 compared to classical interactions based on evanescent field interaction with grafted molecules.
13
However, high losses values of 20 dB/cm have been obtained in PSi ridge waveguide.5 These losses depend on the fabrication quality, the dimensions of the waveguide, the porosity and the oxidation of PSi layers and are the main limitation on the use of PSi for the entire sensor.
As propagation in a PSi waveguide significantly reduces the amount of transmitted signal power, this suggest the use of low propagation loss polymer waveguides for the access waveguides and filter in this paper so as to reduce the losses in the Vernier effect structures described in part II.C. Indeed, these polymer waveguides can be easily implemented in the structures. In this case, PSi can be used just for the portion of the waveguide sensitive to the BSA grafting.
For this reason, as previously presented for the cascaded structure, in Fig.4.a, only the MR exposed to BSA grafting and the access part of the waveguide which is used to couple light to the MR are made with PSi material. In the MZ+Filter structure of Figure.4.b, only a part of one arm of the MZ is in PSi.
In the hybrid structure, the waveguides must be carefully adjusted to allow for single-mode propagation in both materials and best coupling between the polymer and PSi waveguides. The coupling suggested is “butt coupling” for both “cascaded” and “MZ+filter” structures and is presented schematically in Figure 8. Butt coupling is a good alternative to classical evanescent coupling between the polymer and PSi waveguides. This coupling may be limited by both the effective index mismatch of PSi and polymer waveguides which can appear because of measurement uncertainties in the order of 10-2 refractive index of the PSi linked to its fabrication6 and by the high effective index variation represented in Figure 6, which appears during grafting.
FIG.8. Butt coupling configuration between SU8 polymer waveguide and PSi waveguide on PSi cladding isolated by a barrier layer.
As PSi is prepared by electro-chemical etching on the crystalline Si wafer, the PSi waveguides must be fabricated before the polymer waveguides. In the present study, SU8 polymer is used to fabricate the polymer waveguide core. The refractive index of SU8 is 1.5791 (@ 1.55μm), so the refractive index of the PSi cladding layer refractive index filled with air must be less this. The core dimensions of each waveguide must be calculated to allow single-mode propagation and correct coupling between the waveguides.
In order to optimize the butt coupling of the polymer and PSi waveguides, the field profiles and propagation constants of the two waveguides must be matched, so the effective indices and the dimensions must be close in order to maximize mode matching between both waveguides.
14
The refractive index of the PSi core waveguide is calculated with the theoretical model presented in part III.A. PSi losses are expected to be equal to 20 dB/cm as the waveguide size and oxidation rate have been chosen close to previously reported experimental oxidation.5 It is chosen such that it stays close to the SU8 refractive index during all of the grafting process. It should be noted that the PSi refractive index can change from 1.54 before grafting to a maximum of 1.62 (@ 1.55 μm) in response to the grafting of a complete single layer of BSA into PSi pores. The PSi cladding layer refractive index is 1.40 (@ 1.55μm). The dimensions for single-mode propagation are represented in Figure 9.a. Dimensions of 1.5 μm width and 1.5 μm height are selected for both waveguides, which gives TE single-mode propagation and fabrication tolerances of 0.25 μm. The effective indices of the SU8 waveguide and the PSi waveguide, before and after the grafting of BSA molecules, is represented in Figure 9.b.
These configurations give single-mode conditions for both structures and the maximum effective index mismatch for TE mode is 3%, which limits reflections at the interface between waveguides. As the propagation mismatch significantly disturbs the evanescent coupling between SU8 and PSi waveguides, the SU8 waveguide is butt coupled to a PSi waveguide before evanescent coupling in the sensor ring of the “cascaded” configuration. Butt coupling efficiency is calculated between a SU8/PSi and a PSi/SU8 waveguide interface using commercial FIMMWAVE software. The obtained coupling is 98% for TE mode and thus will not significantly affect the sensor readout.
The barrier layer which stops solution or polymer infiltration to the PSi substrate can be a low porosity PSi layer with its pores filled with SiO2 by volumic expansion during a
process oxidation step.20 A low index polymer superstrate of poly(2,2,2 methacrylate of trifluoro-ethyle) (PMATRIFE) is then deposited7 and a reservoir is etched above the PSi waveguide for functionalization and BSA grafting.
FIG.9. (a) Single-mode region delimited above the solid lines (no-guiding region limit) and below the dotted lines (multimode region limit) for the PSi waveguide before BSA grafting in blue, after BSA grafting in red and for the polymer waveguide in black. Single-mode region common to all configuration is highlighted with the selected square waveguide size of 1.5 μm; (b) Effective index of the PSi waveguide before BSA grafting, in blue, after BSA grafting, in red and of the polymer waveguide, in black.
15
C. Micro resonators coupling coefficient selection for maximum contrast interference pattern
Since high loss PSi waveguides occur in the Vernier effect structure, the contrast of the interference pattern is the main limiting factor for this structure. Therefore, the coupling coefficient of each MR of the structure must be carefully selected to obtain high contrast interference patterns. The contrast is defined as the difference between the minimum and maximum values of the envelope function. The envelope function can be fitted on the maxima of the resonant wavelengths of the transmission function of the Vernier effect sensor.9 The relation between coupling coefficients and envelope functions have been studied for cascaded MRs with constant losses in the structure.23
In our optimization design, the coupling coefficient for maximum contrast is calculated and compared to the critically coupled contrast for each MR (sensor and filter) and for each configuration using the transfer function of the complex structures given by:
(24) (25) with (26) and (27)
16
and are defined in equation (1) with and adapted to the material. The propagation losses are 2 dB/cm for polymer waveguides24 and
20 dB/cm
for PSi waveguides5. Propagation losses between interferometers are not taken into account as they can be minimized by optimizing the design of the sensor.
In order to ease the characterization of the sensor, the coupling coefficient is selected to maximize the contrast of the envelope function, since it has been demonstrated that critical coupling does not give the maximum contrast.23 Other strategies of optimization are possible such as reducing the envelope FWHM width by taking the critical coupling of each MR to ease determining the maximum of the envelope function, but in this case the contrast is not optimized.
Using equations (24) and (25), the transmission functions are calculated while varying the coupling coefficient of the filter and sensor MR for both the cascaded structure and for the MZ+filter structure. Maximum contrast is obtained for a coupling coefficient other than critical coupling for both configurations. It does appear that critical coupling gives contrast values near 90% of the maximum contrast for cascaded and MZ+filter hybrid configurations. So critical coupling could be a good choice for these geometries to get both high contrast and low envelope FWHM.
According to the analytical expressions of part II.C, the relation between maximum sensitivity, minimum LOD and Lsensor can be calculated, when FSRvernier is limited to
FSRvernier,max assuming that and that they are the same for both
structures:
(28)
Then the LOD is:
(29) The sensitivity and LOD of the cascaded and MZ+filter configurations are calculated within technological and characterization limits. FSRvernier is limited to 100 nm in the
wavelength range of 1500-1600 nm in order to be able to use these biosensors with common laboratory broadband sources and Optical Spectrum Analyzers. In addition, both PSi and polymer optical parameters are well known over this wavelength range. The contrast dependence on is calculated and is represented in Figure 10.a. The sensitivity and LOD are shown in Figure 10.b. As the length of PSi increases in the MZ or MR, the contrast of and the amplitude of are reduced, leading to a reduction in the contrast of the envelope functions and . This means that a limiting value for can be determined depending on the limiting value of the envelope contrast that
can be detected by the experimental setup. The MZ+filter configuration gives around 30% better contrast than cascaded configuration which should ease the characterization of this structure. On the other hand, the values of sensitivity and LOD are improved when
17
waveguide sensitive to BSA grafting increases. Thus, contrast and sensitivity may need to be traded off to detect smaller amounts of BSA.
FIG.10. (a) Maximum contrast (solid blue) for MZ+filter and cascaded configuration (dotted blue); (b) Minimum LOD (solid red) and maximum sensitivity (dotted blue) dependence on PSi waveguide length for both configuration with constant FSRvernier=100 nm.
To select the best configuration for Vernier effect sensors, technological and characterization limits are taken into account when obtaining the results presented in Figure 10.a and 10.b. The maximum length of the PSi waveguides is limited to 6500 μm to limit PSi absorption. This condition gives an envelope contrast of more than 1% for both designs presented in Figure 10, which is enough for spectrum characterization.6 The minimum length for MR Lsensor, Lfilter and Lreference is 600μm which limits the curvature losses. The waveguide
characteristics have been defined in part III.B above.
To select an optimal configuration, LOD and sensitivity are calculated for
=6500 μm using variation steps of 1 μm for and . Best sensor
performances are summed up in Table 1 within the limitations presented above. Both sensors achieve sensitivities better than 12 nm/(pg.mm-2) and LODs of less than 0.020 pg.mm-2 which are close to the limit values of and calculated with equation (28) and (29).
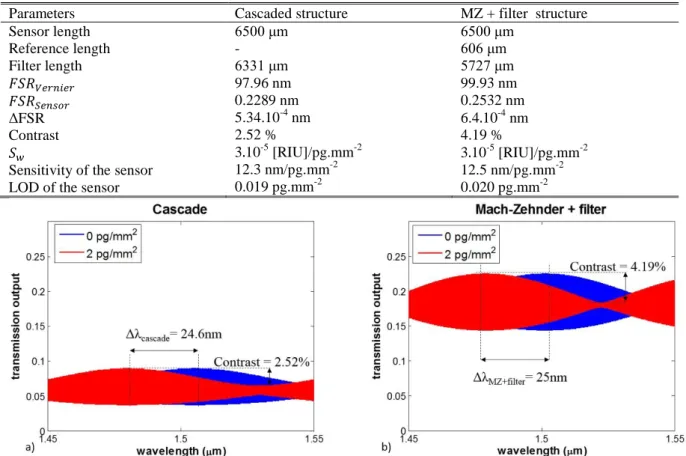
For the optimized structure presented in Table 1, the contrast is 2.5% for the cascaded structure and 4.2% for the MZ+filter structure, so the envelope function will be detectable. Moreover, the advantage of the hybrid structure is made clear if the contrast of the same structure, with both filter and sensor interferometers fabricated in PSi is calculated. Now, the contrast is reduced because of the high propagation losses of the PSi waveguide as compared to the polymer waveguide and in this case, the contrast falls to 0.4% for the cascaded structure and to 0.6% for the MZ+filter structure. So the contrast is multiplied by 6 with the hybrid structure as compared to the PSi structure which is very useful for easing detection. The interference pattern and its shifts with BSA grafting are represented in Figure 11 for the optimized geometries. For the Vernier effect sensor application with the parameters of Table 1, only a fraction of a complete single layer of BSA grafting is studied up to pg.mm-2. In order to study the grafting of a full single layer, a multi-sensor strategy with increasing values of can be adopted to incrementally reduce presented in Equation (23) and LOD.
18
TABLE I. Optimized parameters for hybrid polymer-PSi Vernier effect based sensors
Parameters Cascaded structure MZ + filter structure
Sensor length 6500 μm 6500 μm Reference length - 606 μm Filter length 6331 μm 5727 μm ΔFSR Contrast
Sensitivity of the sensor LOD of the sensor
97.96 nm 0.2289 nm 5.34.10-4 nm 2.52 % 3.10-5 [RIU]/pg.mm-2 12.3 nm/pg.mm-2 0.019 pg.mm-2 99.93 nm 0.2532 nm 6.4.10-4 nm 4.19 % 3.10-5 [RIU]/pg.mm-2 12.5 nm/pg.mm-2 0.020 pg.mm-2
FIG.11. (a) Transmission output of cascaded structure with optimized coupling coefficients using the parameters presented in Table 1; (b) Transmission output of MZ+Filter structure with optimized coupling coefficients with parameters presented in Table 1.
The sensitivity of a single MR with value presented in Table 1 and calculated with equation (9) is 0.0287 nm/(pg.mm-2). This value is similar to the sensitivity found in22 with a PSi waveguide. The Vernier effect sensitivity gain Gv presented in Equation (17) of a
cascaded structure compared to a single MR is then and the gain for the MZ+filter is similar with . Clearly, Vernier effect hybrid structures are very interesting for enhancing sensitivity as compared to single MR or MZ for enhancing sensitivity. Moreover, with a value of less than 0.020 pg.mm-2, the LOD is greatly enhanced when using PSi material as compared to the SiN evanescent waveguide Vernier effect sensor presented by 12.
IV. CONCLUSION
A guideline for hybrid PSi-polymer integration on Si-substrate has been presented and the usefulness of this hybrid material combination for Vernier effect sensors application is discussed. The selection of waveguide design for single-mode propagation and optimized sensitivity are presented and a waveguide surface sensitivity to BSA grafting of 3.10-5 RIU/(pg.mm-2) is calculated. A butt coupling strategy between polymer and PSi waveguides is presented and single mode propagation conditions for both waveguides are detailed. After this, the “MZ+filter” and “cascaded” structures are optimized in order to maximize sensitivity and LOD with the contrast kept above 1% in order to use these structures in standard
19
wavelength shift measurements. A LOD as low as 0.019 pg.mm-2 is calculated for the cascaded structure with sensitivities as high as 12.5 nm/(pg.mm-2) for the MZ+filter structure. These calculated values are times 8 lower for the LOD and times 200 higher for the sensitivity as compared to state of the art Vernier effect biosensors.12
Acknowledgments
This work is funded by Lannion Trégor Communauté, Région Bretagne and the French
government.
References:
1
C-Y. Chao, L.J Guo “Design and optimization of microring resonators in biochemical sensing applications”, Journal of Lightwave technology, Vol.24, No.3, p.1395 (2006).
2X. Fan, I. M. White, S. I. Shopova, H. Zhu, J. D. Suter, Y. Sun “Sensitive optical biosensors
for unlabeled targets : a review” Analytica Chimica Acta, Vol.620,No.1-2, p.8-26 (2008).
3
C. Ciminelli, F. Dell’Olio, D. Conteduca, C.M. Campanella, M.N. Armenise “High performance SOI microring resonator for biochemical sensing”, Optics and Laser technology, Vol.59, p.60-67 (2014).
4
D.Yuan, Y. Dong, Y. Liu, T. Li, “Mach-Zehnder Interferometer Biochemical Sensor Based on Silicon-on-Insulator Rib waveguide with large cross section”, Sensors, Vol.15, No.21, p.500-517 (2015).
5
G.A. Rodriguez, S. Hu, M. Weiss “Porous silicon ring resonator for compact, high sensitivity biosensing applications”, OSA, Vol.23, No.6, p.7111-7119 (2015).
6
N. Lorrain, M. Hiraoui, M. Guendouz, L. Haji “Functionalization control of porous silicon optical structures using reflectance spectra modeling for biosensing applications”, Materials Science and Engineering: B, Vol.14, No.176, p.1047-1053 (2011).
7
P. Girault, J. Lemaitre, M. Guendouz, N. Lorrain, L. Poffo “Micro-resonators based on integrated polymer technology for optical sensing”, SPIE Europ conference 2014, Proc. of SPIE Vol. 9141-21, Brussels, Belgium (14-17 April 2014).
8
P. Saeung, P.P. Yupapin, “Vernier effect of multiple-ring resonator filters modeling by a graphical approach”, Optical Engineering, Vol.46, No.7 (2007).
9
T. Claes, W. Bogaerts, P. Bienstman, “Experimental characterization of a silicon photonic biosensor consisting of two cascaded ring resonators based on the Vernier effect and introduction of a curve fitting method for an improved detection limit”, Optics Express, Vol.18, No.22 (2010).
10
L. Jin, M. Li, J-J. He, “Highly-sensitive silicon-on-insulator sensor based on two cascaded microring resonators with Vernier effect”, Optics Communications, Vol.284, No.1, p.156-159 (2011).
11
H.Yi, D.S. Citrin, Y. Chen, Z. Zhou ”Dual-microring-resonator interference sensor”, Applied Physics Letters, Vol.95, No.19 (2009).
20
12
X. Tu, J. Song, T-Y. Liow, M. K. Park, J.Q. Yiying, J. S. Kee, M. Yu, G-Q. Lo “Thermal independent Silicon-Nitride slot waveguide biosensor with high sensitivity”, Optics Express, Vol. 20, No. 3, p.2640-2648 (2012).
13
E.A.J. Marcatili “Dielectric Rectangular waveguide and directional coupler for integrated optics”, Bell syst. Tech. J.48, 2071 (1969).
14
M.J. Robertson, S. Ritchie, P. Dayan “Semiconductor waveguides: analysis of optical propagation in single rib structures and directional couplers”, IEE Proceedings, Vol.132, No.6, p.336-342 (1985).
15
A.Yariv “Universal relation for coupling of optical power between microresonators and dielectric waveguides” Electronics Letters, Vol.36, No.4, p.321-322 (2000).
16K.S. Chiang “Dual effective-index method for the analysis of rectangular dielectric
waveguides” Applied Optics, Vol.25, No.23, p.2169-2174 (1986).
17
J. Heebner, R. Grover, T. Ibrahim “Optical microresonators, Theory, Fabrication, and Applications”, Springer Series in Optical Sciences, p.26-31 (2008).
18
I M. White, X. Fan, “On the performance quantification of resonant refractive index sensors”, OSA, Vol.16, No.2 (2008).
19
A. Halimaoui “Porous silicon: material processing, properties and applications”, Springer-Verlag Berlin Heidelberg New York, p.33-52 (1995).
20J. Charrier and M. Dribek “Theoretical study of the factor of merit of porous silicon based
optical biosensors”, Journal of Applied Physics, Vol.107, No.4 (2010).
21
G. Rong, A. Najmaie, J.E. Sipe, S.M. Weiss “Nanoscale porous silicon waveguide for label-free DNA sensing”, Biosensors and Bioelectronics, Vol.23, No.10, p.1572-1576 (2008).
22
P. Girault, N. Lorrain, J. Lemaitre, L. Poffo, M. Guendouz, I. Hardy, M. Gadonna, A. Gutierrez, L. Bodiou, J. Charrier “Racetrack micro-resonators based on ridge waveguides made of porous silica”, Optical Materials B, Vol.50, pp.167-174 (2015).
23
H-T.Kim,M. Yu “Cascaded ring resonator-based temperature sensor with simultaneously enhanced sensitivity and range”, Optics Express, Vol.24, No.9, p.9501-9510 (2016).
24
X.Wang, J. Meng, Y. Yue, J. Sun, X. Sun, F. Wang, D. Zhang “ Fabrication of single-mode ridge SU-8 waveguides based on inductively coupled plasma etching”, Appl. Phys A, Vol.113, p.195–200 (2013).