HAL Id: inserm-00600681
https://www.hal.inserm.fr/inserm-00600681
Submitted on 15 Jun 2011
HAL is a multi-disciplinary open access
archive for the deposit and dissemination of
sci-entific research documents, whether they are
pub-lished or not. The documents may come from
teaching and research institutions in France or
abroad, or from public or private research centers.
L’archive ouverte pluridisciplinaire HAL, est
destinée au dépôt et à la diffusion de documents
scientifiques de niveau recherche, publiés ou non,
émanant des établissements d’enseignement et de
recherche français ou étrangers, des laboratoires
publics ou privés.
Compressive strength of human openwedges: a selection
method
Hélène Follet, Maurice Gotteland, Raphaël Bardonnet, Ana-Maria Sfarghiu,
Jacques Peyrot, Claude Rumelhart
To cite this version:
Hélène Follet, Maurice Gotteland, Raphaël Bardonnet, Ana-Maria Sfarghiu, Jacques Peyrot, et al..
Compressive strength of human openwedges: a selection method. European Physical Journal: Applied
Physics, EDP Sciences, 2004, 25 (2), pp.141-148. �10.1051/epjap:2003090�. �inserm-00600681�
(will be inserted by the editor)
Compressive strength of human openwedges: a selection method
H. Follet1,a, M. Gotteland3 , R. Bardonnet2 , A.M. Sfarghiu1 , J. Peyrot4 , and C. Rumelhart1 1
Laboratoire de M´ecanique des Contacts et des Solides, INSA Lyon, Bˆat. Coulomb, 36 avenue des Arts, 69621 Villeurbanne Cedex, France
2
Laboratoire TBF, Bron, France 3
Laboratoire de Vibrations et Acoustique, INSA Lyon, France 4
Clinique St Charles, Lyon, France
Received: 7 February 2003 / Received in final form: 2 October 2003 / Accepted: 14 October 2003 Published online (Inserted Later) – c EDP Sciences
Abstract. A series of 44 samples of bone wedges of human origin, intended for allograft openwedge os-teotomy and obtained without particular precautions during hip arthroplasty were re-examined. After viral inactivity chemical treatment, lyophilisation and radio-sterilisation (intended to produce optimal health safety), the compressive strength, independent of age, sex and the height of the sample (or angle of cut), proved to be too widely dispersed [10−158 MPa] in the first study. We propose a method for selecting samples which takes into account their geometry (width, length, thicknesses, cortical surface area). Statis-tical methods (Principal Components Analysis PCA, Hierarchical Cluster Analysis, Multilinear regression) allowed final selection of 29 samples having a mean compressive strength σmax= 103 MPa ± 26 and with variation [61−158 MPa]. These results are equivalent or greater than average materials currently used in openwedge osteotomy.
PACS. 87.19.Rr Mechanical properties of tissues and organs – 81.70.Bt Mechanical testing, impact tests, static and dynamic loads
Nomenclature
h: maximum height of sample (mm) β: angle of cut of samples (degrees) S1, S2: bearing surfaces of the sample
L: distance of the experimental cutting plane to the edge of the periosteum of S2 (mm)
a, b, d: mean thicknesses of the cortex (mm) F : mean length of the wedge in the plane
of the neck of the femur (mm)
E: mean width of the wedge in the plane of the neck of the femur (mm)
a/F : characterises the proportion of the maximal thickness of the cortex relative to the mean length of the wedge (b + d)/2E: characterises the mean thicknesses of
the arms of the wedges relative to the mean width E
E(a + b + d)/3: characterises the mean surface area of the cortex (mm2
)
Stot: mean total surface area of cortical and
spongy bone (mm2
)
Scort: mean surface of cortical bone measured
(mm2
)
a
e-mail: [email protected]
Scort∗: ideal mean surface of cortical bone
(without porosity) (mm2
)
Scort calculated: surface area of cortical bone estimated
by calculation (mm2
)
Porosity: proportion of cavities in the apparent part of the cortex of the bone (%) Pmax: maximal compression force recorded
during the test (N) σmax: compressive strength,
σmax= Pmax/Stot (MPa)
σcort: maximal theoretical stress, ignoring
the strength of the spongy bone, σcort= Pmax/Scort(MPa)
γ: slenderness ratio (−) ρ: radius of gyration (m)
Inertiacortical: second moment of the area of mean
cross section of the cortical bone (mm4
) SW: minimum cross section of the whole
cortical bone (mm2
)
τultimate: ultimate shearing stress (MPa)
σultimate: ultimate stress under compression
(MPa)
α: coefficient of friction Bone/Steel τβ: shear stress connected to β (MPa)
2 The European Physical Journal Applied Physics
1 Introduction
In order to correct mechanical or bone axes in orthopedic surgery an osteotomy is frequently undertaken. The aim of this osteotomy is to treat certain medial femoro-tibial arthroses (wear affecting the medial part of the articula-tion in genu varum). To do this, it is possible to remove a bone wedge (closing wedge osteotomy) or to add a wedge (openwedge tibial osteotomy), most frequently by using an autologous bone graft taken from the pelvis or with a biomaterial of natural (bovine bone) or synthetic (hydrox-yapatite, bioceramic...) origin.
The surgical procedure, via a short essentially anterio-medial approach, consists of cutting an osteotomy line with the saw guided by a pin previously implanted using an image intensifier. The trace starts from the medial as-pect of the tibia and becomes flush with the superior part of the fibula leaving an external hinge. The superior meta-physeal osteotomy passes at the level of the anterior tibial tuberosity and has a plane inclined backwards following the tibial slope. Opening consists of applying pressure to make the gap widen until the required separation is ob-tained. The correction is maintained by inserting a wedge into the opening, the height of this wedge having been de-termined before the operation, during the planning stage, as a function of the correction desired and the width of the tibia. Valgisation must not exceed 12◦taking into account
the risk of lowering the patella. The assembly is generally consolidated by osteosynthesis. Depending on the discom-fort caused, this will be removed 12 to 18 months after the operation [1,2].
Biphasic synthetic products (HAP and TCP) as well as bovine trabecular xenografts have a mechanical strength in the region of 10 MPa [3–5] which is too low to envisage their use for osteotomy. Biomaterials such as the exoskele-ton of polyps (marine invertebrates) or synthetic bioce-ramics of the hydroxyapatite type provide on the other hand strengths in the range of [25−100] MPa perfectly appropriate for the stresses involved [6,7].
With a view to using osteotomy wedges of compact bone obtained from the neck of the human femur, we showed in a previous study [8] that, without special pre-cautions, the compressive strength of such substitutes ranged from 10 to 158 MPa and that the height, the angle of the wedge and the sex of the donor had no significant influence on this. In order to reduce the wide range of strength provided, we have studied the influence of the geometry and the apparent porosity of the sample in or-der to determine simple objective criteria for the selection of grafts, using statistical methods (principal components analysis PCA, hierarchical cluster analysis, multilinear re-gression).
2 Materials and methods
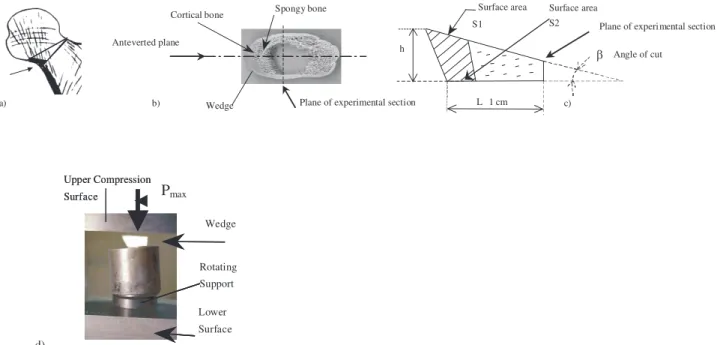
The series of 44 samples (27 women, 17 men, 70 ± 12 years old, [43 to 94 years old]) previously studied [8], was se-lected without particular dimensional criteria, apart from the height and angle of cut of the wedges (Fig. 1).
2.1 Origin and preparation of the bone wedges 2.1.1 Origin of the bone wedges
The bone wedges were prepared from the neck of the femoral head. Recovery of them and safety measures were carried out by a tissue bank. The heads of the femurs came from patients who had undergone operations for hip arthroplasty and were selected according to clinical and biological criteria which meet strict health safety reg-ulations. The bone tissue was then cleaned, decontami-nated and sterilised using a process which combines me-chanical and chemical treatment, lyophilisation and radio-sterilisation.
This process aims to preserve the healthy bone struc-ture, excluding the medulla, the cartilage and the inser-tion of ligaments, as opposed to cryo-conservainser-tion [9]. It follows from this that there is an improvement in osteo-conduction, the possibility of storage at ambient temper-ature and presentation in forms suitable for various sizes of defect.
2.1.2 Preparation of the samples
The 44 samples had been taken from the base of the necks of the femoral head from 27 women and 17 men (70 ± 12 years old, [43 to 94 years old]) (Fig. 1a). The wedges were sawn using a band-saw (Perfekta Plus MKB 649, v = 17 m.s−1, blade 1750 × 15 × 0.45 mm) with an angle
of cut β (6, 8, 10 and 12◦±0.5◦) and a maximum height h
corresponding to the angle of cut (6, 8, 10 and 12±0.5 mm respectively).
For the mechanical tests, the wedges were sectioned (experimental cutting plane) at L = 1 cm from the pe-riosteal border of S2 with a diamond saw (BUEHLER r
ISOMET saw, Low speed) without fluid, in order to keep only the “useful part” of the sample (Figs. 1b, c).
2.2 Preliminary measurements
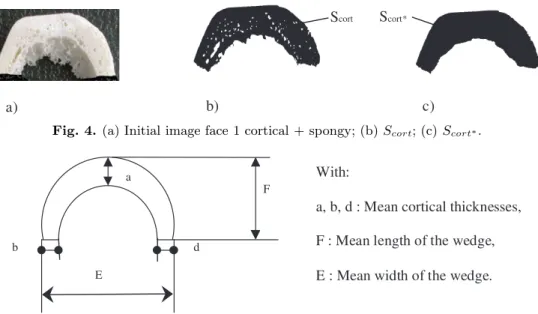
The two faces of each sample (S1 and S2) were
digi-talised with a scanner (EPSON GT-6000 scanner, reso-lution 600 dpi, 255 grey levels) before the test, in order to measure the different geometric and surface area pa-rameters. Each face was then binarised and only the bony parts (cortical and spongy bone) were measured.
2.2.1 Measurement of the surface areas
The surface area chosen was the mean of the surface areas (S1 and S2) measured on faces 1 and 2. In fact,
depend-ing on the cuttdepend-ing plane of the osteotomy wedge in the femoral neck (more or less proximal, Fig. 1a), the differ-ence in thickness of the cortex between face 1 and 2 can be important, with a mean difference of 20%.
The digitalised views of faces 1 and 2 of a wedge are shown in Figures 2a, b.
Fig. 1. (a) Obtaining a wedge; (b) wedge viewed from above; (c) diagram of a wedge, viewed in section; (d) compressive test.
Fig. 2. (a) Face 1; (b) face 2.
Fig. 3.(a) Stot= Scort+ Ssp; (b) Scort.
A threshold, adapted for each sample, was choosen (be-tween 0 and 255) to binarise the surface areas.
A program developed in Visual Basic allowed deter-mination of the total surface area (porosity deducted), by counting the number of pixels on a given view, depending on the resolution chosen (600 dpi, i.e. ≈40 µm).
Separation of the cortical (Scort) and spongy (Ssp)
sur-face areas was made visually by smoothing out the en-dosteal membrane and using the curve of the periosteal membrane as a basis for this (Fig. 3). The measurement of the cortical surface area Scortand the total surface area
Stot takes into account the fact that porosity holes or
os-teophytes may be present.
Example on face 1 of the representation of the to-tal surface area Stot and the cortical surface area Scort
(Figs. 3a, b).
2.2.2 Measurement of apparent porosity
This measurement partly quantifies the quality of the cor-tical bone when the latter shows apparent porosity. The porosity of the spongy bone is taken into account in the measurement of the total surface area
Cortical porosity (%) = Scort∗−Scort Scort∗
×100 (1) with Scort∗: ideal cortical surface area reconstructed and
calculated from a scanned image by filling in the porosity holes.
This operation was carried out on the 2 faces and the results given correspond to the mean apparent porosity between faces 1 and 2. Figure 4 gives the results obtained on face 1 of a bone wedge (woman, 65 years old, apparent cortical porosity 4.4%).
2.2.3 Measurement of the geometric parameters
From the digitalisation of the surfaces S1 and S2 and
knowing the resolution of the images, the different val-ues for thickness and width can be obtained by measuring these dimensions directly on the screen. Each of these mea-surements is the mean of meamea-surements made on faces 1 and 2 (Fig. 5).
4 The European Physical Journal Applied Physics
Fig. 4. (a) Initial image face 1 cortical + spongy; (b) Scort; (c) Scort∗.
Fig. 5.Representation of the geometric parameters.
2.3 Compression tests
Compression tests were carried out at ambient tempera-ture (20 ◦C, on “dry” sample) on a computer controlled
Schenck RSA 250 traction-compressive machine. Each os-teotomy wedge was placed on a pivoting support. The compression force (P ) was progressively applied to the wedge with a speed of movement of 0.5 mm/min to ob-tain a quasi-static displacement (Fig. 1d).
Using the maximum recorded force (Pmax),
corre-sponding to the rupture, it is possible to calculate a limit stress σmax = Pmax/Stot characterising the compressive
strength of the wedge, while ignoring the shearing effect inherent in frictional forces and to the angle β [6].
2.4 Statistics
The samples tested form part of a non-paired series (one bone wedge per individual). Statistical analyses were car-ried out using the Unistat r 5.0 program for Windows and Matlab. For the descriptive statistics, the results are pre-sented as follows: the mean, the standard deviation and the variation range indicating the minimum and maximum values of the data.
In order to separate the variables essential for our anal-ysis, we used principal components analysis (PCA) [10]. PCA deals with tables crossing N individuals in the sta-tistical sense of the term with K quantitative variables (here the individuals were represented by the bone wedges tested and the quantitative variables were the thicknesses, the surface areas, the porosity, etc.). PCA allows the di-mensions of the space necessary to preserve a “good pic-ture” of the cloud to be reduced, by searching for new orthogonal axes called principal axes. Two types of graph are obtained: graphs where each individual is interpreted as a point in a space of dimension K and graphs where
the variables which are most correlated with the princi-pal axes and most correlated between themselves are in-dicated. The latter interpretation is used above all.
As stress depends on a reference surface area, a classic multilinear regression (stepwise regression) was used [11] with the aim of obtaining an analytical formula for deter-mining the cortical surface area.
Finally, to form a representative group providing a mean strength at optimal compression, hierarchical clus-ter analysis (HCA) was undertaken. Starting from a table of individuals, the latter is based on the calculation of Eu-clidean distances between each pair of points taken among the N samples, with the coordinates introduced by the se-lected variables (geometric, porosity, etc.). Division of the population into disjointed groups is sought optimising a criterion which tends to:
– only group two individuals together if they are very similar;
– only separate individuals who are sufficiently different. Then a portrait of the groups is made by studying the distribution of each variable in each one of them in order to extract selection criteria to be applied later.
3 Results
Table 1 gives the results of geometric measurements and compressive strength (σmax) obtained on the 44 samples.
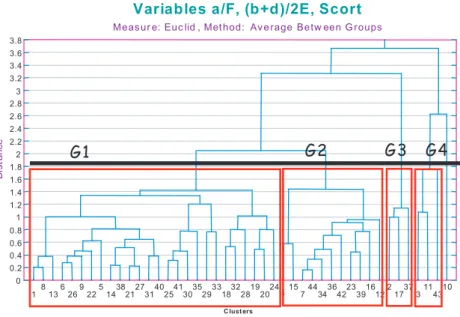
The principal component analysis was carried out us-ing the 8 basic variables (a, b, d, E, F , Stot, Scort,
poros-ity). The graph (Fig. 6) of the projections of the variables on the two first axes shows that the thickness parame-ters (a, b, d) have a strong correlation between each other and with the cortical surface area Scort around axis 1,
and the width and length parameters (E, F ) with the to-tal surface area Stotand towards axis 2. They thus appear
Fig. 6. Principal components analysis for 8 basic variables. Table 1. Descriptive statistics, geometric measurements and compressive strength.
n = 44 Age Stot Scort σmax (mm2 ) (mm2 ) MPa Mean 70 114 81 90 Standard deviation 12 25 19 32 Minimum 43 73 36 10 Maximum 94 195 136 158
To the 7 basic dimensional characteristics (a, b, d, E, F , Scort, Stot) and porosity are added three new variables.
They express the additional mechanical properties linked to the thinness of the sample (a/F , (b + d)/2E), and to the mean cortical surface area (E(a + b + d)/3). We thus carried out a new PCA with these 11 variables.
Distribution similar to the first PCA is again observed: one group of 7 variables (framed in Fig. 7), very corre-lated between themselves and with the cortical surface area around axis 1, and a second one linked to axis 2, con-sisting of E, F and the total surface area. It can be seen in the two graphs that the apparent porosity does not stand out as being a variable correlated with the other parame-ters but is rather in opposition on axis 1 to the 1st group of variables.
Since the objective was to produce a classification of the bone wedges from variables or combinations of simple geometric variables, several choices were possible. From the previous PCA, the three variables with the greatest mechanical significance were chosen (cortical surface area Scort, and the thinness parameters a/F and (b + d)/2E).
The hierarchical cluster analysis of the individuals was then carried out in the Euclidean space of the three vari-ables chosen. Figure 8 shows the distribution and classi-fication of the individuals (on the abscissas) relative to the Euclidean distance on the ordinates obtained by the
Fig. 7.Principal components analysis for 11 basic variables.
Table 2.Characteristic parameters of group G1 (n = 26). n = 26 Scort a/F b + d/2E σmax
(mm2 ) (-) (-) (MPa) Mean 85.1 0.36 0.103 103 Standard deviation 9.3 0.05 0.016 28.3 Minimum 69 0.27 0.0774 43 Maximum 103.8 0.48 0.132 158
“Average between groups” method and starting from the three chosen variables Scort, a/F and (b + d)/2E centred
and reduced. The cut off at the distance d = 1.8 produces 4 distinct groups and one isolated sample.
Calculation of classic statistics for the 4 groups (G1, G2, G3, G4), shows that group No. 1 has a mean max-imal stress (σmax = 103 MPa, n = 26). This group
in-cluded 26 samples but one of them had a very low stress (No. 32, σmax = 43 MPa). Examination of it showed the
presence of osteophytes in the cortex. We chose to elimi-nate it: this did not influence the grouping. On the other hand, in terms of compressive strength, the group then had a higher minimal stress. Table 2 gives the descriptive statistics of the representative group G1. Group G2 shows an intermediate mean stress (σmax = 75 MPa, n = 11),
group G3 a very low mean stress (σmax= 37 MPa, n = 3)
while group G4 has three samples with geometric param-eters clearly greater than all the others (σmax= 89 MPa,
n = 3).
This sorting allows the most resistant samples to be selected. We therefore propose the following criteria, based on the minimums obtained in group 1:
– Scort> 69 mm2.
– a/F > 0.27.
6 The European Physical Journal Applied Physics
Fig. 8. Grouping of samples (n = 44).
Table 3. Characteristic parameters of group G1 (n = 25) having eliminated the sample with osteophytes.
n = 25 Scort a/F (b + d)/2E σmax (mm2 ) (-) (-) (MPa) Mean 84.7 0.36 0.102 105 Standard deviation 9.2 0.05 0.015 26.1 Minimum 69 0.27 0.0774 61 Maximum 103.8 0.48 0.132 158
Nevertheless, it is relatively difficult experimentally to de-termine the value for the cortical surface area Scort. As it
has been shown that this surface area was correlated to the geometric parameters (Fig. 6), a regression law was sought which would allow calculation of this value from simple measurements.
A stepwise regression analysis led to the selection of the variables (E(a + b + d)/3, E, E2
) on the basis of the optimum r2
of 0.995 to express the cortical surface area (Scort), the factor E(a + b + d)/3 representing the mean
cortical surface area, the parameter E being linked to the mean circumference of the sample and E2
to the total surface area of the sample.
The equation obtained is as follows, calculated for 44 samples (standard error = 6.16 mm2
): Scort calculated = 2.4715 E + 1.1799a + b + d 3 E − 0.0816 E 2 . (2) It is thus possible to estimate numerically the cortical sur-face area Scort previously measured by scanning and
dig-italisation of each surface of the sample.
Thus, the cortical surface area Scort will be replaced
by the calculated cortical surface area Scort calculatedin the
preceding selection criteria.
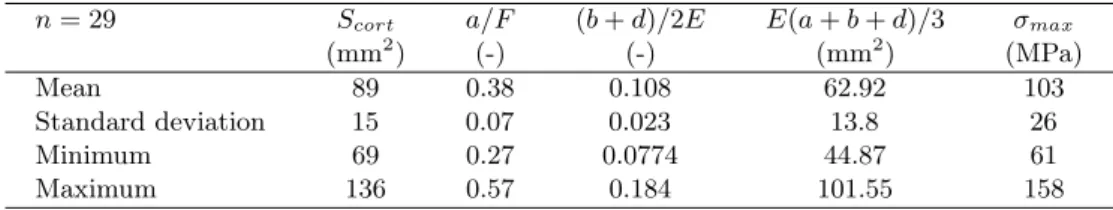
If these selection criteria are applied to the 44 preced-ing samples, a representative group of 29 individuals is obtained. Its characteristics are as follows (Tab. 4).
4 Discussion
It should be remembered that the series of samples (n = 44) used in this study had been previously tested with-out taking particular precautions in their selection (age, sex). Only the angle of the wedge (β), associated with the height (h), and the sex of the donors was considered in the first study. It has been shown [8] from 4 batches of 11 sam-ples, that the three parameters chosen (β, age, sex) have no significant influence on compressive strength. But the wide range obtained for this [10−158 MPa] required the development of a sample selection method reliably guaran-teeing an acceptable minimal value and a greatly reduced range equivalent to those obtained with similar materi-als suitable for osteotomies [25−100 MPa] [12]. It was to meet these two requirements that we examined our re-sults using the statistical methods explained and discussed below.
Generally as is now fairly well known, the preparation of samples is very severe, quite noticeably decreasing the mechanical properties of the head of the femur depending on the type of cleaning process used: e.g. rotary or ultra-sonic agitation [13] and the physico-chemical treatments used result in reduction of the mechanical properties of trabecular bone [14].
For the mechanical tests, the ready to use wedges were sectioned arbitrarily at L = 10 mm in the direction of the length of the neck. This value was chosen after 4 pre-tests on whole wedges, with the aim of conserving one of the dimensions homogeneous to all the samples. In addition, during implantation, the surgeon may decide to cut the bone wedge to facilitate its insertion. The surgical condi-tions for insertion are thus noticeably reproduced.
Table 4.Parameters obtained for 29 samples selected from 44 individuals using the criteria given by the representative group G1. n = 29 Scort a/F (b + d)/2E E(a + b + d)/3 σmax
(mm2 ) (-) (-) (mm2 ) (MPa) Mean 89 0.38 0.108 62.92 103 Standard deviation 15 0.07 0.023 13.8 26 Minimum 69 0.27 0.0774 44.87 61 Maximum 136 0.57 0.184 101.55 158
To determine the measurements of the different surface areas (Scortand Ssp), we scanned the faces of each sample.
Measurement bias was thus possible when the cortical part had to be delineated from the spongy part. In addition, the surface area and the geometric values obtained came from the mean of the values for the two faces, this operation necessarily affecting the precision of the calculations.
The porosity that we calculated is a mean apparent surface porosity and not a volumetric porosity. It must therefore be considered as a simple indicator, which has been proved moreover not to be significant in terms of influence on the mechanical strength of the samples.
The choice of using thinness variables was made to express a certain fragility of the samples. But a slenderness parameter, which is classically used in compression:
slenderness γ = h/ρ (3) with
Inertiacortical= SWρ 2
(4) could have been envisaged. Only the fairly delicate, in practice, calculation of inertia led us to choose the simpler method, calling upon a single notion of thinness.
Tests undertaken on bone wedges of human origin nat-urally lead to compression and shear stresses within the samples. During the calculation of maximum strength un-der compression σmax, we only considered compression
stress, because this is dominant. In fact, for the maxi-mum angle β of 12◦, the maximum shearing force,
con-nected to the fact that the bearing faces are not paral-lel, may reach 21% (sin 12◦) of the overall stress
mea-sured. But it has been shown in the literature [15,16] that the ultimate shearing stress (τultimate) reaches
ap-proximately 50% of the ultimate stress under compression σultimate (i.e. τultimate = 60−80 MPa and σultimate =
170−190 MPa on moist compact bone from the human femur).
It should also be noted that the effect of friction ex-isting at the bone/metal interface was taken into ac-count, the coefficient of friction being in the region of α = 0.16 [17]. This is also a physical reality on implan-tation of osteotomy wedges (interface bone/moist bone). If the influence of friction and shearing due to the incli-nation of the bearing surfaces is taken into account, the following is obtained:
τβ ≈21% σultimate (5)
and
τα≈16% σultimate. (6)
That is a maximum of 37% σultimate, a value which
re-mains lower than that given in the literature (50%) and which shows the predominance of compression stress in our test, reproducing in fact rather well the physiological situation of osteotomy wedges. The limit stresses are thus determined by default, taking into account the penalising effect of shearing stresses, making these results reliable.
The absence of alignment between the mechanical load and the mean direction of the cortex can also bring about measurement bias but numerous other independent fac-tors which are difficult to measure are also involved in the overall strength of osteotomy wedges (overall geome-try, age, pathology, site in the neck from which the wedge is taken, etc.). It should also be remembered that inter-individual variations in mechanical properties of cortical bone under compression, cited in the literature [15,18] (from 127 to 296 MPa, 7 subjects between 17 and 83 years old, i.e. from a given value to more than double that fig-ure), are similar to those recorded during our tests.
In the first instance, the application of PCA has al-lowed fairly easy visualisation of two groups of dimen-sional variables which are clearly uncorrelated one with the other, one group naturally associating the cortical sur-face area with thicknesses a, b, d and the other group as-sociating the total surface area equally naturally with the width and length of the bone wedge. Secondly, in order to introduce physical parameters (thinness) which generally play a role in mechanical strength and in the end perhaps to get closer to the calculation of Scort, three new
vari-ables have been added to the analysis. It can be seen that these are integrated into the 1st group and justify a priori their choice in the rest of the study.
During the statistical study, several choices of current methods of hierarchical classification were possible (Av-erage Between Groups, Av(Av-erage Within Groups, Single Linkage, Centroid, Median, etc.) but these all led more or less to the same sample groupings.
If the variables which permitted the classification are then considered (i.e. Scort, and the thinness
parame-ters a/F and (b + d)/2E), it becomes evident that group 1 (the representative group) is characterised by parame-ter values which deviate positively from the mean, whilst group 2 deviate negatively, group 3 very negatively and the other samples very positively.
Following this sorting, a selection of the most resis-tant samples was possible from the scanner measurements (resolution 600 dpi i.e. ∼40 µm) of basic geometric pa-rameters (a, b, d, E, F ) allowing indirect calculation of the cortical surface area. In practice, the dimensions could be measured on the samples taken using a micrometer
8 The European Physical Journal Applied Physics
(accuracy 0.05 mm). Particular care should however be taken over these measurements in order to ensure consis-tency of the method. Thus, direct geometrical measure-ments only (such as cortical thickness at different points (a, b, d), and the width E of the sample) allow the cor-tical surface area of the bone wedge taken from femoral head neck to be predicted. Various regressions taking into account several combinations of variables have been stud-ied. These gave very satisfactory correlation coefficients (r2
> 0.8) but we have kept the variables which have a physical representation and an optimum r2
(0.995). In general, the coefficient E(a + b + d)/3 appears to be nec-essary in all these regressions, a fairly obvious observation considering that it represents a good approximation to the cortical surface area. It should nevertheless be noted that we deliberately eliminated one sample, due to the presence of osteophytes on the cortex. In fact, the presence of this abnormality led to over estimation of various geometrical parameters above all of surface areas, which did not place the sample in the right group. Particular care should thus be given to preliminary choice of bone wedges rejecting those having cortical osteophytes.
5 Conclusions
The simple geometric parameters that we chose in order to select bone wedges are relatively easy to measure (a, b, d, E, F ) and the chosen criteria ensure a satisfactory range of compressive strength. Statistically, 95% of the samples have a maximum stress between 50 and 154 MPa (mean ± 2 standard deviation). By selecting the samples according to the proposed method, the mean mechanical strength (105 MPa), the range of strength provided by the sorted group [61−158 MPa] and the minimum value (61 MPa) are in the superior range of materials suitable for osteotomies.
The authors would like to thank the Tissue Bank of France (TBF) for the furnishing of the openwedges and for their tech-nical assistance.
References
1. P. Hernigou, H. Ovadia, D. Goutallier, Rev. Chir. Orthop. 78, 258 (1992)
2. J.L. Thomine, A. Boudjemaa, Y. Gibon, N. Biga, Rev. Chir. Orthop. 67, 319 (1981)
3. G. Poumarat, M. Dabonneville, Orthop. Traumatol. 2, 265 (1992)
4. G. Poumarat, P. Squire, Biomat´erial 14, 337 (1993) 5. M. Trecant, J. Delecrin, J. Royer, E. Goyenvalle, G.
Daculsi, Clin. Mater. 15, 233 (1994)
6. G. Guillemin, J.L. Patat, J. Biomed. Mater. Res. 21, 557 (1987)
7. J.C. Le Huec, T. Schaeverbeke, D. Clement, J. Faber, A. Le Rebeller, Biomaterials 16, 113 (1995)
8. H. Follet, R. Bardonnet, C. Rumelhart, Arch. Physiol. Biochem. 109, 95 (2001)
9. K. Thoren, P. Aspenberg, K.-G. Thorngren, Clin. Orthop. 311, 232 (1995)
10. M. Voll´e, Analyse des donn´ees, edited by Economica (Paris, 1997), 320 p., ISBN 2-7178-3212-2
11. G. Saporta, Probabilit´e, analyse de donn´ee et statis-tique, edited by TECHNIP (Paris, 1990), 400 p., ISBN 2-7108-0565-0
12. Association pour l’´etude des Greffes Et Substituts Tissulaires de l’Appareil Locomoteur. http://www.maitrise-orthop.com/gesto
13. K. Bruy`ere, R. Bardonnet, D. Mitton, C. Rumelhart, in Bone allograft preparation using ultrasonic stirring: mechanical validation, 8th World Congress of SIROT, Sydney, Australia, April 1999
14. O. Cornu, X. Banse, P.L. Docquier, S. Luyckxs, C. Delloyec, J. Orthop. Res. 18, 426 (2000)
15. Y. Hiroshi, Strength of biological materials, edited by F. Gaynor Evans (Robert E. Krieger publishing company, Huntington, New York, 1973), pp. 38–43
16. S.C. Cowin, Bone Biomechanics Handbooks, 2nd edn. (CRC Press, New York, 2001), ISBN: 0-8493-9117-2 17. D. Dowson, V. Wright, Introduction to the biomechanics of
joints and joint replacement (Mechanical engineering pub-lications Ltd, London, 1981), p. 54, ISBN 0-8529-8384-0 18. J.J. Comtet, R. Rozier, R. Vassal, J.M. Arene, L. Fischer,
Rev. Chir. Orthop. 53, 3 (1967)
To access this journal online: www.edpsciences.org