HAL Id: hal-02335892
https://hal.archives-ouvertes.fr/hal-02335892
Submitted on 28 Oct 2019HAL is a multi-disciplinary open access archive for the deposit and dissemination of sci-entific research documents, whether they are pub-lished or not. The documents may come from teaching and research institutions in France or abroad, or from public or private research centers.
L’archive ouverte pluridisciplinaire HAL, est destinée au dépôt et à la diffusion de documents scientifiques de niveau recherche, publiés ou non, émanant des établissements d’enseignement et de recherche français ou étrangers, des laboratoires publics ou privés.
Cost engineering for variation management during the
product and process development
Alain Etienne, Shirin Mirdamadi, Mehrdad Mohammadi, Roozbeh
Babaeizadeh malmiry, Jean-François Antoine, Ali Siadat, Jean-Yves Dantan,
Reza Tavakkoli, Patrick Martin
To cite this version:
Alain Etienne, Shirin Mirdamadi, Mehrdad Mohammadi, Roozbeh Babaeizadeh malmiry, Jean-François Antoine, et al.. Cost engineering for variation management during the product and process development. International Journal on Interactive Design and Manufacturing, Springer Verlag, 2017, 11 (2), pp.289-300. �hal-02335892�
Cost Engineering for Variation Management during the Product
& Process Development
Abstract:
Variation Management during the Product & Process Development can profoundly impact the quality, the cost of the product and the number of scraps in mass production… Designers want tight tolerances to ensure product performance; manufacturers prefer loose tolerances to reduce manufacturing and assembly cost. To analyse compromise solutions, the primary aim is to establish an objective function. This paper presents a model for the key indicators assessment to the relevance of variation management: cost, and investigates which model used in decision analysis is the most appropriate to prioritize and aggregate the predetermined performance measures. The applications of this model are demonstrated through an industrial case study where tolerance allocation, product development, problem is firstly addressed. Once optimized tolerances are attained, inspection planning, process development, problem is approached to ensure the optimized awaited quality level for the least cost.
Key words: Integrated Product and Process Design, Cost, Variation management, Tolerancing, Inspection
planning.
Etienne, A.1; Mirdamadi, S.2; Mohammadi, M.3; Malmiry, R. B.1; Antoine, J-F1; Siadat, A.1; Dantan J-Y1; Tavakkoli, R.4; Martin P.1
1.LCFC, Arts et Metiers ParisTechMetzFrance 2.Quartz, Supmeca Paris St OuenSaint-OuenFrance
3.EMSE-CMP LIMOS, UMR CNRS 6158 Ecole des Mines de Saint-Etienne Campus G. Charpak ProvenceGardanneFrance 4.School of Industrial Engineering, College of EngineeringUniversity of TehranTehranIran
1- Introduction
In recent decades, the egregious importance of total quality management has been completely clarified to all industries. In order to maintain profitable and stay in a competitive edge, reaching to high quality level of products, processes and services has been nowadays a vital issue in many organizations, while they cannot survive without providing high quality products. For this aim, manufacturers are applying a variety of tools to improve quality throughout the production process such as Six Sigma, statistical process control (SPC), process improvement, inspection, robust design, etc.
Variation/Uncertainty is ubiquitous in any engineering system at all the stages of product development. Variation from different sources affects the product lifecycle and thus, the intended performance of the product. Variation management therefore, during product design is a crucial part of the design process. A review of the general design processes however reveals that the activities intended to study and to minimize the effect of the variation in the design process are mostly addressed in the later phases of the product development phase once the design parameters of the products are fixed. Moreover, many papers focus on the impact of the variation on the product functionalities.
Variation management can profoundly impact the quality, the cost of the product and the number of scraps in mass production… Designers want tight tolerances to assure product performance; manufacturers prefer loose tolerances to reduce cost. Variation management is a key element in industry for improving product quality and decreasing the manufacturing cost. Therefore, the development of models for the key indicators assessment to the relevance of a variation management (customer satisfaction, manufacturing cost, inspection cost…) is key issue. In fact, the cost assessment becomes a key activity to improve the tolerance allocation, to select fittest manufacturing resources, inspection allocation planning, or ... A number of cost assessment methods and techniques were developed with reference to particular applications:
- Parametric models for tolerance allocation [1], [2], [3], - Analytical methods for tolerance verification [4],
- Analytical methods for the assessment of the economic impact of metrology in manufacturing [5], [6]
- …
A significant amount of research has been devoted; two essential inconveniences in the parametric models for tolerance allocation are costly evaluation of their required parameters (mainly with experimental designs) and also their limited validity and generality in the industrial framework. Moreover, the development of specific cost models for each step of the product development increase the modelling cost [7].
Therefore, this paper presents a key indicator: Quality Weighted Cost that could be used in several stages of a product design cycle: Tolerance design, CAPP (Computer Aided Process Planning), CAIP (Computer Aided Inspection Planning)…
This paper is divided into four main sections. The next section discusses the context: redesign or adaptive design which is the most common design problem undertaken in industry. In this context one indicator is proposed in the section 3: the cost impacted by the variation/uncertainty. The applications of this indicator are demonstrated through an industrial case study in the last sections.
2- Context
This section provides a brief overview of the context of variation management: design process context, main aim of variation management (quality assessment and cost reduction), and the description of variations which affect the customer satisfaction.
encountered in the industry are redesign, variant design or adaptive design of an existing product design [8]. Redesign, Variant Design and adaptive design is a common and widely practiced design task whereas starting from an existing solution, the designer creates a product to meet new requirement, needs and constraints while keeping an existing product design. The resulting product may be adapted for different requirements, or be an improved version of the existing requirement; redesign is also used for different versions of the product to address different segments in the market according to their variable demands [9].
The proposed indicators are used for redesign. In this context effective reuse of industry knowledge about variation effects and causes is a key strategic component of Integrated Product and Processes Development (IPPD).
For variation management in the context of IPPD, process capability approaches have been developed at most manufacturing companies to enable the manufacturability assessment, to predict the Product designs end quality and to improve design robustness. Process capability approach allows for an understanding of the capability of machines, tools, and operators to manufacture a particular feature of a particular dimension using a specific process [10]. These approaches are needed for robust design, optimal tolerance allocation, and variation simulation analysis. In the context of variation management, traditional performance assessments focus on the customer satisfaction. These assessments do not provide information to evaluate the impact of variations on the manufacturing productivity; on the cost … In the following the classification and the impacts of variation are discussed.
V. SRINIVASAN [11] argues that inevitable variations in production and inspection influence product specification. This inevitability of variations is embodied in the following two axioms:
“Axiom of manufacturing imprecision: All manufacturing processes are inherently imprecise and produce parts that vary.”
“Axiom of measurement uncertainty: No measurement can be absolutely accurate and with every measurement there is some finite uncertainty about the measured attribute or measured value.”
An important part of quality costs are failure costs that include scraps which are due to the manufacturing imprecisions. Scrap can be defined as the percentage of system quantity that does not meet required production quality standards; it could be evaluated by process capability approaches, and could be measured.
Another important part of quality costs are failure costs that include warranty, product liability claims and recall costs, which are due to the measurement uncertainty. In fact, measurement results are affected by measurement uncertainty, which leads to technical and economic risks in industrial companies [6]. By assessing the risks and the connected consequences of the decisions (conformity verification), the significance of the measurement result can be evaluated. Moreover, a brief discussion of this issue is given by Weckmann et al. [6]:
“In production metrology workpieces are inspected by measuring their specified characteristics. The generated measurement results are used as a basis for decisions for conformity assessment, process evaluation and statistical process control. Regardless of the economic value of measurement results as a decision base and due to the fact that the benefits through quality inspections in industrial enterprises are mostly hidden, production metrology is often considered merely as source of expenses. A verifiable proof of the economic value of measurements and the optimization of the ratio between value and expenses of measurement systems failed until now because of the missing monetary evaluation of the value of measurements.”
As preliminary conclusion of this section, variations affect the customer satisfaction and the cost. In the context of interactive design and manufacturing, it is important to ensure the interaction for improving decision making in the design process and the manufacturing. The variation management
during the product development is an important issue: decisions can profoundly impact the customer satisfaction, the quality, the cost… It calls for the formation of a cross-functional product development team; which includes people from a wide range of departments, such as: product planning, design, manufacture, assembly, quality assurance ... ; which includes people with different points of view, requirements … In this context, Performance assessment involves multi-dimensional attributes: Quality, Time, Cost, Customer satisfaction …
- Quality is traditionally defined in terms of conformance to specifications. According to (ISO 9000: 2000), quality is “the degree to which the set of inherent characteristics fulfil the requirements”. This definition of quality prompts quality measures such as the number of defects produced and the cost of quality. The true cost of quality is the function of the prevention, appraisal and failure cost. Manufacturing process improvement initiatives, such as six sigma, lean manufacturing and statistical process control, have introduced new ranges of quality related measures. For example, in the six sigma initiative, the highest quality is to achieve six sigma capability meaning 3.4 defects per million. Statistical process control measures consist of capability indices, i.e. Cp, Ca, Cpk, etc. - Cost-based performance measures have their origin in accounting management. An
accounting-based measure called return on investment (ROI) has been developed to serve as an indicator of the efficiency of their decentralized business units.
- …
Due to the context and the objective, we focus on the cost and the quality, indirectly customer satisfaction.
Moreover, Value in the product context is defined as: a judgment made on product by users on the basis of their expectations and motivations. More specifically, value increases when customer satisfaction increases or the incurred cost on product decreases. This definition can be mathematically symbolized as:
(1)
This performance indicator combines the Customer satisfaction and the Cost which are impacted by the manufacturing variations. In the same way, we propose a new cost model which takes into account the impacts of the manufacturing imprecisions and the measurement uncertainty.
3- Cost models for variation management
As explained in the previous sections of this paper, variation management strongly requires indicators which asses the relevance of several solutions. Later in this article, in accordance to the literature, one of these relevance assessment indicators on which we are focused is called “cost”. Among the several cost assessment methods available in the literature, a classification into three main categories could be carried out: parametric, analytical and analogical methods [12].
3.1 Approaches comparisons
The first category, the parametric approaches, gathers all technical solutions aiming at costs assessment by taking into account mathematical relationships linking parameters considered as influential ones. Both the selection of these key parameters and their mathematical relationships with costs are strongly based on the Knowledge of experts (mainly of products design and manufacturing system design) supported by a lot of set of experiments, data gathering and their analysis.
The CEF (Cost Estimation Formulae) is the most famous methodology. The goal of this approach is to Cost
on Satisfacti alue
guide the definition of parametric models by analysing continuously the relevance of each parameter in order to remove the useless ones. As an output, the parameters and the mathematical link is validated and can be directly used to the assessment of the costs of new products.
A lot of parametric cost models are available in the literature and, by extension; several propose to assess the cost due to tolerance allocation [13, 14 and 15]. This huge number of models can be easily explained by the fact that these formulae are easy to use, give directly fast and relevant results. However they are strongly contextual and, consequently, have a very short domain of validity. Indeed, modifying the location of the factory or the type of product material can impact have strong impacts, not only on value of parameters but on the model itself! Moreover designing these models is quite expensive, because it needs large set of data and experiments to identify the influence and weight of parameters supposed to be cost drivers.
The second type of approaches is called analogical: they are based on the hypothesis that two products considered similar have similar costs. Then, in order to assess the cost of a new product these approaches try to find, in a huge database containing all former products designed and manufactured by the company what are the ones that can be considered similar. This similarity evaluation is mainly based on a set of parameters considered relevant and discriminant enough to describe both: the product to design and its manufacturing process [16].
The technical solutions based on this principle follow the evolution of computer science: starting from group technology to most advanced systems like Cases based reasoning. This approach is currently able not only to give a similar cost but to generate the draft design of the process needed to manufacture the new product to analyse and consequently improve the cost evaluation.
Even if these approaches are interesting and can potentially continue their evolution in the same way than computer science [17], these approaches faced several drawbacks. The main one is the setup of these approaches to take into account the specificities of the company. Indeed, everything has to be adapted and defined before obtaining the first results: from the identification of the relevant parameters describing the problem to solve and its solution and the way to evaluate the similarity between the case to solve and the former cases.
The last type of approaches is the analytical ones. In order to assess the cost of a product, these solutions aims to decompose all the lifecycle of this product (from its design to its recycling) in order to identify and analyse all the activities involved. The activities are considered as the cost and time drivers: they consume resources and consequently money. By summing the cost of each activity it is possible to assess the global cost of the product. Several examples of this approach can be enumerated: form features [18], manufacturing engineering reference model, activity based costing [19, 20], cost features…
This kind of solution is interesting since several activities are common to several types of products: consequently they are really generic and are flexible. However in order to be as precise as possible, the work becomes very meticulous (in order to identify all activities directly or not involved in the product lifecycle) and, consequently, very long too. Moreover, compare to parametric approach the analytical approach are more computer time consuming.
To compare the different methods, it is interesting to establish the criteria with the features expected from such methods to choose the best solution. In this study we used as discriminating features [7]:
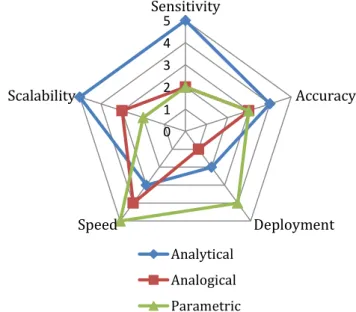
- Sensitivity of the assessment (repeatability and robustness): ability of method to integrate and take into account the variations of the input data.
- Adequacy of the evaluation (precision): ability of method to give accurate results considering the final product cost.
- Deployment/ Simplicity of use: the difficulty of formalizing data preparatory for the evaluation of cost, usually performed by experts.
- Speed / Rapidity of estimation: includes both the computation time than the time required to model a new problem.
- Scalability of method allows measuring the performance indicator rather than only financial dimension.
Comparing the three methods available to estimate the cost of a product, the drawbacks can be summarized as [7]:
- Parametric: although accurate and fast to use, in their range of validity they are limited by restricted scalability.
- Analogical: these methods are interesting but the preparatory phase (enrichment of knowledge base, parameters discriminating…) is long for the results. This approach seems impossible to automate in an optimization loop.
- Analytical: although the estimation process of these approaches is quite long because they generate and analyse all the operations necessary for obtaining a product, they remain attractive because of their flexibility and accuracy.
Figure 1: Comparisons of the three main approaches.
To manage the variation, the most important criteria is the accuracy. Therefore we focus on the analytical approach. One of the best known analytical approaches is the Activity-Based Costing (ABC) method. The fundamental difference between an ABC system and a traditional costing system is that the latter assumes that product causes costs, whereas ABC assumes that activity causes costs and the cost objects create demand for activities. The consortium for Advanced Management-International (CAM-I) defines activity based costing as follows: “Activity-Based Costing is a methodology that measures cost and performance of activities, resources and cost objects. Resources are assigned to activities, then activities are assigned to cost objects based on the use of consumption of the relevant activities. Activity-Based Costing recognizes the causal relationships of cost drivers to activities’. This method will be developed in the following section.
3.2 Proposed Model
0 1 2 3 4 5 Sensitivity Accuracy Deployment Speed Scalability Analytical Analogical ParametricPerformance evaluation in the context of variation management reflects two aspects: cost and quality. Therefore, we propose a cost model which takes into account the impact of the variations. Proposed quality-driven ABC (Activity Based Costing) aims to balance the manufacturing cost and successive expenses, and product satisfaction throughout the tolerance and variations analysis; it is the total cost of a marketable product; it includes four costs:
- the manufacturing cost, - the verification cost,
- the scrap cost (internal failure), - the cost of external failure,
weighted by the occurrence or/and the efficiency of the activities (Equation 2).
. 1 1 . 1 . 1 1 . 1 1 . 1 1 . . . . 1 1 . Cost Total Product Marketable int c c c nc prdma c c c c prdscrpng c c Inspctn Inspctn Monit Monit c c manu P P P C P P P P C P P OccP C OccP C P P C (2) Where:- Cmanu: Cost of manufacturing activities of a product,
- Cmonit & Cinspctn: Costs of monitoring and inspection activities,
- OccPmonit & OccPinspctn: Occurrences or frequencies of the monitoring and inspection activities - Cprdscrpng: Cost of product scraping and recycling,
- Cprdmaintnc: Cost of warranty, product liability claims and recall
- PC: Occurrence probability of conform product, which depends on manufacturing imperfections and component tolerances
- α: Occurrence probability of non-detection of non-conformity which is due to the measurement uncertainty.
- β: Occurrence probability of non-detection of conformity (false alarm) which is due to the measurement uncertainty.
- PC.(1-α): Percentage of Marketable conform products - Β.(1- PC): Percentage of Marketable non-conform products - ((1- PC).(1-β): Percentage of Detected non-conform products - PC.α: Percentage of Undetected non-conform products
This cost model could be simplified regarding to the granularity of the information. Based on the ABC approach, we add two concepts which are associated to activity:
- Activity occurrence: Probability that an activity appears in the process (for example, the probability of an inspection activity occurs in the manufacturing process).
- Activity efficiency: The probability that an activity lead to good products (Pc, α, β).
This cost model creates the link from cost to quality (two components of the customer satisfaction). As the concept of value, it could be used at different step of the product development for improving the decision making; it could be the objective function of lots of optimization problems for solution space exploration during the Integrated Product and Process Design. The applications of this cost model as
an objective function are demonstrated through an industrial case study in the sections 4 and 5: - Tolerance allocation during the product design
- Planning of the inspection activities during the process design
3.3 Illustration
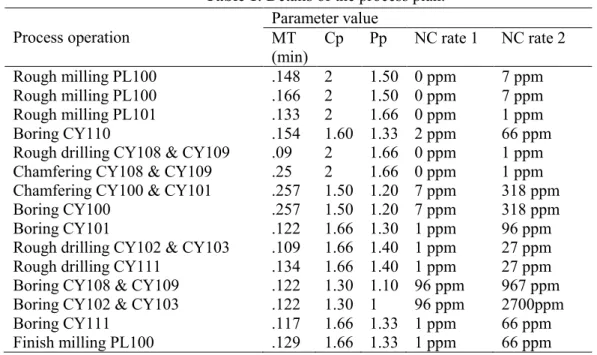
To illustrate this model, a real case study is presented (Figures 2 and 3) for the inspection planning in automotive industry. Different scenarios of inspection plans are proposed for the oil pump housing:
- Scenario 1: Product conformity control at the end of process - Scenario 2: Process monitoring for all operations with Cp<1.6
- Scenario 3: Product control conformity at the end of process, and the process monitoring for all operations Cp<1.6
- Scenario 4: Product conformity control at the end of all operations with Pp<1.4
- Scenario 5: Product conformity control at the end of all operations Cp(monitoring)<1.4, and the process monitoring for all operations Cp<1.6
One of the assumptions of this illustration is that there is no rework following failure detection, maintenance and assembly activities. Therefore, the inspection activities are regarded as on-line activities. For these activities, enough information is usually available to estimate the cost attribute affected directly. Therefore, it is necessary to evaluate Manufacturing times (Table 1 – MT), Process capabilities (Table 1 - Cp and Pp), the non-conformity rates with monitoring (Table 1 – NC Rate 1) and without monitoring (Table 1 – NC Rate 2) of each manufacturing operation.
Table 1: Details of the process plan. Process operation
Parameter value MT
(min) Cp Pp NC rate 1 NC rate 2
Rough milling PL100 .148 2 1.50 0 ppm 7 ppm
Rough milling PL100 .166 2 1.50 0 ppm 7 ppm
Rough milling PL101 .133 2 1.66 0 ppm 1 ppm
Boring CY110 .154 1.60 1.33 2 ppm 66 ppm
Rough drilling CY108 & CY109 .09 2 1.66 0 ppm 1 ppm Chamfering CY108 & CY109 .25 2 1.66 0 ppm 1 ppm Chamfering CY100 & CY101 .257 1.50 1.20 7 ppm 318 ppm
Boring CY100 .257 1.50 1.20 7 ppm 318 ppm
Boring CY101 .122 1.66 1.30 1 ppm 96 ppm
Rough drilling CY102 & CY103 .109 1.66 1.40 1 ppm 27 ppm Rough drilling CY111 .134 1.66 1.40 1 ppm 27 ppm Boring CY108 & CY109 .122 1.30 1.10 96 ppm 967 ppm Boring CY102 & CY103 .122 1.30 1 96 ppm 2700ppm
Boring CY111 .117 1.66 1.33 1 ppm 66 ppm
Finish milling PL100 .129 1.66 1.33 1 ppm 66 ppm The numerical values for each scenario are obtained as reported in Table 2:
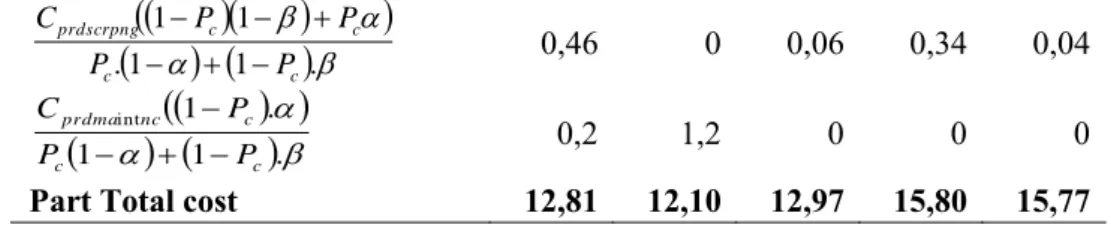
Table 2: Details of cost.
Scenario 1 2 3 4 5 Cmanu 10,09 10,09 10,09 10,09 10,09 PC 0,9954 0,9994 0,9994 0,9966 0,9996 1 1 . . . . c c Inspctn Inspctn Monit Monit P P OccP C OccP C 2,01 0,8 2,81 5,34 5,64
. 1 1 . 1 1 c c c c prdscrpng P P P P C 0,46 0 0,06 0,34 0,04
. 1 1 . 1 int c c c nc prdma P P P C 0,2 1,2 0 0 0Part Total cost 12,81 12,10 12,97 15,80 15,77
4- Application 1: Tolerance allocation optimization
In the current industrial framework where high precision products have to be low-cost too, a compromise must be found between designers who want tight tolerances to assure product performance and manufacturers who prefer loose tolerances to reduce production cost.
Figure 2: Gear Pump
The first application is the tolerance allocation of a gear pump (Figure 2) which is performed regarding the tolerance cost. In fact, the objective function is: to minimize the Marketable Product Total Cost, by quantifying the best possible geometrical tolerances (mostly dimensional tolerances). This value evaluation is performed with an integrated point of view: taking into account both the Product characteristics and constraints (mainly from the requirement it has to meet) and the Process capabilities and costs (resources are considered as the cost sources). The performance indicator is consequently a balance between two historical opposite points of view:
- Designers who want to tighten tolerances to insure that products are both functional and can be assembled.
- Manufacturer who need loose tolerances to short their production cost and ease the manufacturing of the design product.
In this case study, the required function is delivering oil with required pressure and speed. The system converts mechanical energy into hydraulic energy. The main property here is chosen as “oil flow” (Q) by the manufacturer.
4.1 – Problem formulation
The manufacture of the current oil pump expects an oil flow of 4.45×10⁻⁴ m3/s. The designers know that the efficiency and oil flow of the pump is related to different backlashes. These backlashes are between the gears and the casing as well as between the gears and shafts. Too small backlashes will result in friction and too much of them will result in internal flow loss and therefore performance reduction. Achieving precise backlashes is the result of manufacturing precision to obtain tight tolerances. Cost of tolerance is different for different parts. For instance, gears are made of aluminium so the quality level of IT8 is chosen for it. Therefore, because of the diameter of 31mm, the tolerance
interval is 39µm. The casing (CPHF) is made of sintered still. So, the quality level of IT6 is chosen for all the entities shown in Figure 3. The impact of tolerance level on the performance is not clear for the designer. Moreover, this impact on the cost of production should be identified as well.
The problem formulation was detailed in [22].
Figure 3: CPHF and its tolerances.
To carry out the evaluation of the value of a product configuration, the tolerance allocation is coupled with the process generation (one result is displayed in Table 1) and its evaluation regarding both its costs and the impacts of it on the product quality. The assessment of these quality parameters (i.e. the probabilities expressed in the equation 1) is performed by simulations. Several technical solutions were used to carry out these simulations: Monte Carlo simulations (used in [12-14]) ...
For the gear pump, the assessment of the quality characterizes the impact of the geometrical deviation on the oil flow. The quality of an oil pump can be evaluated based on its efficiency which includes volumetric and mechanical efficiencies. Volumetric efficiency is related to internal flow loss. The internal flow loss which is related to the laminar flow behavior can be modelled by the pressure required by the engine hydraulic circuit on one hand and the existing backlashes between moving parts on the other hand. The backlashes are directly related to the geometrical deviations.
Similarly, mechanical behavior can be modeled through journal bearing friction model. Dimensions, gaps and applied force lead to eccentricity of shaft and it modifies the distance between gear and casing. Based on this modeling, 13 tolerances are identified. Only some tolerances of the part CPHF is shown in Figure 3.
The evaluation of the manufacturing process cost is an easier stage. Indeed, when the manufacturing process is generated, the ABC method assesses this parameter. This approach needs that all resources costs and all parameters are known (not necessarily absolutely, but at least relatively).
When both quality measures and cost assessment are available the evaluation of the relevance of one tolerance allocation can be done. The quality weighted cost of both the product and its manufacturing process is available and can be compared with others solutions.
In order to find the product configuration having the best quality weighted cost, an optimisation loop is needed. At each step of this loop new tolerance allocation is generated and it cost is assessed. In [22], Genetic Algorithm supports this optimisation loop; nevertheless several other solutions are available in the literature.
4.2 – Results
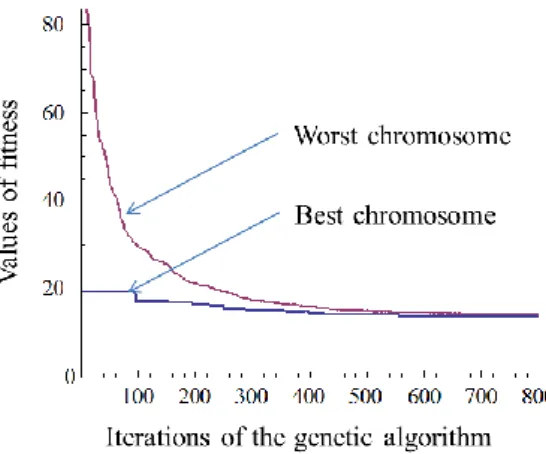
The Figure 4 illustrates the evolution of the Marketable Product Total Cost (which represents in fact the opposite of the value) of the product configuration.
Figure 4: Evolution of fitness values during the Genetic Algorithm iterations.
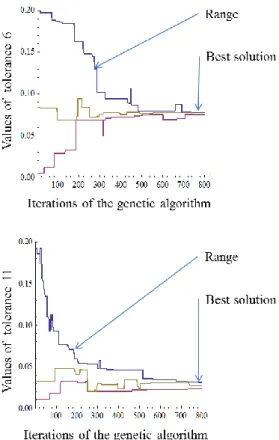
The Figure 5 illustrates the evolution and consequently the optimisation of tolerance allocation. In the top of this figure, the evolution of the three tolerances (Figure 3) is plotted: these three converges to the optimum value.
Figure 5: Evolution of tolerance values during the Genetic Algorithm iterations.
5- Application 2: Inspection planning optimization
Quality management in logistics reduces costs and enhanced customer satisfaction. An effective quality management should be carried out only on the basis of reliable measurements. Obtaining this information depends on unconditional observance of the unity of the initial measures and on correct measurement procedures at all steps of the product life-cycle. Production metrology is the fundamental tool to gain information and knowledge in all phases of the life-cycle of any product to help linking the separate processes. Therefore, however, it must be productive in an economic way, both cost efficient and relevant to satisfy the single process requirements of information.
In production metrology products are inspected by measuring their specified characteristics. The results of measurement are used as a basis for planning an inspection process (IP) to make decision on conformity assessment, process monitoring and statistical process control. Since the benefits through quality controls in industries are mostly hidden, production metrology is often considered merely as source of expenses. On the other hand, the proof of the economic value of measurements and the ratio determination between value and expenses of measurement systems have failed while the monetary evaluation of the value of measurements is missing. Pfeiffer [23] and Zhao et al. [24] defined IP planning (IPP) as an activity that determines which quality characteristics of a product should be inspected, where and when. In almost all manufacturing organisations, inspections are used during the processes to reach quality specifications instead of having an acceptance or a rejection inspection at the end. To achieve this goal, effective inspection planning should efficiently be integrated with the production logistics [25].
The application 2 tries to integrate production logistics and quality control and design an effective IPP to makes decision regarding to which quality characteristics of the product need what kind of
inspections (i.e., which-what decision); and when these inspections should be performed through the production process (i.e., when decision) in order to minimize manufacturing and inspection cost and maximize customer satisfaction. Through this problem, two kinds of product conformity (CI) and process monitoring (MI) inspections are considered [25].
5.1 – Problem formulation
In production metrology products are inspected by measuring their specified characteristics and the results of measurement are used as a basis for designing an IPP to decide which quality characteristics need what kind of CI and/or MI and when. For this aim, consider a serial multi-stage production system (MPS) with N stages, in which in-process parts pass sequentially from stage 1 to stage N and inspections of parts are performed at m (m≤N) locations. It should be noted that each stage can be an operation and a set of operations can be performed on the same machine. At each stage, a part (output of the immediately preceding stage) enters the processing station where a manufacturing operation is performed on it. Output of this operation is transferred to an inspection station or to the next processing stage. Suppose that a part consists of K quality characteristics and all characteristics of the part are simultaneously operated throughout the system. A part is 'nonconforming' if any quality characteristic does not meet design requirement. If a CI is performed between the i-th and (i+1)-th processing stations, non-conforming parts originated at the ith operation or at some of the earlier stages are detected and scrapped and no rework is considered. Besides, If an MI is performed between the ith and (i+1)-th processing stations, the processing features are monitored after a specific number of parts. An inspection operation may involve errors of two types: misclassification of a conforming component as non-conforming (type I error) and nonconforming one as conforming (type II error). This application proposes a bi-objective mixed-integer programming (BOMIP) model in order to simultaneously minimize manufacturing cost and maximizing customer satisfaction. The proposed cost model (Section 3) is divided in two components: Objective function (1) minimize sum of production cost, scrap cost, fixed and variable costs of CI and MI and fixed space cost of inspections, respectively. Objective function (2) attempts to minimize total warranty cost or indirectly minimize the number of undetected nonconforming parts that are transferred to the customers, while the lower the number of undetected nonconforming parts, the higher the satisfaction of customers.
Lack of information about production processes and several environmental factors imposes a degree of uncertainty to the planning parameters, which directly affect other decisions of inspection process. In most of manufacturing industries, a minimum level of uncertainty is inevitable. There are several parameters in the proposed BOMIP model that are affected by environmental factors and may fluctuate over the time. These parameters include production and inspection times, error types I and II of the inspection activities, and dispersion and misadjustment of the production processes. Hence, manufacturers are interested in less sensitive manufacturing processes. These manufacturing processes are robust processes, which are relatively insensitive to alteration of uncertain parameters. Objective functions are transformed into two new objective functions that minimize both expected value and variance of each objective function under variation to search the robust optimal solutions.
5.2 – Result
In order to validate the correctness of the proposed robust BOMIP, an industrial case related to the main part of the gear pump with 15 quality characteristics is studied in this section. First, some information about the industrial case is presented such as production time, operation capability, failure rate and allowable places to perform inspection for each quality characteristic (Table 3, in which the first to sixth columns explain name of the operations, production time, process capabilities Cp and Pp and the allowable places (AP) that inspections (i.e., CI and MI) of each quality characteristic can be
stationed).
Table 3: Details of industrial case for the inspection planning.
Process operation Parameter value
MT (min) Cp Pp AP
Rough milling PL100 .148 2 1.50 1→13
Rough milling PL100 .166 2 1.50 2→14
Rough milling PL101 .133 2 1.66 3→15
Boring CY110 .154 1.60 1.33 4→10
Rough drilling CY108 & CY109 .09 2 1.66 5→10 Chamfering CY108 & CY109 .25 2 1.66 6→6 Chamfering CY100 & CY101 .257 1.50 1.20 7→15
Boring CY100 .257 1.50 1.20 8→15
Boring CY101 .122 1.66 1.30 9→12
Rough drilling CY102 & CY103 .109 1.66 1.40 10→12
Rough drilling CY111 .134 1.66 1.40 11→15
Boring CY108 & CY109 .122 1.30 1.10 12→15
Boring CY102 & CY103 .122 1.30 1 13→15
Boring CY111 .117 1.66 1.33 14→15
Finish milling PL100 .129 1.66 1.33 15→15
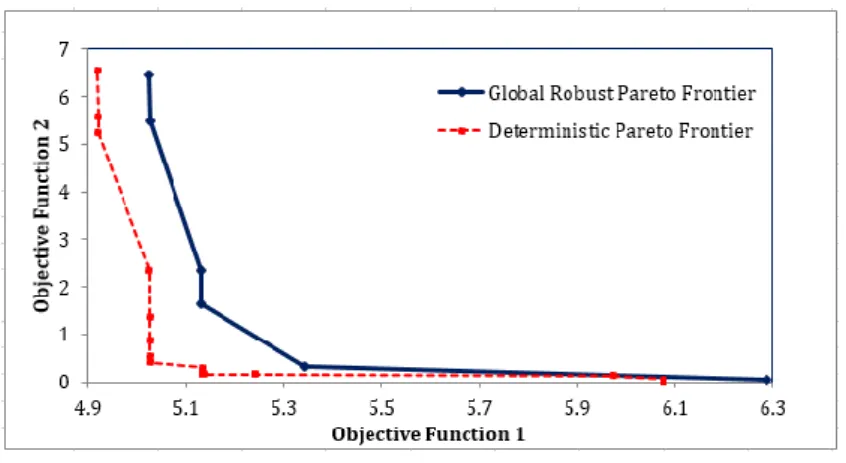
After solving the proposed global robust BOMIP model, the Pareto frontier of the problem can be illustrated as Figure 6, in which the dash and solid lines represent Pareto frontiers of the problem with deterministic and uncertain parameters, respectively.
Figure 6: Pareto frontier of the proposed BOMIP model.
In order to better understanding the which-what and when decisions, the structure of a sample non-dominated solution from the global robust Pareto frontier (i.e., shown in Figure 6) is depicted as Figure 7. In Figure 7, circles show the operations and squares represent quality characteristics. Quality characteristics that need CI or/and MI, have been illustrated in blue and yellow squares. For example in Figure 4, quality characteristics number 2, 4, and 6 to 12 need MI and quality characteristics number 7 and 11 to 15 need CI. It can be seen that quality characteristics number 7, 11 and 12 need both CI and MI, simultaneously. In addition, MI for quality characteristics number 2, 4, and 6 to 12, is performed after operations 6, 6, 6, 15, 15, 10, 10, 15, and 15, respectively. Similarly, CI for all quality characteristics number 7 and 11 to 15 is performed after operations number 15 (i.e., at the end of production line). It is noteworthy that CI is performed for characteristics with lower value of capabilities, while the lower the value of Cp and Pp are, the higher the number of scraps is.
Figure 7: Which-What and When decisions for a sample Pareto solution.
6- Conclusion
Variation management is typically done in the factory during production. It can be defined as the resources allocation to reduce or/and mitigate the impact of the manufacturing imprecisions based on cost and risk. During the past two decades variation management efforts have been moved upstream to the design stages of products and processes: Design for Six Sigma (DFSS) Robust Design Methodology... Therefore, this paper presents models for the assessment of the key indicator of the relevance of a variation management: cost affected by the variations and the uncertainty. This indicator is very powerful: due to its expression and design, it is a very flexible way to evaluate the relevance of product based on multiple parameters. Several other characteristics could be added to the Marketable Product Total Cost such as its environmental footprint for instance. This addition of several other parameters, taking into account several points of views and their complete satisfactions can evolve this performance evaluation to value assessment [26 and 27]. Regarding the complexity of the stakeholders involved in both design and production of a product, the use of value network concept is an axis to explore in order to generalize and improve the way to evaluate and optimize the numerous products’ performances the designers have to handle.
The application of models is demonstrated through an industrial case study: the tolerance allocation and the inspection process selection of the gear pump. Other applications [28-30] illustrate the scalability of the proposed model.
7- Acknowledgments
The authors would like to acknowledge France embassy in Iran and Campus France for their financial supports.
8- References
[1] Zhang C., Wang H. P. Simultaneous Optimization of Design and Manufacturing - Tolerances with Process (Machine) Selection, CIRP Annals - Manufacturing Technology, 41/1:569-572 (1992)
[2] Lööf J., Hermansson T. Söderberg, R. An Efficient Solution to the Discrete Least-Cost Tolerance Allocation Problem with General Loss Functions, In the proc. of the 9th CIRP International Seminar on Computer Aided Tolerancing (2005)
[3] Schmitt R., Behrens C. A Statistical Method for analyses of Cost- and Risk optimal Tolerance Allocations based on Assured Input Data, In Proc. of the 10th CIRP International Seminar on Computer Aided Tolerancing (2007)
[4] Moroni G., Petrò S., Tolio T. Early cost estimation for tolerance verification, CIRP Annals - Manufacturing Technology, 60/1:195-198 (2011)
[5] Savio E. A methodology for the quantification of value-adding by manufacturing metrology, CIRP Annals - Manufacturing Technology, 61/1:503-506 (2012)
[6] Kunzmann H., Pfeifer T., Schmitt R., Schwenke H., Weckenmann A., Productive metrology-adding value to manufacture, CIRP Annals - Manufacturing Technology, 54/2:691-704 (2005)
6 Q_CH: 2, 4, 6 10 Q_CH: 9, 10 15 Q_CH: 7, 8, 11, 12 Q_CH: 7, 11-15 MI CI Operation
[7] Mirdamadi S., Etienne A., Hassan A., Dantan J.Y., Siadat A. Cost Estimation Method for Variation Management, Procedia CIRP, 10:44-53 (2013)
[8] Ullman D. G. The Mechanical Design Process, McGraw-Hill (2010)
[9] Beitz W., Pahl G., and Wallace K. Engineering design: a systematic approach, Springer (2007) [10] Thornton A.C, Tata M. Process capability database usage in industry: Myth vs. reality. In Proc. of the ASME Design Engineering Technical Conferences (1999)
[11] Srinivassan V. An integrated view of geometrical product specification and verification, In Proc. of the CIRP Seminar on Computer Aided Tolerancing (2001)
[12] Etienne A., Dantan J.Y., Siadat A., Martin P. Cost estimation for tolerance allocation, In Proc. of the 10th CIRP International Seminar on Computer Aided Tolerancing (2007)
[13] Speckhart F.H., Calculation of tolerance based on a minimum cost approach, Journal of Engineering for Industry, ASME, 94, Mai 1972, pp. 447-453
[14] Sutherland G.H. and Routh B., Mechanism design: Accounting for manufacturing tolerances and costs in function generating problems, Journal of Engineering for Industry, 97, February 1975, pp. 283-286
[15] Abel-Maleck L., Asadathorn N., An analytical approach to process planning with rework option, International journal of production economics, 46-47, 1996, pp. 511-520
[16] Duverlie P. and Castelain M., Cost estimation during design step: Parametric method versus case based reasoning, International journal of advanced manufacturing technology, 15, 1999, pp. 895-906 [17] Kim G.H., An S.H. and Kang K.I., Comparison of construction cost estimating models based on regression analysis, neural networks, and case-based reasoning.” Building and environment, 39, 2004, pp.1235-1242
[18] Feng C.X., Kusiak A., Huang C.C., Cost evaluation in design with form features, Computer aided design, Elsevier science ldt., 28(11), 1996, pp. 879-885
[19] Johnson H.T. and Kaplan R.S., Relevance cost: the rise and fall of management accounting, Harvard business school press, 1987
[20] Gupta M. and Galloway K., Activity based costing and management and its implications on operations management, Technovation, Elsevier science ltd., 23(3), 2003, pp. 131-138
[21] Bosch Mauchand M., Siadat A., Perry N., Bernard A. VCS: value chains simulator, a tool for value analysis of manufacturing enterprise processes (a value-based decision support tool), Journal of Intelligent Manufacturing, Springer Editor, 23/4:1389-1402 (2012)
[22] Etienne A., Dantan J.Y., Qureshi J., Siadat A. Variation management by functional tolerance allocation and manufacturing process selection, International Journal on Interactive Design and Manufacturing, 2/4:207-218 (2008)
[23] Pfeiffer T. Production metrology. ISBN 3486258850. Oldenbourg (2002)
[24] Zhao F., Xu X., Xie S.Q. Computer-Aided Inspection Planning-The state of the art. Computers in Industry, 60: 453–466 (2009)
[25] Mohammadi M., Siadat A., Dantan J.Y., Tavakkoli-Moghaddam, R. Mathematical modelling of a robust inspection process plan: Taguchi and Monte Carlo methods. International Journal of Production Research, 53/7 (2014)
[26] Shah L. A., Etienne A., Siadat A., Vernadat F., Decision-Making in the Manufacturing Environment Using a Value-Risk Graph, Journal of Intelligent Manufacturing,1-14 (2014)
[27] Vernadat F., Shah L., Etienne A., Siadat A., VR-PMS: a new approach for performance measurement and management of industrial systems, International Journal of Production Research, Ed. Taylor & Francis, pp1-19 (2013)
[28] Mousavi M., Mirdamadi S., Siadat A., Dantan, J.-Y., Tavakkoli-Moghaddam, R. A new intuitionistic fuzzy grey model for selection problems with an application to the inspection planning in manufacturing firms, Engineering Applications of Artificial Intelligence, 39:157-167 (2015)
[29] Hassan A., Siadat A., Dantan J.Y., Martin P. Conceptual process planning an improvement approach using QFD, FMEA, and ABC methods. Robot Comput Integrated Manuf, 26/4:392-401, (2010)
[30] Hassan A., Siadat A., Dantan J.Y., Martin P. A quality/cost-based improvement approach for conceptual process planning. International journal of Management Science and Engineering Management, 4/3:188-197 (2009)