HAL Id: inserm-00856213
https://www.hal.inserm.fr/inserm-00856213
Submitted on 23 Apr 2014
HAL is a multi-disciplinary open access
archive for the deposit and dissemination of
sci-entific research documents, whether they are
pub-lished or not. The documents may come from
teaching and research institutions in France or
abroad, or from public or private research centers.
L’archive ouverte pluridisciplinaire HAL, est
destinée au dépôt et à la diffusion de documents
scientifiques de niveau recherche, publiés ou non,
émanant des établissements d’enseignement et de
recherche français ou étrangers, des laboratoires
publics ou privés.
A water soluble probe with near infrared two-photon
absorption and polarity-induced fluorescence for
cerebral vascular imaging
Julien Massin, Azzam Charaf-Eddin, Florence Appaix, Yann Bretonnière,
Denis Jacquemin, Boudewijn van der Sanden, Cyrille Monnereau, Chantal
Andraud
To cite this version:
Julien Massin, Azzam Charaf-Eddin, Florence Appaix, Yann Bretonnière, Denis Jacquemin, et al.. A
water soluble probe with near infrared two-photon absorption and polarity-induced fluorescence for
cerebral vascular imaging. Chemical Science , The Royal Society of Chemistry, 2013, 4 (7),
pp.2833-2843. �10.1039/c3sc22325f�. �inserm-00856213�
Journal Name
Cite this: DOI: 10.1039/c0xx00000x
www.rsc.org/xxxxxx
Dynamic Article Links
►
ARTICLE TYPE
This journal is © The Royal Society of Chemistry [year] [journal], [year], [vol], 00–00 | 1
A water soluble probe with near infra-red two-photon absorption and
polarity-induced fluorescence for cerebral vascular imaging
Julien Massin,
aAzzam Charaf-Eddin,
bFlorence Appaix,
cYann Bretonnière,
aDenis Jacquemin,
b,d*Boudewijn van der Sanden,
c*Cyrille Monnereau
a*and Chantal Andraud
aReceived (in XXX, XXX) Xth XXXXXXXXX 20XX, Accepted Xth XXXXXXXXX 20XX
5
DOI: 10.1039/b000000x
A water soluble Lemke chromophore’s derivative shows unusual polarity dependence of its emission
efficiency, leading to a strong red-NIR fluorescence in water when fitted with appropriate water-solubilizing polymer chains. In this contribution, the synthesis of the chromophore is described. The dependence of its fluorescence on solvent polarity is investigated experimentally then rationalized on the
10
basis of ab initio calculations. Finally, we demonstrate that this chromophore is a valuable candidate for in vivo two-photon imaging of the cerebral vasculature, with two-photon absorption and emissions in the biological transparency window.
Introduction
In recent years, two-photon laser scanning microscopy (TPLSM),
15
especially intravital, has emerged as an essential tool in biomedical research and has nowadays become a routine technique to track biological processes down to the cellular level in the living animal.1-4 In this context, fluorophores presenting
electronic transitions of the “intramolecular charge transfer”
20
(ICT) type are considered as a particularly appealing class of molecules. The peculiar linear (environmental sensitivity, solvatochromism5) and non-linear (two-photon absorption,6-8 second harmonic generation9) spectroscopic properties associated to ICT transitions have been taken advantage of for the
25
development of functional materials, including pH10, 11 or polarity probes12, 13 and biosensors14, 15 with one or two-photon induced fluorescence. These fluorophores are inherently lipophilic, because of their extended conjugated carbon backbone.6 Thus, major efforts have been put on the improvement of their
30
solubility in biological media and their biocompatibility. In that context, it has been shown by Müllen and coll. that controlled growth of a star-shaped polymer shell around a central fluorophore was a particularly effective strategy.16-18 Moreover, we have recently given a proof of principle that such structures
35
were valuable candidates for the vectorization of two-photon fluorophores into cells.19 We showed that the resulting structures showed good-to-very-good conservation of their two-photon brightness in aqueous medium, with emission wavelengths up to 570 nm. This result was however not fully optimal for in-vivo
40
two-photon imaging applications, since it is desirable that the probe features maximal fluorescence in the biological window, ie at a wavelength between 700-1000 nm.20-22
In this range of wavelengths, it is well documented that the fluorescence efficiency of strongly solvatochromic ICT
45
chromophores is generally decreased. This can be explained on
the basis of the energy gap law, which postulates that non-radiative decay kinetic constants increase exponentially upon decreasing emission energy.23-25 Moreover this energy gap mediated quantum yield (QY) decrease is often amplified in polar
50
and/or protic solvents because of enhanced electrostatic
interactions of the latter with the chromophore’s strongly
polarized ICT excited state.26 Finally, as mentioned above, ICT chromophores are generally inherently hydrophobic, which can lead to formation of molecular aggregate in protic solvents such
55
as alcohols or a fortiori water and can give rise to multiple additional non-radiative decay pathways.27
In a recent paper, several of us reported a series of red emitting Lemke’s fluorophores (named after their initial discoverer28) based on an dicyanoisophorone motif, as solid state luminescent
60
materials.29 Beside their solid-state fluorescence, another spectroscopic property raised our interest: whereas these red fluorophores were hardly emitting in low-polarity solvents, like toluene, we noticed that their fluorescence QY gradually increased upon increasing solvent polarity. We felt that this
65
particular feature could be taken advantage of in the context of bio-imaging applications which require probes that feature strong emission intensity in physiological fluids, preferentially in the biological transparency window.30, 31 We must underline that although Lemke’s type chromophores have been extensively
70
investigated in the context of second order nonlinear optics32 (second harmonic generation33 and electro-optic modulation34-36), their luminescence properties have surprisingly been only sparingly studied and mostly in the solid state, these compounds being considered essentially non emissive in solution. 29,37, 38
75
Thus, in the present paper, we report the full study of the first
example of a water soluble Lemke’s chromophore oligomerised
derivative (Lem-PHEA) and of its precursor (Lem-In). We show for the first time that both compounds display unusually strong
2 | Journal Name, [year], [vol], 00–00 This journal is © The Royal Society of Chemistry [year]
polarity induced enhancements of their luminescence QY along with significant red-shift of their emission, to reach, in the case of
Lem-PHEA, 0.25 at 674 nm in water. Moreover, based on
theoretical calculations we suggest a possible explanation regarding the origin of this peculiar behaviour, namely a solvent
5
mediated change in the potential energy surface of the first electronically excited state of the molecule. This makes the latter a good candidate for in vivo two-photon imaging of the cerebral vascular in the biological transparency window.
Results and discussion
10
Synthesis
Oligomerized compound Lem-PHEA was synthesized following the general methodology introduced in a previous paper19 and depicted in Scheme 1. In a first step, a bromoisobutyryl moiety, which is classically used as a polymerization initiator in ATRP
15
synthesis, was introduced through a simple, high yielding esterification procedure on the two terminal hydroxyl groups of
Lem-OH precursor (which was itself obtained by
well-established literature procedures). The resulting compound,
Lem-In, was then involved in an ATRP polymerisation procedure with
20
(hydroxyethyl)acrylate (HEA) used as a monomer, a Cu(II)/bipy catalyst, and THF as a co-solvent for the reaction. This procedure allowed to obtain an oligomerized object with precise control over chain length (ca 10-12 monomer unit on each arm, as calculated from 1H NMR integrations) as evidenced by 1H NMR
25
and GPC (Figures S8). Lem-PHEA and its precursors Lem-OH and Lem-In were further characterized by 1H and 13C NMR (Figure S7), IR, UV-vis and fluorescence spectroscopy (see experimental for details).
30
Linear spectroscopy: experiments
Spectroscopic measurements were next undertaken on the polymeric Lem-PHEA and its precursor Lem-In. As
35
mentioned in introduction, solution luminescence spectroscopy of this class of chromophores had never been the object of systematic,
40
detailed investigations in previous literature. Thus, this study was mainly aiming at elucidating some of the relation that exists between the solvent
45
dependent emission energy of the fluorophore and other key spectroscopic parameters of the later (spectral bandwith, fluorescence quantum yield,
50
Stokes shift...), in order to better understand the origin of its polarity induced emission. To this end, In and
Lem-PHEA were studied in different
55
solvents that were chosen to cover the largest possible range of polarity, viscosities, and protic or non-protic character. Absorption and fluorescence emission spectra of both compounds were systematically recorded. Quantum yields (QY) were calculated from integration of the fluorescence intensity at
60
various concentrations and comparison to a standard (erythrosine). Absorption and emission curves are reported in Figure 1 whereas the main spectroscopic values are listed in Table 1.
65
First of all, for both compounds, broad, structureless emission bands were observed in all solvents of the study, which confirms the ICT character of the emission. The tendency observed qualitatively in our previous report (see Introduction) was fully verified for both objects: upon increasing solvent’s polarity
70
(according to Lippert’s polarity scale) from toluene to DMSO for
Lem-In and from dioxane to water for Lem-PHEA, a significant
red-shift of the emission energy was observed (positive solvatochromism), which was accompanied with a marked increase of fluorescence QY (negative solvatokinetic) along with
75
progressive narrowing of the emission band. A plot of the
Figure 1. Normalized absorption (top) and emission (bottom) spectra of Lem-In (left column) and Lem-PHEA
(right column) in the solvents of the study 0 0,2 0,4 0,6 0,8 1 380 430 480 530 580 630 680 toluene dioxane dichloromethane octanol tetrahydrofuran acetonitrile methanol dimethylsulfoxide 0 0,2 0,4 0,6 0,8 1 500 550 600 650 700 750 800 toluene dioxane dichloromethane octanol tetrahydrofuran acetonitrile methanol dimethylsulfoxide 0 0,2 0,4 0,6 0,8 1 380 430 480 530 580 630 680 dichloromethane dioxane tetrahydrofuran acetonitrile methanol dimethylsulfoxide water 0 0,2 0,4 0,6 0,8 1 500 550 600 650 700 750 800 chloroforme dioxane tetrahydrofuran acetonitrile methanol dimethylsulfoxide water Wavelength (nm) Wavelength (nm) Wavelength (nm) Wavelength (nm) N o rm a li ze d a b so rb a n c e N o rm a li ze d a b so rb a n c e N o rm a li zed em is si o n N o rm a li zed em is si o n Lem-In Lem-In Lem-PHEA Lem-PHEA dichloromethane
Scheme 1. Synthetic pathway ; reagents and conditions: (i)
2-bromoisobutyril bromide (3 eq.), Pyridine / THF 1:1, RT, 1H (ii) CuBr (1eq.), bipyridine (2 eq.), 2-hydroxyethylacrylate (HEA) /THF (1 : 1),
This journal is © The Royal Society of Chemistry [year] Journal Name, [year], [vol], 00–00 | 3
emission bandwidth versus emission energy clearly reveals, for
Lem-In and Lem-PHEA, a close to linear dependence between
those two parameters, with a bandwidth that narrows upon decreasing emission energy (Figure 2). Meanwhile, the band shape becomes more symmetric as the emission energy decreases
5
and a Gaussian shape is observed in most polar solvents (e.g. water and DMSO). Interestingly, this tendency is absolutely similar for Lem-PHEA and its precursor Lem-In. Such an evolution, which will be further commented in the following, is opposed to what is classically observed for ICT fluorophores
10
exhibiting positive solvatochromism: their emission band generally tends to become more broadened and structureless as solvent polarity increases, as a consequence of increased interactions with the solvent.5
Changes in emission energy and dependence of the Stokes shifts
15
values on solvent polarity are important features in the context of ICT chromophores, since both parameters can be used in the engineering of polarity probes.5, 39 On a more fundamental point
of view, their study allows determining some important
parameters of the molecule, like its dipolar moment at the ground
20
( g) and excited ( e) states and the electronic reorganisation
(change in dipole moment CT) that accompanies the transition
between the ground and excited states.40, 41 These parameters were thus investigated for Lem-In and Lem-PHEA. In the case of Lem-In, absorption and emission energies as well as Stokes
25
shift values showed a clear tendency to increase upon increasing solvent polarity (positive solvatochromism), thereby indicating an increased dipole moment at the excited state. This is consistent with what had been observed for related chromophores in our previous contribution.29 The trend could be fitted with an
30
acceptable correlation factor to Lippert-Mataga polarity scale13, 42,
43
, (Figure S1) which allowed us to estimate dipole moments of the chromophore at its ground and excited states of g= 10.5 D
and e= 24.5 D , respectively, and a change in dipole moment CT=13.5 D. The situation is however not so straightforward to
35
analyze for Lem-PHEA, since the polarity environment of the chromophore is in this case not only determined by the nature of
Table1. Relevant spectroscopic data
Solvent f max (nm) em (nm) cm 1/2 cm fa f (ns)b M-1.cm-1) TPA (GM) Lem-in toluene 0.013 474 602 4490 3300 0.008 <0.1 27900 - dioxane 0.02 474 606 4600 3080 0.016 0.13 - - CH2Cl2 0.21 482 630 4870 2550 0.025 0.2 28200 530 CHCl3 0.14 482 633 4950 2520 0.016 0.24 - - TFH 0.21 486 637 4877 2440 0.04 0.3 - - octanol 0.22 485 646 5140 2412 0.045 0.66 - - AcCN 0.305 484 661 5530 2050 0.07 0.5 - - MeOH 0.31 484 664 5600 2045 0.1 0.7 - - DMSO 0.26 508 680 4979 1940 0.3 1.3 30200 - Lem-PHEA dioxane 0.02 478 630 5050 2920 0.049 0.48 - - CH2Cl2 0.21 490 640 4780 2400 0.045 0.58 - - CHCl3 0.14 494 642 4670 2680 0.032 0.53 - - TFH 0.21 486 652 5240 2562 0.083 0.65 - - AcCN 0.305 483 668 5730 2080 0.12 0.67 - - MeOH 0.31 494 670 5317 1980 0.14 0.86 - - DMSO 0.26 500 678 5250 2050 0.26 1.34 - - H2O 0.32 510 676 4810 1930 0.22 1.14 21000 440
a/ ex = 488 nm, reference is erythrosine in MeOH ( ref=0.09), error margin ± 5% b/ ex= 490 nm, error margin ± 5%
Figure 2. Plot of emission band-width vs energy at the maximum of the
emission (as found in the solvatochromic study, Table 1). Linearization were performed independently for data obtained with Lem-In (dashed
line) and Lem-PHEA (dotted line)
Figure 3. Plot of fluorescence quantum yield vs excited state lifetime
((as found in the solvatochromic study, Table 1); data in the blue frame correspond to fluorescence lifetime ≤0.3 ns, which corresponds to the
lower limit of the detector, hence cannot be considered meaningful. Linear regression was performed on the joint data for Lem-In and
4 | Journal Name, [year], [vol], 00–00 This journal is © The Royal Society of Chemistry [year]
the solvent, but by a more subtle interplay between chromophore/solvent and chromophore/polymer chain interactions. Indeed, it had been already established in our previous contribution devoted to alike water-soluble polymerized chromophores19 that the polymer chain adopts different folding
5
and orientations around the chromophore depending on the nature of the solvent. Thus, we were unable to identify a clear trend in Stokes shift and emission band position for Lem-PHEA (Figure S1).
Excited state lifetimes were also investigated for both systems in
10
the same range of solvents as for QY measurements. A near-linear dependence of fluorescence quantum yield on excited state lifetime could be noticed. The trend was so alike for both compounds that their data were fitted jointly (Figure 3). These data allowed us to calculate radiative (kr) and non-radiative (knr)
15
kinetic constants for excited state decay (Figure S3): although kr
slightly increases with solvent polarity, it remains in a comparable range in every solvent (0.8 - 1.9 x 10⁸s-1). In striking contrast, it can be noticed that a variation of more than one order of magnitude is observed for knr (1 x10¹⁰ to 7 x 10⁸ s-1).
20
Altogether, this constitutes an unambiguous evidence that variations of the fluorescence quantum efficiency are mainly connected to modifications in the non-radiative excited state decay kinetic which decreases as polarity increases.
An even more peculiar spectroscopic behaviour of these
25
fluorophores was detected when plotting the evolution of their luminescence quantum efficiency (Figure 4) or alternatively effective. In Table S-1 in SI, we compare the XRD and DFT bond lengths fluorescence lifetime (see Figure S2) versus emission energy. Whereas the energy gap law predicts an exponential
30
increase of non-radiative excited state decay kinetics and therefore an exponential decrease of the quantum efficiency upon red-shift of the luminescence,24 the observed evolution for our dyes seems to follow a fully reverse trend. Indeed, the data obtained for both Lem-In and Lem-PHEA could be jointly fitted
35
with satisfactory accuracy (r2= 0.921) to an inverse model, with an exponential increase of fluorescence lifetime and quantum efficiency upon luminescence red-shift. As mentioned before, this
evolution is correlated with a significant sharpening of the emission band. This is indicative that the vibronic contributions
40
or the nature of the potential energy surfaces which result in the shoulder of the emission band in low-polarity solvents (see toluene), tend to vanish in polar ones (see DMSO). These changes also translate into the increased non-radiative contribution to the ES decay observed in non-polar solvents
45
(Figure S3). This point will be further discussed in the next section of this article. As a result, Lem-In and Lem-PHEA show a strongly negative solvatokinetic, ie their largest luminescence intensity was obtained in the most polar solvents of the study (DMSO for Lem-In, DMSO and water for Lem-PHEA). A
50
closer examination of the data rules out simple explanations that could account for this peculiar behaviour, such as restriction of vibronic deactivations of the excited state through hydrogen bonding or solvent viscosity. On the one hand, hydrogen-bond donor solvents, such as octanol, methanol and water perfectly
55
follow the overall trend, and do not show any remarkable behaviour. On the other hand, solvents of close polarity, but of very different viscosities such as THF (ca =0.5 cP) and octanol (ca =9 cP) show similar results in terms of fluorescence efficiency of the probes. An interesting consequence for
60
biophotonic related applications is that, in contrast to most existing fluorescent bio-probes and polarity sensors, Lem-PHEA presents a luminescence that is turned on in a polar environment like blood or physiological fluid. This can be a very favourable feature for angiographic applications as we will discuss latter.
65
Linear spectroscopy : theoretical calculations
To obtain further insights regarding the nature of the excited-states, and to assess the origin of the experimentally observed polarity induced fluorescence Time-Dependent Density Functional Theory (TD-DFT) calculations have been performed
70
on a model compound, referred to as Lem (Figure 5a, see Experimental Section for computational details). First, calculations were carried out with the least polar solvent, namely toluene, for which the selected continuum solvation model, which does not account for any specific solute-solvent interaction(s),
75
Figure 4. Plot of fluorescence quantum yield vs emission energy (as
found in the solvatochromic study, Table 1). Exponential fit was performed on the joint data for Lem-In and Lem-PHEA
Figure 5: Left (a) Model compound (Lem) used for calculations (b)
density difference plot computed in toluene: red (blue) zones correspond to increase (decrease) of density upon photon absorption (isovalue: 6x10 -4 a.u. (c) stick and convoluted vibrationally resolved absorption spectra
in toluene.(d) stick and convoluted vibrationally resolved emission spectra in toluene.
This journal is © The Royal Society of Chemistry [year] Journal Name, [year], [vol], 00–00 | 5
should be very measured along the -conjugated path. As can be seen, there is a very good agreement between theory and experiment for both absolute distances (MAD < 0.01 Å) as well as the bond length alternation (BLA), which confirms the accuracy of the selected level of theory. Moving from the ground
5
to the lowest-lying excited state (which is the only state accessible in this range of energy, as confirmed by our calculations) induces a strong decrease of the BLA (-0.033 Å), which is characteristic of a more delocalized excited-state, as expected. In the same vein, the density-difference plot (Figure
10
5b) clearly confirms a strong CT character from the diethylamino side to the cyano groups, with a significant electronic reorganization on the connecting bridge. The ICT distance, estimated as the separation between the barycenters of electron density gain/loss, reaches 3.75 Å and is accompanied by a strong
15
enlargement of the dipole moment (+11.8 D) upon electronic transition, a trend that is in remarkable agreement with the experiment (see above). The vibrationally resolved absorption and emission spectra can be found in Figures 5c and 5d, respectively. For absorption, one computes a maximum at 453
20
nm, which is close to the experimental spot (474 nm). The theoretical FWHM is 3610 cm-1 for the absorption band. Apart from low-frequency vibrations close to the 0-0 point, the width of the absorption band can be explained by a series of vibronic couplings in the 430-445 nm domain. They imply to a complex
25
mix of modes, but the strongest contributions correspond to intense stretching modes related to the alteration of the single/double bond nature along the conjugated skeleton. For instance, an effective conjugation coordinate (ECC) mode at 1607 cm-1 (in the ES) located on the central vinylic moiety is
30
responsible for the most intense peak close to 430 nm. Consistently with measurements, the fluorescence band is also asymmetric, and presents a FWHM of 2859 cm-1, which is slightly above the experimental reference (3300 cm-1, see Table 1). However, the computed position of em is 482 nm,
35
significantly off the experiment (602 nm): the TD-DFT Stokes shift is clearly too small. In short, despite an undershot Stokes shift, theory reproduces nicely the band shapes in toluene. We have also simulated the same data in DMSO (Figure S6). In
DMSO, the BLA is slightly smaller to the one computed in the
40
apolar environment for the ground-state (0.056 Å in DMSO versus 0.061 Å in toluene), the reverse holding for the excited-state (0.034 Å in DMSO versus 0.028 Å in toluene). Therefore the GS/ES variation of the main geometrical parameters related to optical properties is smaller in DMSO than in toluene. However,
45
the increase of dipole moment upon absorption (+13.5 D) significantly exceeds the toluene value. Moreover, we computed a FWHM of 3094 cm-1 for the fluorescence in DMSO, which is almost unchanged from toluene. This clearly departs from experimental trends (1800 cm-1). Likewise, the fluorescence band
50
is slightly asymmetric in the calculations (Figure S6), which also contrasts with the measurements. To estimate the importance of the non-radiative path, we determined the Huang-Rhys (HR) factors, following the procedure of Peng et al..44 We found that the HR factor decreases from toluene to DMSO. This indicates
55
that non-radiative paths are less effective in the latter and therefore that fluorescence efficiency should increase. Although this result is in qualitative agreement with our experimental observations, the calculated effect (-5%) appears significantly too small to fully account for the dramatic experimental variation,
60
which led us to envision other hypotheses. The theory/experiment differences might be ascribed to i) aggregation, ii) specific solute-solvent interactions iii) anharmonicity or iv) change in the nature of the potential energy surface that are not included in the previous model. The two first factors can be reasonably excluded:
65
on the one hand, aggregation can be almost fully discarded on the basis of concentration-dependence studies on the absorption and fluorescence spectra; on the other hand, simple hydrogen-bonding can be ruled out on the basis of our experiments (vide supra). Interestingly, the third factor (anharmonicity) is known to induce
70
significant deviation from the standard energy-gap law, which could potentially account for the experimentally observed trend for the fluorescence QY.45 Rotation of the terminal groups at the
ES could also account for the experimental trends (fourth factor). Interestingly, investigations on this parameter revealed significant
75
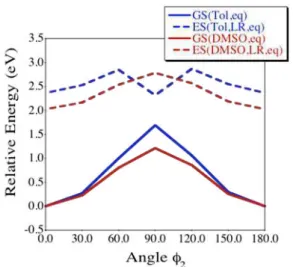
qualitative differences between toluene and DMSO (Figures S4-S5, Figure 6). Indeed, while rotation around the dimethylamino moiety does not yield new minima on both GS and ES surfaces, the rotation around the dicyanovinylene group (angle 2, Figure
S4) yields a twisted minimum (90°) of the ES in toluene, that is
80
absent from the ES in DMSO (Figure 6). Consequently, the ES of Figure 6: Evolution of the relative energies of the GS and ES of
Lem in toluene and DMSO, for twist around 2.
Figure 7. One-(full) and two-photon (full with marks) absorption spectra
6 | Journal Name, [year], [vol], 00–00 This journal is © The Royal Society of Chemistry [year]
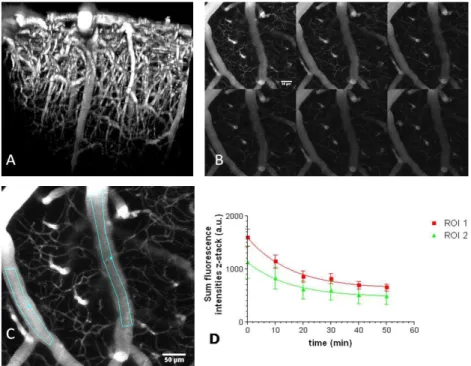
Figure 8 Functional cerebral vasculature in motor cortex of a 6 months old CD1 mouse at
different times after i.v. injection of Lem-PHEA. 7a) Lateral view of the 3D-reconstruction of a z-stack until a depth of 520 µm at 5 min after i.v. injection of Lem-PHEA showing the plunging arteries and draining veins. 7b) Z-projections of the sum of fluorescence intensities at 10,20,30,40
50 and 60 min after injection. 7c) A Z-projection of the sum of the intensities at 10 min showing the ROI 1 & 2 for half-life time analysis. 7d) Half-time analysis of Lem-PHEA in the blood plasma using a one phase mono-exponential decay (Y = Span*exp(-K*x)), the values are the means of fluorescence intensities in the ROI (z-projection of the sum of the intensities) with their
standard deviations (bars): results curve fitting (GraphPad Prism version 3.02, GraphPad Software, Inc, La Jolla, CA, USA)): ROI 1= K = 0.06429, half-life time = 10.78 min, R2 = 0.993,
Fit data ROI 2 = K = 0.06472, half-life time = 10.71 min, R2 = 0.990. Scale bar = 50 µm.
the emitter is predicted to be more rigid in DMSO than in toluene, which in turn could account for the difference of band shapes. As can be seen in Figure 6, this 90° structure presents an energetic minimum at
5
the ES, slightly lower in energy than the planar conformation. Interestingly GS and ES energies of this 90° structure are very close on the energetical scale, hinting a possible conical intersection46 that would
10
offer a supplementary non-radiative pathway in toluene but not in DMSO. To say it differently, we suggest that the much lower ES-GS energy gap of the 90° twisted structure could explain its non-emissive
15
nature. This leads us to conclude that the very strong reverse solvatokinetic effect observed experimentally cannot be fully explained by harmonic vibronic couplings, or by electrostatic effects between the
20
solute and the solvent, but is most likely related to a change of the surface potential at the ES.
Two-photon absorption
Two-photon absorption properties of
Lem-25
PHEA in water were evaluated and
compared with those of its precursor
Lem-In in dichloromethane, in order to
determine whether our strategy also allowed an adequate conservation of this
30
parameter. Two-photon absorption cross-sections ( TPA) were measured using
two-photon induced fluorescence experiments (see material and methods section for details). The results are reported in figure 7, along with the linear absorption spectra Lem-In and Lem-PHEA
35
in corresponding solvents. From these experiments, it is clear that only a slight decrease of TPA occurs between Lem-In in
dichloromethane and Lem-PHEA in water, which is found to reflect the evolution their respective linear molar extinction coefficient. This demonstrates that Lem-PHEA, with a TPA =
40
440 GM and a maximal two photon brightness ( TPA. f) of about
100 GM, is unarguably a valuable candidate for the target application.
In vivo two-photon microscopy
In order to evaluate its potential as bio-marker, Lem-PHEA was
45
used in TPLSM of the functional cerebral vasculature in the motor cortex of mice brain, see materials and methods section. As it could be anticipated from the emission spectrum of the probe in water, its fluorescence emission intensity in vivo was higher in the NIR region in comparison to the red region (Figure S9) for an
50
excitation wavelength of 950 nm. At this excitation wavelength no background endo-fluorescence of tissues was detected. After intra-venous (i.v.) injection, Lem-PHEA circulated freely in the blood plasma with no adhesion to the vessel wall (Figure 8a), This is important for, i) longitudinal imaging of the blood
55
circulation, and ii) decreased long-term vascular toxicity. The red/NIR fluorescent emission in vivo is less diffused by brain
tissues, which resulted in a maximal observation depth of 520 µm in the adult mouse brain (Figure 8a) at normal laser power for in vivo experiments: maximum 50 mW at the entrance of the
60
objective.
In a time series experiment, the half-life time of Lem-PHEA in the blood plasma was estimated in the order of 11 min (see Figure 8b-d). The clearance of the dye by the kidneys started already at 30 min after injection (Figure S10a). At this time the dye is
65
observed in collecting tubules of the kidney and after two hours no dye was detected in the renal vascular compartment (Figure S10b-c). In the liver, Lem-PHEA stayed in the vascular compartment and was not found in hepatic cells for at least 2 hours after injection (Figure S10d). Thus renal clearance of
Lem-70
PHEA is most probably preferred over liver metabolism of the
dye. Such a fast renal clearance precludes its use for intravital microscopy studies of blood physiological phenomena exceeding 1 hour. On the other hand, it constitutes a very positive result with regard to long-term toxicity of the compound in vivo. In the
75
future, it could be envisioned to extend Lem-PHEA circulation time by enhancing polymer chains length, as already illustrated in the past for related systems.47
Experimental
Materials and methods
80
This journal is © The Royal Society of Chemistry [year] Journal Name, [year], [vol], 00–00 | 7
All solvents were used as received from the supplier. 2-bromoisobutyryl bromide and bipyridine are commercially available and used as received from the suppliers. Copper (I) bromide (Aldrich, 98%) was suspended in glacial acetic acid, filtered and washed with acetic acid then thoroughly rinsed with
5
ethanol . After extensive drying under vacuum it was stored at 4°C under argon. Hydroxyethylacrylate (HEA) was passed through a short pad of alumina prior to use. (E)- 2,2’-(4-(2-(3-
Dicyanomethylene)-5,5-dimethylcyclohex-1-
enyl)(vinyl)phenylazanediyl)bis(ethane)bis(ethane-2,1-10
diyl)diacetate was synthesized according to previouly reported literature methodologies. 29 Column Chromatographies were
performed on Merck Gerduran 60 (40-63 μm). NMR spectra (1H,
13
C) of the monomers and polymers were recorded at room temperature on a BRUKER 200 AVANCE and BRUKER 500
15
respectively. Data are listed in parts per million (ppm) and are reported relative to tetramethylsilane (1H, 13C), residual solvent peaks being used as internal standard. FTIR spectra (ATR) were performed on solid samples using a JASCO FT/IR 4100 spectrometer equipped with a JASCO ATR PRO450-S ATR
20
module. HRMS measurements were performed by ESI-TOF: a Bruker Daltonics ® Micro TOF-Q II was used with a resolution of 8000, in positive mode with a capillary tension of 4500V, a source temperature of 180°C, and a cone tension of 60V. The internal reference used for calibration was sodium formate.
25
Elemental analyses were performed on a Flash EA1112 CHNS/O Thermo Electron micro-analyzer. Polymers were analyzed by size exclusion chromatography (SEC) in DMF (+ LiBr, 1 g·L-1) at 60 °C, at a flow rate of 0.8 mL·min-1 and at a concentration close to 6 mg·mL-1 after filtration through 0.2 µm pore size membrane. The
30
steric exclusion was carried out on two PSS GRAM 1000 Å columns (8 300 mm; separation limits: 1 to 1000 kg·mol-1) and one PSS GRAM 30 Å (8 300 mm; separation limits: 0.1 to 10 kg·mol-1) coupled with a differential refractive index (RI)
detector, a viscosimeter (Viscotek, Dual 250) and a light
35
scattering (LS) detector (MiniDawn from Wyatt Technology,
laser λ = 690 nm at 90°, 45° and 135°). The polydispersity
indexes (PDI = Mw/Mn) of the samples were derived from the RI
signal by a calibration curve based on PMMA standards (Polymer Standards Service). The number-average molar mass (Mn) were
40
calculated from RI signals with the OmniSEC 4.6 software. Polymer size (Mn) was also calculated with 1H spectroscopy, by
comparison of the integration values found for the methyl
end-groups of the initiator (signal “a” of the polymer, SI), and for the side chain hydroxyethyl group (signals “d” and “e” of the
45
polymer, SI).
Spectroscopy
UV-Visible spectra were recorded with a Jasco 670 UV-Visible spectrophotometer. The luminescence spectra were measured using a Horiba-Jobin Yvon Fluorolog-3® spectrofluorimeter. The
50
steady-state luminescence was excited by the unpolarised light from a 450W xenon CW lamp and detected at an angle of 90° for diluted solution measurements (10 mm quartz cuvette) by a red-sensitive Hamamatsu R928 photomultiplier tube. Spectra were reference corrected for both the excitation source light intensity
55
variation (lamp and grating) and the emission spectral response (detector and grating). Fluorescence quantum yields Q were measured in diluted water solutions with an optical density lower
than 0.1 using the relative method based on following equation: Qx/Qr = [Ar( )/Ax( )][nx2/nr2][Dx/Dr]
60
where A is the absorbance at the excitation wavelength ( ), n the
refractive index and D the integrated luminescence intensity. “r” and “x” stand for reference and sample. Here, reference is
erythrosine in MeOH (Qr = 0.45) at 488 nm. Excitation of reference and sample compounds was performed at the same
65
wavelength. The TPA cross-section spectra were obtained by two-photon excited fluorescence measurement of dilute dichloromethane solutions of the compound using a Ti:sapphire femtosecond laser in the range 700-900 nm. The excitation beam (5 mm diameter) was focalized with a lens (focal length 10 cm) at
70
the middle of the fluorescence cell (10 mm). The fluorescence, collected at 90° to the excitation beam, was focused into an optical fiber (diameter 600 m) connected to an Ocean Optics S2000 spectrometer. The incident beam intensity was adjusted to 50 mW in order to ensure an intensity-squared dependence of the
75
fluorescence over the whole spectral range. The detector integration time was fixed to 1 s. Calibration of the spectra was performed by comparison with the published 700-900 nm Coumarin-307 and fluorescein two photon absorption spectra.48 The measurements were done at room temperature in
80
dichloromethane and at a concentration of 10-4 or 10-5 M.
Calculations
TD-DFT was used to probe the nature of the excited-states of the Lem dyes where the only structural simplification was the use of
85
NEt2 donating group (see Figure 6). We have applied a
computational protocol similar to the one applied in a recent benchmark paper49 and we redirect the interested reader to this contribution for further technical details and discussion. The ground and excited-state structures have been optimized using
90
analytic DFT and TD-DFT gradients, respectively. These force minimizations have been performed until the residual mean square force is smaller than 1x10⁻⁵ a.u. The harmonic vibrational frequencies of both states have been computed on the optimal geometries using analytic and numerical differentiation for GS
95
and ES, respectively. This allowed to ascertain the nature of the minima but also to determine vibronic couplings. The vibrationally resolved spectra -within the harmonic approximation- were computed using the FCclasses program.50, 51 The reported spectra have been simulated at 298K using a
100
convoluting Gaussian functions presenting a full width at half-maximum (fwhm) of 0.06 eV. A maximal number of 25 overtones for each mode and 20 combination bands on each pair of modes were included in the calculation. The maximum number of integrals to be computed for each class was set to 1x10⁶. In our
105
calculations, the electrostatic interactions between the dye and the environment have been modelled thanks to the PCM model that restores valid solvent effect, as long as no specific solute-solvent interactions take place.52 The adiabatic energies and consequently the position of both absorption and fluorescence maxima in
110
vibrationally resolved spectra have been evaluated using the state-specific (SS) PCM model that allows to correctly polarize the excited-state cavity.53 Again, we redirect the interested reader
to Ref. 49 for a detailed discussion on the procedure used to determine the adiabatic point. All our calculations have been
115
performed with the Gaussian 09.A02 program54 using the CAM-B3LYP functional55 and the 6-31+G(d) atomic basis set that are
8 | Journal Name, [year], [vol], 00–00 This journal is © The Royal Society of Chemistry [year]
known to be a valuable combination for TD-DFT calculations.49 The ICT parameters have been computed using a recently proposed density-based model.56
In-vivo two-photon microscopy
5
In accordance with the policy of Grenoble Institute of Neuroscience (GIN) and the French legislation, experiments were done in compliance with the European Community Council Directive of November 24, 1986 (86/609/EEC). The research involving animals was authorized by the Direction
10
Départementale des Services Vétérinaires de l’Isère – Ministère de l’Agriculture et de la Pêche, France and the Direction
Départementale de la protection des populations - Préfecture de
l’Isère-France (F. Appaix, PhD, permit number 38 09 39). All
efforts were made to minimize the number of mice used and their
15
suffering during the experimental procedure. CD1 Mice were housed in cages with food and water ad libitum in a 12 h light/dark cycle at 22 ± 1 °C.
For in vivo TPLSM, 6 months old CD1 mice (n=4) were anesthetized using isoflurane (5% for induction and 1-2% during
20
experiments) in a 70% air, 30% O2 gas mixture. Their body
temperature was monitored with a rectal probe and maintained at 36°C using a heating blanket. A catheter (NeoflonTM, BD, USA) was inserted in the tail vein for an intravenous (iv) injection of 0.1 ml Lem-PHEA solution at a concentration of 4 mg/ml just
25
before the imaging experiments. For the two-photon imaging of the cerebral vasculature, a craniotomy of 2-3 mm in diameter was performed with a surgical drill above the motor cortex and filled with ultrasound gel. (The head was fixed in a homebuilt stereotactic frame.)
30
Two-photon microscopy was performed using a LSM 7 MP (Zeiss, Germany) equipped with a 20x water-immersion objective (NA 1.0; Zeiss) and ZEN 2010 software. Laser excitation at 950 nm was done with a Ti:Sapphire laser system (Chameleon Ultra II; Coherent, UK). Red Fluorescence light emission was collected
35
in the epifluorescence configuration using a non-descanned photomultiplier tube with a 617/73 nm filter (Semrock, US). Most two-photon images were acquired as z-stacks with a maximum number of 257 images using the motorized objective with a minimal step of 2 µm between the different x-y planes
40
(512 x 512 pixels, 607.28 µm2) resulting in a maximum observation depth of 520 µm in the motor cortex of an adult mouse. The reconstruction of z-projections: sum of fluorescence intensities of all focal planes in a z-stack, or generation of 3D images were performed with ImageJ software 57.
45
Syntheses
Lem-OH
(E)- 2,2’-(4-(2-(3-Dicyanomethylene)-5,5-dimethylcyclohex-1-
enyl)-(vinyl)phenylazanediyl)-bis(ethane)bis(ethane-2,1-diyl)diacetate (18 mmol) was dissolved in about 20 mL of
50
methanol. Then, a solution of K2CO3 (0.5g) dissolved in H2O (1
mL) was added and the mixture was stirred at room temperature. After 1 hour, the suspension was diluted with water (100 mL). The aqueous layer was extracted three times with CH2Cl2
(3x50 mL) and the combined organic phases were washed with
55
brine (50mL), dried over MgSO4, concentrated under reduced
pressure and purified by flash column chromatography (ethyl acetate/pentane : 1/9) to obtain a pure dark reddish solid. Yield: 5.91 g (87 %). 1 H NMR (d6-DMSO): δ(ppm) 7.37(d, J=9 Hz, 2H), 6.97 (m, 2H), 60 6.53 (m, 3H), 4.61(b, 2H), 3.33(m, 8H), 2.35(m, 4H), 0.81(s, 6H). 13 C NMR (d6-DMSO): δ(ppm)170.3, 158.0, 150.2, 139.2, 130.5, 124.2, 123.5, 120.5, 115.1, 114.3, 112.1, 58.6, 53.6, 42.8, 38.9, 32.1, 28.0. Anal.Calcd for C23H27N3O2+H2O: C, 69.85; H, 7.39; N, 10.62. Found: C, 69.51; H, 6.83; N, 10.43. HRSM (ES): [M+ 65 Na]+ 400.1988 (calcd 400.1995) Lem-In
Lem-OH (200mg, 0.53mmol) was dissolved in 5mL of THF and
130 L of pyridine (1.65mmol). To the resulting reddish solution
70
were added dropwise 270 L of bromoisobutyryl bromide (500mg, 2.2 mmol), and the solution was stirred at room temperature for 1 hour. Then dichloromethane (10mL) was added, and the solution was extracted with 20 mL of 0,1M HCl. The organic layed was dried, and solvents were removed under
75
reduced pressure. The residue (single spot on TLC) was purified by column chromatography on silica gel (CH2Cl2), and a reddish
solid was obtained (190 mg, 56%)
1 H NMR(CDCl3): δ(ppm) 7.42 (d, J=7.5 Hz, 2H), 7.00 (d, J=16Hz, 1H), 6.78 (m, 4H), 4.32(t, J=6Hz, 4H), 3.75 (t, J=6Hz, 80 4H), 2.52 (s, 2H), 2.42 (s, 2H), 1.87 (s, 12H), 1.04 (s, 6H) . 13C NMR (CDCl3): δ(ppm)171.3, 169.2, 155.0, 148.5, 137.5, 129.6, 125.1, 124.7, 121.8, 114.0, 113.2, 112.3, 62.9, 55.4, 49.1, 42.9, 39.2, 31.9, 30.7, 28.0. Anal.Calcd for C31H37N3O4Br2: C, 55.12; H, 5.52; N, 6.22. Found: C, 55.36; H, 5.77; N, 5.71. HRSM (ES): 85 [M+ H]+ 674.1219 (calcd 674.1224) Lem-PHEA
Lem-In (45 mg, 0.066 mmol), CuBr (26 mg, 0.135 mmol), and 2,2’-bipyridine (42 mg, 2.68 mmol) were dissolved in a mixture
90
of THF (1mL) and HEA (1mL, 7.7 mmol). Argon was bubbled for 15 minutes, the tube was sealed, and the resulting reddish solution was stirred for 17 minutes at 85°C. Then, the solution was cooled rapidly by immersion in liquid nitrogen for 15 seconds, the tube was opened, its content was diluted in ca 10
95
mL of MilliQ water, put in a dialysis bag (MWCO = 1000 Da) and dialized against a large volume of MilliQ water (which was replaced at regular intervals) for 2 days. The resulting reddish solution was lyophilized yielding 120 mg of a fibrous solid.
1 H NMR(CD3OD): δ(ppm) 7.5-6.75 (m, 7H) , 4.13 (b, ≈40H), 100 3.73 (b, ≈40H), 2.38 (b, ≈20H), 1.75 (b, ≈40H) 1.10 (s, 6H), 1.04 (s, 12H) . 13C NMR (CD3OD): δ(ppm) 177.5, 175.3, 173.2, 169.2, 156.5, 149.5, 138.6, 129.7, 124.7, 124.5, 120.8, 113.9, 113.2, 111.3, 66.0, 62.0, 59.7, 53.5, 48.1, 42.6, 41.5, 38.7, 34.6, 31.6, 31.0, 27.6, 26.9. GPC Mn= 4737 Mw/Mn= 2.08 105
Conclusions
We reported the synthesis and the spectroscopic study of a Lemke chromophore derivative bearing two water-solubilizing polymeric arms. We showed that the latter was soluble in water and physiological serum (0.5% aq. NaCl) above millimolar
110
concentrations. The fluorescence is almost completely quenched, both for the polymeric object Lem-PHEA and its monomeric precursor Lem-In in low-polarity solvents, but strongly increases and is significantly red-shifted as solvents polarity is increased. The origin of this very unusual behaviour, ie a positive
115
This journal is © The Royal Society of Chemistry [year] Journal Name, [year], [vol], 00–00 | 9
could be partly elucidated on the basis of theoretical calculations. It was shown by PCM-TD-DFT calculation that these effects were neither related to harmonic vibronic couplings nor to electrostatic interactions between the solute and the solvent, but most probably to an excited-state twisting of the terminal dicyano
5
group. Although further studies are probably necessary to fully quantify the origin of the deviation from the energy gap law that we clearly evidenced in this work, this behaviour made it possible to obtain an efficient water soluble two-photon probe with absorption and polarity induced fluorescence in the NIR, with
10
good quantum yield ( f = 0.25@ 676 nm) and two-photon cross
section ( TPA = 440 GM @ 1040 nm). Using TPLSM with this
probe, we obtained three dimensional images of the functional cerebral vasculature in the motor cortex of mice, in a NIR-NIR (excitation-emission) configuration, with very high contrast and
15
resolution. Meanwhile, we also showed that the probe was cleared by the renal system with no accumulation in the hepatic cells. This constitutes a very promising feature in the context of in vivo imaging, especially in view of diagnostic applications. We underline that, although Lemke chromophore derivatives had
20
never been used previously, to the best of our knowledge, for biological imaging related applications a fortiori in vivo, the present contribution provides clear-cut evidences that this easily accessible class of molecules constitute valuable candidates for two-photon bio-imaging applications in the NIR.
25
Acknowledgments
We thank Patrice L. Baldeck and J. Bernard for their precious help with two-photon induced fluorescence measurements (two-photon cross section determinations).We thank the Région Rhône-Alpes (Cluster 5) for PhD grant (JM) and fundings. A.C.E.
30
thanks the European Research Council (ERC, Marches 278845) for his post-doctoral grant. D.J. acknowledges the European Research Council (ERC) and the Région des Pays de la Loire for financial support in the framework of a Starting Grant (Marches - 278845) and a recrutement sur poste stratégique, respectively.
35
This research used resources of 1) the GENCI-CINES/IDRIS (Grant c2012085117), 2) CCIPL (Centre de Calcul Intensif des Pays de Loire), 3) a local Troy cluster. The intravital microscopy studies were performed on the France Life Imaging Platform at Grenoble.
40
Notes and references
aLaboratoire de Chimie, UMR CNRS-5182,Université de Lyon, Université Claude Bernard, École Normale Supérieure de Lyon, 46 allée
d’Italie, 69364 Lyon, France Tel: (+33)472728860
E-mail: xxxx@aaa.bbb.ccc
45
b
CEISAM, UMR CNRS 6230, Université de Nantes, , 2 rue de la Houssinière, 44322 Nantes cedex 3, France. Fax: 33251125712; Tel:33251125564
bGrenoble Institute of Neuroscience(GIN), Inserm U 836 – Université
Joseph Fourrier - CEA – CHU, Chemin Fortuné Ferrini, 38042, La
50
Tronche Cedex
d Institut Universitaire de France, 103, bd Saint-Michel, F-75005 Paris
Cedex 05, France
† Electronic Supplementary Information (ESI) available: Polarity plot
55
and calculation of the ground and excited state dipole moments. Plot of the emission lifetime and of radiative and nonradiative kinetic constants for the excited state decay vs emission energy. 1H and 13C NMR for
Lem-OH, Lem-In and Lem-PHEA. Computed bond lengths for a model
molecule (Lem) at its ground and excited states . Dependence on the
60
ground and excited state energy on choosen angular deformations within the molecule. GPC characterization of Lem-PHEA. Overlay of the emission of Lem-PHEA in water and the detector’s ranges in Red and NIR configurations, and comparisons of the respective signal intensities in red and NIR configuration. Pictures evidencing renal clearance of teh
65
dye, and its absence of accumulation in hepatic cells See DOI: 10.1039/b000000x/
1. H. Kobayashi, M. Ogawa, R. Alford, P. L. Choyke and Y. Urano,
Chem. Rev., 2009, 110, 2620-2640.
70
2. F. Leblond, S. C. Davis, P. A. Valdés and B. W. Pogue, J.
Photochem. Photobiol. B, 2010, 98, 77-94.
3. J. Rao, A. Dragulescu-Andrasi and H. Yao, Curr. Opin. Biotechnol., 2007, 18, 17-25.
4. T. Terai and T. Nagano, Curr. Opin. Biotechnol., 2008, 12, 515-521.
75
5. C. Reichardt, Chem. Rev., 1994, 94, 2319-2358.
6. M. Albota, D. Beljonne, J.-L. Brédas, J. E. Ehrlich, J.-Y. Fu, A. A. Heikal, S. E. Hess, T. Kogej, M. D. Levin, S. R. Marder, D. McCord-Maughon, J. W. Perry, H. Röckel, M. Rumi, G. Subramaniam, W. W. Webb, X.-L. Wu and C. Xu, Science, 1998, 281, 1653-1656.
80
7. J. L. Bredas, C. Adant, P. Tackx, A. Persoons and B. M. Pierce,
Chem. Rev., 1994, 94, 243-278.
8. G. S. He, L.-S. Tan, Q. Zheng and P. N. Prasad, Chem. Rev., 2008,
108, 1245-1330.
9. D. R. Kanis, M. A. Ratner and T. J. Marks, Chem. Rev., 1994, 94,
85
195-242.
10. D. Cui, X. Qian, F. Liu and R. Zhang, Org. Lett., 2004, 6, 2757-2760. 11. M.-H. Zheng, J.-Y. Jin, W. Sun and C.-H. Yan, New J. Chem., 2006,
30, 1192-1196.
12. M. Y. Berezin, H. Lee, W. Akers and S. Achilefu, Biophys. J., 2007,
90
93, 2892-2899.
13. R. W. Sinkeldam and Y. Tor, Org. Biomol. Chem., 2007, 5, 2523-2528.
14. H. Cao and M. D. Heagy, J. Fluoresc., 2004, 14, 569-584. 15. Z. Xu, X. Qian and J. Cui, Org. Lett., 2005, 7, 3029-3032.
95
16. M. Yin, K. Ding, R. A. Gropeanu, J. Shen, R. d. Berger, T. Weil and K. Mullen, Biomacromolecules, 2008, 9, 3231-3238.
17. M. Yin, J. Shen, R. Gropeanu, G. O. Pflugfelder, T. Weil and K. Müllen, Small, 2008, 4, 894-898.
18. M. Yin, J. Shen, G. O. Pflugfelder and K. Mullen, J. Am. Chem Soc.,
100
2008, 130, 7806-7807.
19. C. Monnereau, S. Marotte, P.-H. Lanoe, O. Maury, P. Baldeck, D. Kreher, A. Favier, M.-T. Charreyre, J. Marvel, Y. Leverrier and C. Andraud, New J. Chem., 2012, 36, 2328-2333.
20. W. Denk, J. Strickler and W. Webb, Science, 1990, 248, 73-76.
105
21. F. Helmchen and W. Denk, Nat. Methods, 2005, 2, 932-940. 22. S. A. Hilderbrand and R. Weissleder, Curr. Opin. Biotechnol., 2010,
14, 71-79.
23. V. Chynwat and H. A. Frank, Chem. Phys., 1995, 194, 237-244. 24. R. Englman and J. Jortner, Mol. Phys., 1970, 18, 145-164.
110
25. J. V. Caspar, E. M. Kober, B. P. Sullivan and T. J. Meyer, J. Am.
Chem Soc., 1982, 104, 630-632.
26. A. L. Macanita, F. P. Costa, S. M. B. Costa, E. C. Melo and H. Santos, J. Phys. Chem., 1989, 93, 336-343.
27. M. H. Gehlen and F. C. De Schryver, Chem. Rev., 1993, 93, 199-221.
115
28. R. Lemke, Synthesis, 1974, 1974, 359-361.
29. J. Massin, W. Dayoub, J.-C. Mulatier, C. Aronica, Y. Bretonnière and C. Andraud, Chem. Mater., 2010, 23, 862-873.
30. D. R. Larson, W. R. Zipfel, R. M. Williams, S. W. Clark, M. P. Bruchez, F. W. Wise and W. W. Webb, Science, 2003, 300,
1434-120
1436.
31. M. J. Levene, D. A. Dombeck, K. A. Kasischke, R. P. Molloy and W. W. Webb, J. Neurophys., 2004, 91, 1908-1912.
32. S. Ermer, S. M. Lovejoy, D. S. Leung, H. Warren, C. R. Moylan and R. J. Twieg, Chem. Mater., 1997, 9, 1437-1442.
125
33. R. Andreu, S. Franco, E. Galán, J. Garín, N. Martínez de Baroja, C. Momblona, J. Orduna, R. Alicante and B. Villacampa, Tetrahedron
Lett., 2010, 51, 3662-3665.
34. L. Chen, G. Qian, Y. Cui, X. Jin, Z. Wang and M. Wang, J. Phys.
Chem. B, 2006, 110, 19176-19182.
130
35. I. Rau, P. Armatys, P. A. Chollet, F. Kajzar, Y. Bretonnière and C. Andraud, Chem. Phys. Lett., 2007, 442, 329-333.
10 | Journal Name, [year], [vol], 00–00 This journal is © The Royal Society of Chemistry [year]
36. Q. Zhang, Y. Tu, H. Tian and H. Ågren, J. Phys. Chem. B, 2007, 111, 10645-10650.
37. J. Li, D. Liu, Z. Hong, S. Tong, P. Wang, C. Ma, O. Lengyel, C.-S. Lee, H.-L. Kwong and S. Lee, Chem. Mater., 2003, 15, 1486-1490. 38. L. Yang, M. Guan, D. Nie, B. Lou, Z. Liu, Z. Bian, J. Bian and C.
5
Huang, Opt. Mater., 2007, 29, 1672-1679.
39. G. Weber and F. J. Farris, Biochemistry, 1979, 18, 3075-3078. 40. E. G. McRae, J. Phys. Chem. , 1957, 61, 562-572.
41. E. Lippert, Ber. Bunsen Ges. Phys. Chem. , 1957, 61, 962-975. 42. P. Suppan, J. Photochem. Photobiol. A, 1990, 50, 293-330.
10
43. N. Mataga, Y. Kaifu and M. Koizumi, Bull. Chem. Soc. Jpn, 1956,
29, 465-470.
44. Q. Peng, Y. Yi, Z. Shuai and J. Shao, J. Am. Chem Soc., 2007, 129, 9333-9339.
45. R. F. Goldstein and W. Bialek, Phys. Rev. B, 1983, 27, 7431-7439.
15
46. although CI intersection between two states cannot be fully optimized with a LR-TD-DFT scheme the characteristic evolution of the GS and ES potential curves near 90° twist angle constitutes good support to our hypothesis. Of couse, CAS or MR approaches that allow CI optimization are both out of reach for a dye presenting a such a large
20
conjugated backbone
47. M. Fox, E., F. Szoka and J. M. J. J. Fréchet, Acc. Chem. Res., 2009,
42, 1141-1151.
48. C. Xu and W. W. Webb, J. Opt. Soc. Am. B, 1996, 13, 481-491. 49. D. Jacquemin, A. Planchat, C. Adamo and B. Mennucci, J. Chem.
25
Theory Comput., 2012, 8, 2359-2372.
50. F. Santoro, R. Improta, A. Lami, J. Bloino and V. Barone, J. Chem.
Phys., 2007, 126, 084509-084513.
51. F. Santoro, A. Lami, R. Improta and V. Barone, J. Chem. Phys., 2007, 126, 184102-184111.
30
52. J. Tomasi, B. Mennucci and R. Cammi, Chem. Rev., 2005, 105, 2999-3094.
53. R. Improta, V. Barone, G. Scalmani and M. J. Frisch, J. Chem. Phys., 2006, 125, 054103-054109.
54. Frisch, M. J.; Trucks, G. W.; Schlegel, H. B.; Scuseria, G. E.;Robb,
35
M. A.; Cheeseman, J. R.; Scalmani, G.; Barone, V.; Mennucci, B.; Petersson, G. A.; Nakatsuji, H.; Caricato, M.; Li, X.; Hratchian, H. P.; Izmaylov, A. F.; Bloino, J.; Zheng, G.; Sonnenberg, J. L.; Hada, M.; Ehara, M.; Toyota, K.; Fukuda, R.; Hasegawa, J.; Ishida, M.; Nakajima, T.; Honda, Y.; Kitao, O.; Nakai, H.; Vreven, T.;
40
Montgomery, J. A., Jr.; Peralta, J. E.; Ogliaro, F.; Bearpark, M.; Heyd, J. J.; Brothers, E.; Kudin, K. N.; Staroverov, V. N.; Kobayashi, R.; Normand, J.; Raghavachari, K.; Rendell, A.; Burant, J. C.; Iyengar, S. S.; Tomasi, J.; Cossi, M.; Rega, N.; Millam, J. M.; Klene, M.; Knox, J. E.; Cross, J. B.; Bakken, V.; Adamo, C.; Jaramillo, J.;
45
Gomperts, R.; Stratmann, R. E.; Yazyev, O.; Austin, A. J.; Cammi, R.; Pomelli, C.; Ochterski, J. W.; Martin, R. L.; Morokuma, K.; Zakrzewski, V. G.; Voth, G. A.; Salvador, P.; Dannenberg, J. J.; Dapprich, S.; Daniels, A. D.; Farkas, O.; Foresman, J. B.; Ortiz, J. V.; Cioslowski, J.; Fox, D. J. Gaussian 09, Revision A.02; Gaussian Inc.:
50
Wallingford, CT, 2009.
55. T. Yanai, D. P. Tew and N. C. Handy, Chem. Phys. Lett., 2004, 393, 51-57.
56. D. Jacquemin, T. L. Bahers, C. Adamo and I. Ciofini, Phys. Chem.
Chem. Phys., 2012, 14, 5383-5388.
55