HAL Id: hal-01112776
https://hal.archives-ouvertes.fr/hal-01112776
Submitted on 3 Feb 2015
HAL is a multi-disciplinary open access
archive for the deposit and dissemination of
sci-entific research documents, whether they are
pub-lished or not. The documents may come from
teaching and research institutions in France or
abroad, or from public or private research centers.
L’archive ouverte pluridisciplinaire HAL, est
destinée au dépôt et à la diffusion de documents
scientifiques de niveau recherche, publiés ou non,
émanant des établissements d’enseignement et de
recherche français ou étrangers, des laboratoires
publics ou privés.
Distributed under a Creative Commons Attribution - NonCommercial - NoDerivatives| 4.0
International License
Mapping Cortical Shape Differences Using a Searchlight
Approach Based On Classification of Sulcal Pit Graphs
Sylvain Takerkart, Guillaume Auzias, Lucile Brun, Olivier Coulon
To cite this version:
Sylvain Takerkart, Guillaume Auzias, Lucile Brun, Olivier Coulon. Mapping Cortical Shape
Dif-ferences Using a Searchlight Approach Based On Classification of Sulcal Pit Graphs. International
Symposium on Biomedical Imaging: From Nano to Macro, Apr 2015, Brooklyn, United States.
�hal-01112776�
MAPPING CORTICAL SHAPE DIFFERENCES USING A SEARCHLIGHT APPROACH
BASED ON CLASSIFICATION OF SULCAL PIT GRAPHS.
Sylvain Takerkart
?†, Guillaume Auzias
?‡, Lucile Brun
?‡, Olivier Coulon
?‡?
Institut de Neurosciences de la Timone UMR 7289, Aix-Marseille Universit´e, CNRS, Marseille, France
†
Aix-Marseille Universit´e, CNRS, Laboratoire d’Informatique Fondamentale UMR 7279, Marseille, France
‡
Aix-Marseille Universit´e, CNRS, LSIS laboratory, UMR7296, Marseille, France
ABSTRACT
Studying cortical anatomy by examining the deepest part of cortical sulci, the sulcal pits, has recently raised a growing interest. In particular, constructing structural representations from patterns of pits has proved a promising approach. This study follows up in this direction and brings two main contri-butions. First, we introduce a graph kernel adapted to sulcal pit graphs, in order to perform classification of patterns of sul-cal pits using support vector machines directly in graph space. Second, we design a multivariate searchlight technique that enables the localization of informative patterns of sulcal pits. We demonstrate the relevance of our approach by studying cortical differences between male and female subjects using a large dataset of 134 subjects.
Index Terms— brain, mri, classification, mapping, search-light, cortex, anatomy, sulcus, sulcal pit, graph, kernel
1. INTRODUCTION
In the past few years, the topography of the cortical surface has raised a lot of interest, in particular to find biomarkers of pathologies [1, 2] or exhibit differences associated to func-tional specificities [3]. Behind the large apparent variabil-ity of cortical folding patterns, a specific attention has been brought to the deepest part of sulci, either to elaborate theo-retical models of cortical anatomy and development [4], or to automatically extract robust cortical landmarks. For the latter, the work of Im has been particularly important in defining the concept of sulcal pits. Sulcal pits are defined as local maxima of depth within each cortical fold [5]. They can be extracted, together with their associated sulcal basins, via a watershed algorithm performed on a sulcal depth map defined on the mesh of the cortical surface [5, 6]. Sulcal pits have ben linked with genetic factors [7] or developmental pathologies [1].
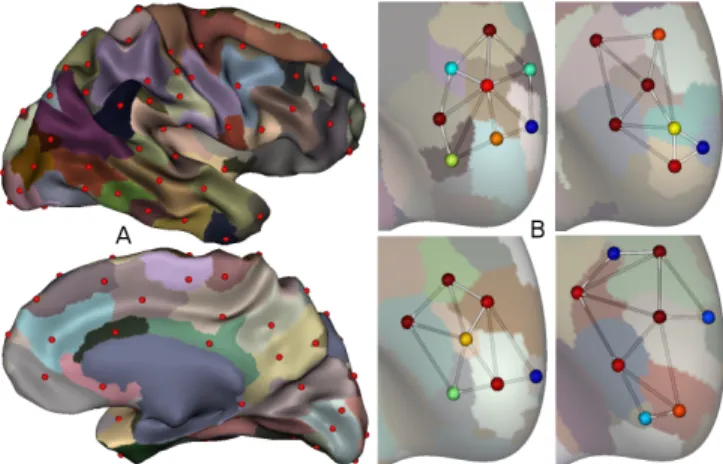
The challenge in using sulcal pits is to find stable pat-terns within a population, despite the apparent inter-subject variability. To do so, it is essential to have a good represen-tation of folding patterns. Sulcal pits define sulcal basins that parcellate the surface of the neo-cortex (Fig. 1), and the adja-cency of neighboring sulcal basins can be used to define sulcal
pit graphs. Such representations of local anatomical patterns have been successfully analysed at the brain lobe level using a spectral graph-matching technique [7, 1].
In this work we introduce a multivariate technique that en-ables to localize more precisely the differences between popu-lations from local patterns of sulcal pits. It relies on two main contributions: i) the design of graph kernel that allows the group classification to be performed directly in graph space; this kernel has very few parameters that can be efficientely inferred from the data; ii) the definition of a searchlight map-ping strategy [8] that enables to localize the discriminant pat-terns. In what follows, we describe our method and demon-strate its effectiveness by mapping differences between male and female subjects using a large dataset.
2. MATERIALS AND METHODS 2.1. Extracting sulcal pits
In order to localize the sulcal pits, we used a modified version of the procedure initially proposed in [5], designed to yield reproducible sulcal pits [6]. First, we estimated the sulcal depth map for each subject using the depth potential function, a measure that integrates both curvature and convexity infor-mation [9]. Then, we applied a watershed by flooding algo-rithm to extract depth maxima and their corresponding sulcal basins on the mesh (Fig. 1). A merging of sulcal basins was performed during the flooding in order to filter spurious ex-trema caused by noise in the depth map. Merging parameters were optimized as described in [6] (see also [5]).
For each subject, we obtain a set of pits P = {pi}i=Ni=1 and
their basins {Bi}i=Ni=1 (∀i, piis the deepest point of Bi). Note
that i) the basins form a complete parcellation of the cortical surface and ii) the number of pits N can vary across subjects.
2.2. Representing patterns of sulcal pits as graphs A natural way to formally represent a pattern formed by a set of pits, including their spatial organization, is to construct a graph. We here use the method proposed in [7].
Fig. 1. A. Illustration of the sulcal pits and their basins on one subject. B. Examples of sulcal pit graphs in the right frontal lobe for four subjects (the color of the nodes encodes the relative depth of the pit, from red (deep) to blue (shallow).
For a given subset ¯P ⊂ P of M pits (M ≤ N ), we define a node of the graph for each pit pi∈ ¯P. The graph edges are
then given by the spatial adjacency of their associated basins: this defines a binary adjacency matrix A = (aij) ∈ RM ×M
(aij = 1 if Bi and Bj are adjacent, and 0 otherwise), that
encodes the spatial organization of neighboring pits. In order to better characterize the pattern of pits, we add two attributes to each graph node: i) its depth di, because it is an
intrin-sic characteristic of the pit, and ii) the 3d coordinates Xi of
the corresponding vertex on the sphere after surface based-alignment to a common template performed in freesurfer, so that we can compare the locations of the graph nodes across subjects. Let D = {di} ∈ RM be the vector of depth values
and X = {Xi} ∈ RM ×3be the matrix of coordinates of all
graph nodes.
Any pattern of sulcal pits can therefore be fully repre-sented by an attributed graph defined as G = ( ¯P, A, D, X ). Examples of sulcal pit graphs are shown on Fig. 1.
2.3. Graph-based support vector classification
Our first contribution is to introduce a new graph ker-nel that measures the similarity between two graphs G = ( ¯PG, AG, DG, XG
) and H = ( ¯PH, AH, DH, XH
). Equipped with such a kernel, one can use the kernel trick to perform classification directly in graph space using a support vec-tor machine (see for instance [10]). Similarly to previous work dedicated to inter-subject multi-voxel pattern analysis of functional MRI [11], we designed a kernel that exploits all the features of the sulcal pit graphs defined in 2.2.
Kernel definition. Our kernel compares all pairs of nodes (i.e potential edges) gij and hkl, respectively in G and H,
without trying to perform a one-to-one pit-matching as in [7]. As such, it belongs to the class of walk-based graph kernels
[12] and uses the most elementary walks, of length one. It combines (see eq. 4) the different features of the graphs by us-ing several sub-kernels within the convolution kernel frame-work [13]. A first sub-kernel aims at ensuring that the com-parisons are performed only if gij and hkl are actual edges.
This is done with the linear kernel on the binary entries of the adjacency matrices:
ka(gij, hkl) = aGij.a H
kl, (1)
which takes the value 1 if aG
ij = aHkl = 1 and 0 otherwise. A
second sub-kernel uses a product of gaussian kernels on the coordinates of the nodes of gijand hkl:
kx(gij, hkl) = e−kX G i−X H kk 2/2σ2 x· e−kX G j−X H l k 2/2σ2 x. (2)
In practice, kx acts as a spatial filter that weights the
com-parisons of edges with their proximity, thus eliminating the comparisons of edges that are far away from eachother and allowing for inter-subject variability (if edges are close, but not perfectly matched across subjects). Finally, the last sub-kernel compares the depth attributes using the same principle:
kd(gij, hkl) = e−kd G i−d H kk 2/2σ2 d· e−kd G j−d H l k 2/2σ2 d (3)
The full kernel is defined as the combination of the three sub-kernels applied on all pairs of nodes of G and H:
K(G, H) = MG X i,j=1 MH X k,l=1 ka(gij, hkl)·kx(gij, hkl)·kd(gij, hkl) (4) Note that the number of nodes MGand MHin G and H can
be different.
Estimating hyper-parameters. The value of the two bandwidth parameters σx and σd need to be chosen. We
adapt a standard heuristic (used for vector inputs to a gaussian kernel) that selects the median euclidean distance between all observations in the training dataset. We here use for σxand
σd the median euclidean distance between the coordinates
and depth attributes of the nodes in all graphs available at training time. The values of these parameters are therefore estimated directly and easily from the training dataset, using this heuristic which was proved efficient [11].
2.4. Searchlight mapping
Our second contribution consists in setting up a searchlight method aimed at mapping the discriminative power of local patterns formed by sulcal pits across populations. The so-called searchlight method [8] consists in using a multivari-ate statistical model in a sliding window that defines a local neighborhood and moves along the space of interest. A sum-mary statistic computed from this model (for instance the ac-curacy of a classifier) is then assigned to the center of the
window, thus yielding a spatial map that allows the localiza-tion of the informative patterns. More specifically, in order to construct a searchlight scheme for a given task, one needs to define i) the space of interest, ii) the spatial sampling strategy of this space, iii) how to define local patterns at each location, iv) the statistical model that addresses the task itself (in our case: group discrimination) and v) the summary statistic to be mapped onto the space of interest. Below, we instantiate these five items to define our pit-based searchlight method.
Since sulcal pits are defined as local depth extrema on the cortex, it is natural to perform our searchlight strategy along the cortical surface (i). Because the size of the sulcal patterns of interest are far larger than the triangles comprising the cor-tical mesh, it is not necessary to sample the cortex using each vertex of the mesh. We therefore consider a coarser set of Q evenly distributed points over the spherical template pro-vided with freesurfer and map those onto the cortex of each subject (ii). At each of these points and for each subject, we apply the graph construction described in 2.2 using the set of pits ¯P located within a given radius R from the center of the neigborhood (iii). Then, we estimate a non linear support vec-tor classifier to discrimate the populations based on the local sulcal pit graphs, using our graph kernel 2.3 (iv). We com-pute the classifier accuracy using a cross-validation, and use the average accuracy ¯a across folds as the summary statistic to build our information map (v). In order to assess whether this accuracy is significantely above chance level, we use a non parametric permutation test that provides a p-value for the null hypothesis of no differences between populations.
3. EXPERIMENTAL RESULTS AND DISCUSSION 3.1. Mapping gender differences
The Open Access Series of Imaging Studies (OASIS, www. oasis-brains.org) cross-sectional database offers a collection of 416 subjects aged from 18 to 96. For each sub-ject, three to four individual T1-weighted MP-RAGE scans were obtained on a 1.5T Vision system (Siemens, Erlangen, Germany) with the following protocol: in-plane resolution = 256x256 (1 mm x 1 mm), slice thickness = 1.25 mm, TR = 9.7 ms, TE = 4 ms, flip angle = 10, TI = 20 ms, TD = 200 ms. Images were co-registered and averaged to create a single image with a high contrast-to-noise ratio. From this database, we selected two groups of 67 male and 67 female healthy right-handed subjects, aged 18 to 34, matched in age.
Using this data, our goal was to map gender differences from local patterns of sulcal pits. At each point of the search-light, a binary classification problem (males vs. females) was solved using the graph-based classifier defined previously. The average classification accuracy ¯a was estimated using a 10-fold cross-validation that ensured gender balance in both the training and test datasets for each fold. The number of searchlight locations Q on the cortex was set to 300, and the
radius of the neighborhood to R = 50mm. 3.2. Results and discussion
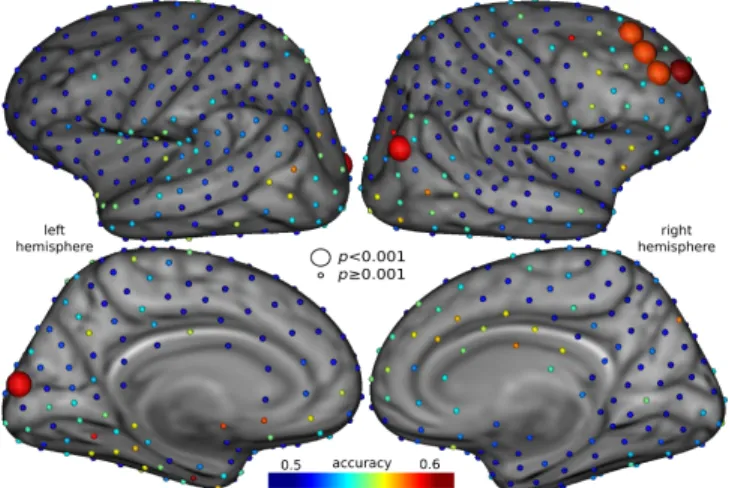
We found several regions for which the classification accu-racy ¯a was significantely above chance level (0.5), i.e for which the probability of the null hypothesis of no difference between males and females was p < 0.001. The correspond-ing accuracy scores were between ¯a = 0.61 and ¯a = 0.63. As visible on Fig. 2, the three main regions are : i) a compact set of 4 searchlight locations at the dorsal anterior extremity of the right frontal lobe, ii) a location at the junction between the right inferior temporal sulcus and the occipital-temporal junc-tion, and iii) a location in the left calcarine sulcus. Although previous studies using standard voxel- or surface-based mor-phometry [14, 15] do not report differences directly related to folding, they indicate that several other anatomical char-acteristics (grey matter volume, density, thickness or cortical area) correlate with our results by finding corresponding re-gions. In particular, local differences in grey matter volume are to some extent predictive of the differences shown by our results, because they embed information about both cortical surface area, which is linked to folding, and cortical thick-ness, which can induce local depth changes.
Fig. 2. Mapping of the informative patterns of sulcal pits for gender differences. Each sphere is one of the Q = 300 searchlight locations. Their color encodes the classification accuracy ¯a. The large spheres indicate the locations for which ¯
a is significantely above chance level (p < 0.001).
Therefore, our searchlight scheme is able to detect lo-cal anatomilo-cal differences between genders that are consis-tent with the standard morphometry literature. However, an-other study that examined group differences between sulcal pit graphs did not find any differences between genders (aux-iliary result in [1]). We list hereafter four potential reasons that could explain this disagreement: i) our dataset was much larger (134 vs. 26 subjects); ii) our pit detection algorithm
is slightly different [6]; iii) our kernel provides a graph simi-larity measure that might be sensitive to distinct properties of the graphs; iv) their study focused on brain lobes, whereas we consider smaller neighborhoods; it might be that the discrim-inant information lies at a finer scale than brain lobes. Further investigations will be needed to decipher which of these four factors contribute to the gain in sensitivity apparently offered by our framework.
This is the first time that a searchlight approach is pro-posed for studying local patterns of cortical shape. The main strength of this approach is to overcome the intrinsic limi-tations of ROI-based approaches since the regular sampling of the surface implies an overlap between patterns. Further-more, varying the size of the neighborhood (here the radius R) enables to study different spatial scales, which is neces-sary in clinical applications to deal with various pathologies. The second strength of our approach is the use of a similarity measure that is a positive definite kernel. This opens to us-ing any kernel method, meanus-ing we can tackle various tasks such as classification but also regression or clustering. Our approach is therefore powerful for localizing effects and ver-satile because opened to numerous applications.
4. CONCLUSION
We have introduced a multivariate searchlight mapping tech-nique that uses a graph-based support vector classifier to lo-calize informative patterns of sulcal pits. We have showed that our framework can detect anatomical gender differences that are consistent with the literature. This versatile and pow-erful pit-based searchlight approach should therefore find nu-merous applications related to clinical populations.
5. REFERENCES
[1] K. Im, R. Pienaar, M. J. Paldino, N. Gaab, A. M. Gal-aburda, and P. E. Grant, “Quantification and Discrimi-nation of Abnormal Sulcal Patterns in Polymicrogyria.,” Cerebral cortex, vol. 23, no. 12, pp. 3007–15, Sept. 2012.
[2] G. Auzias, M. Viellard, S. Takerkart, N. Villeneuve, F. Poinso, D. Da Fons´eca, N. Girard, and C. Deruelle, “Atypical sulcal anatomy in young children with autism spectrum disorder,” NeuroImage: Clinical, vol. 4, pp. 593–603, 2014.
[3] Z. Y. Sun, S. Kl¨oppel, D. Rivi`ere, M. Perrot, R. S. J. Frackowiak, H. Siebner, and J.-F. Mangin, “The effect of handedness on the shape of the central sulcus.,” Neu-roImage, vol. 60, no. 1, pp. 332–9, Mar. 2012.
[4] J. R´egis, J.-F. Mangin, T. Ochiai, V. Frouin, D. Rivi`ere, A. Cachia, M. Tamura, and Y. Samson, “Sulcal root
generic model: a hypothesis to overcome the variabil-ity of the human cortex folding patterns.,” Neurologia medico-chirurgica, vol. 45, no. 1, pp. 1–17, Jan. 2005. [5] K. Im, H. J. Jo, J.-F. Mangin, A. C. Evans, S. I. Kim, and
J.-M. Lee, “Spatial distribution of deep sulcal landmarks and hemispherical asymmetry on the cortical surface.,” Cerebral cortex, vol. 20, no. 3, pp. 602–11, Mar. 2010. [6] G. Auzias, L. Brun, C. Deruelle, and O. Coulon, “Deep
sulcal landmarks: algorithmic and conceptual improve-ments in the definition and extraction of sulcal pits.,” NeuroImage, 2015, in Press.
[7] K. Im, R. Pienaar, J.-M. Lee, J.-K. Seong, Y. Y. Choi, K. H. Lee, and P. E. Grant, “Quantitative comparison and analysis of sulcal patterns using sulcal graph match-ing: a twin study.,” NeuroImage, vol. 57, no. 3, pp. 1077–86, Aug. 2011.
[8] N. Kriegeskorte, R. Goebel, and P. Bandettini, “Information-based functional brain mapping.,” Proc. of the National Academy of Sciences of the USA, vol. 103, no. 10, pp. 3863–8, Mar. 2006.
[9] M. Boucher, S. Whitesides, and A. Evans, “Depth po-tential function for folding pattern representation, regis-tration and analysis.,” Medical image analysis, vol. 13, no. 2, pp. 203–14, Apr. 2009.
[10] B. Scholkopf and A. J. Smola, Learning with Kernels: Support Vector Machines, Regularization, Optimization, and Beyond, MIT Press, Cambridge, MA, USA, 2001. [11] S. Takerkart, G. Auzias, B. Thirion, and L. Ralaivola,
“Graph-based inter-subject pattern analysis of fMRI data.,” PloS ONE, vol. 9, no. 8, pp. e104586, Jan. 2014. [12] T. G¨artner, P. A. Flach, and S. Wrobel, “On graph ker-nels: Hardness results and efficient alternatives,” in Proc. of the 16th Conf. on Computational Learning The-ory, 2003.
[13] D. Haussler, “Convolution kernels on discrete struc-tures,” Tech. Rep. UCSC-CRL-99-10, UC Santa Cruz, 1999.
[14] A. N. V. Ruigrok, G. Salimi-Khorshidi, M.-C. Lai, S. Baron-Cohen, M. V. Lombardo, R. J. Tait, and J. Suckling, “A meta-analysis of sex differences in hu-man brain structure.,” Neuroscience and biobehavioral reviews, vol. 39, pp. 34–50, 2014.
[15] S. Escorial, F. J. Rom´an, K. Mart´ınez, M. Burgaleta, S. Karama, and R. Colom, “Sex differences in neocor-tical structure and cognitive performance: A Surface-Based Morphometry Study.,” NeuroImage, Sept. 2014.
![[PDF] Introduction à MySQL pas à pas document de formation détaillé - Cours informatique](data:image/gif;base64,R0lGODlhAQABAIAAAP///wAAACH5BAEAAAAALAAAAAABAAEAAAICRAEAOw==)