HAL Id: tel-01810324
https://tel.archives-ouvertes.fr/tel-01810324
Submitted on 7 Jun 2018
HAL is a multi-disciplinary open access
archive for the deposit and dissemination of
sci-entific research documents, whether they are
pub-lished or not. The documents may come from
teaching and research institutions in France or
abroad, or from public or private research centers.
L’archive ouverte pluridisciplinaire HAL, est
destinée au dépôt et à la diffusion de documents
scientifiques de niveau recherche, publiés ou non,
émanant des établissements d’enseignement et de
recherche français ou étrangers, des laboratoires
publics ou privés.
Advanced modulation formats and nonlinear mitigation
for spectral efficient optical transmission systems
Ivan Fernandez de Jauregui Ruiz
To cite this version:
Ivan Fernandez de Jauregui Ruiz. Advanced modulation formats and nonlinear mitigation for spectral
efficient optical transmission systems. Networking and Internet Architecture [cs.NI]. Institut National
des Télécommunications, 2018. English. �NNT : 2018TELE0009�. �tel-01810324�
Spécialité : Électronique et Communications
Ecole doctorale : Informatique, Télécommunications et Electronique de Paris
Présentée par
Ivan Fernandez de Jauregui Ruiz Pour obtenir le grade de DOCTEUR DE TELECOM SUDPARIS
Advanced modulation formats and nonlinear mitigation for spectral efficient optical
transmission systems
Soutenue le 12 Avril 2018 Devant le jury composé de : Directeur de thèse
Prof. Badr-Eddine Benkelfat (Telecom SudParis) Rapporteurs
Prof. Alberto Bononi Prof. Magnus Karlsson
(University of Parma) (Chalmers University) Examinateurs
Prof. Didier Erasme Dr. Nicolas Dubreuil Dr. Anne-Laure Billabert
(Télécom ParisTech)
(Institute d’Optique Graduate School) (Conservatoire National des Arts et Métiers) Encadrants
Dr. Amirhossein Ghazisaeidi Prof. Yann Frignac
(Nokia Bell-Labs France) (Telecom SudParis)
3 “I have heard articulate speech by sunlight! I have heard a ray of the sun laugh and cough and sing! I have been able to hear a shadow and I have even perceived by ear the passage of a cloud across the sun's disk. You are the grandfather of the Photophone and I want to share my delight at my success”.
5
A
CKNOWLEDGEMENTS
I would like to start by thanking all the members of the jury for the precious time they have taken to read and evaluate my report, as well as for their fruitful advices and comments.
It gives me immense pleasure to thank Amirhossein Ghazisaeidi for all his support and continuous guidance during the practical phase of this thesis. I thank him for his astute criticism and for encouraging me to always give my best to present high-quality and meaningful results. I thank him for his patience and for transmitting me part of his immense knowledge.
I would also like to express my sincere gratitude to Gabriel Charlet for encouraging me to perform this thesis after my Master’s internship. I thank him for all the practical discussions and for teaching me how to present results in an original and relevant way. I thank him for his guidance, for his trust, and for all his support.
I thank Jeremie Renaudier for all his suggestions and help during the final part of this thesis, and which who I would have liked to work more closely since the beginning of my work. I also thank Patrice Tran, Patrick Brindel, Dylan LeGac and Christian Simonneau for having introduced me to the various techniques and tricks in the lab, but specially for your infinite patience on all those hours setting-up, optimizing, and performing all the experiments. I thank also Christian Doriz for all the fruitful discussions and work during the Optoplan project.
I specially thank Alexis Carbo, Elie Awwad, Rafael Rios-Müller and Kaoutar Benyahya for all their support, for their friendship, and for their motivation. I thank all my colleagues in the department for their help, and for making my stay at Bell Labs a very pleasant one. It has been a honor and pleasure to be part of this great team.
This acknowledge would not be complete without thanking all my family, specially my parents and brothers for all their support, and for encouraging me to always move forward and to search for new limits. I thank them for having educated me with social sense where my work and wellness cannot come at the expense of others. I thank them and my political family for their constant love, encouragement, and moral support.
I also thank my friends Ruben Hernandez and Uriel Esparza for their lifetime friendship. Liliana Beltran, Jessica Martinez, Jose Luis Martinez, Daniel Villavicencio,… It would be impossible to tell all the new experiences and good moments that we have lived together. I thank all their support and for always being there for me.
Last but not least, I leave these last lines to the most important person in my life, my wife Viridiana. None of this would have been possible without you. You have always been there by my side, encouraging me, motivating me, pushing me. You have not given up in our future no matter how long and difficult the road has been. I thank you for always showing me that good things come with sacrifice, and better do those sacrifices next to the person you love.
7
C
ONTENTS
ACKNOWLEDGEMENTS ... 5 CONTENTS ... 7 ABSTRACT ... 9 RESUME ... 11LIST OF ACRONYMS AND SYMBOLS ... 15
LIST OF ACRONYMS ... 15
LIST OF SYMBOLS ... 18
1 COHERENT OPTICAL FIBER TELECOMMUNICATIONS SYSTEMS ... 21
1.1 TRANSOCEANIC SUBMARINE OPTICAL FIBER SYSTEMS STATUS AND TRENDS ... 21
1.2 DIGITAL TELECOMMUNICATION SYSTEMS ... 25
1.2.1 Achievable Information Rates ... 26
1.2.2 Forward Error Correction Codes ... 29
1.2.3 Modulation Formats ... 30
1.2.4 Pulse Shaping ... 35
1.3 COHERENT OPTICAL COMMUNICATIONS SYSTEMS ... 36
1.3.1 Optical Transmitter ... 37
1.3.2 Optical Link ... 38
1.3.3 Optical Coherent Receiver ... 50
1.3.4 Standard Digital Signal Processing Blocks ... 52
1.3.5 Nonlinear Digital Signal Processing ... 56
1.4 PERFORMANCE ANALYSIS ... 60
1.4.1 AWGN Channel ... 60
1.4.2 Back-to-back (B2B) Penalties ... 61
1.4.3 Nonlinear Variance... 62
1.4.4 Theory of Nonlinear Channel ... 63
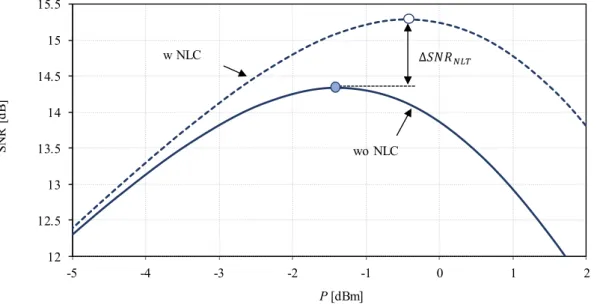
1.4.5 Theoretical Limits to Nonlinear Compensation ... 64
8
2 LOW-COMPLEXITY DIGITAL NONLINEAR COMPENSATION ... 67
2.1 FILTERED DIGITAL BACKPROPAGATION OPTIMIZATION ... 67
2.1.1 FDBP Parameter Optimization ... 68
2.1.2 Experimental Validation ... 74
2.2 IMPACT OF STOCHASTIC POLARIZATION EFFECTS ON NLC ALGORITHMS ... 77
2.2.1 Experimental Results ... 77
2.2.2 Simulation Results ... 85
2.3 PRACTICAL LIMITS OF NLC ALGORITHMS ... 87
2.3.1 Simulation Set-up ... 87
2.3.2 Numerical Results ... 89
2.4 SUMMARY ... 97
3 HIGH-CAPACITY MODULATION FORMATS ... 99
3.1 MODULATION FORMATS COMPARISON ... 100
3.1.1 Theoretical Performance ... 100
3.1.2 Experimental Performance ... 105
3.2 TRUNCATED PROBABILISTIC CONSTELLATION SHAPING ... 110
3.3 SUMMARY ... 114
4 TRANSOCEANIC TRANSMISSION RECORDS ... 115
4.1 25.4TB/S OVER TRANS-PACIFIC DISTANCES USING TPCS-64QAM ... 115
4.2 HIGH SYMBOL-RATE TRANSOCEANIC TRANSMISSION ... 121
4.2.1 Single-carrier Experiments ... 122 4.2.2 Dual-carrier Experiments ... 125 4.3 65TB/S LEVERAGED BY PCS-64QAM ... 128 4.3.1 Experimental Set-up... 128 4.3.2 Experimental Results ... 129 4.4 SUMMARY ... 130
5 CONCLUSIONS AND PERSPECTIVES ... 133
REFERENCES ... 137
PUBLICATIONS ... 145
AS FIRST AUTHOR ... 145
9
A
BSTRACT
Global data traffic is expected to reach up to 4.3 ZB per year by 2020. This growth will be driven by the rise of two main technological fields: the creation of a new cloud integrated network of seemingly infinite capacity, and the Internet of Things (IoT) that will lead to a massive digitization and connection of devices. By 2021, the number of IP connected devices is expected to be more than three times the global population.
This amount of data traffic will challenge the core IP/optical infrastructure over which these services will flow. With most of the global communications being eventually transported on submarine point-to-point fiber-optic systems, different cutting-edge technologies have been under research during the past years to cope with the exponential increase of the global network-traffic.
With fiber Kerr nonlinear effects limiting the performance of current fiber-optic transmission systems, intense research has been done in the development of techniques searching to mitigate their effects. Approaches based on advanced digital signal processing (DSP) algorithms have taken the lead over optical techniques, as they can be more easily implemented in already deployed systems. In this sense, two main algorithms have been proposed in the literature: digital backpropagation (DBP), which is the most efficient algorithm in terms of performance improvement although its high computational complexity; and perturbative nonlinear compensation (PNLC), which presents a reduced complexity at the expense of lower achievable gains. Although, nonlinear compensation (NLC) is still not present in commercial systems due to its high complexity, it has been used in most of the recent “hero experiments” for distances above 6,000 km. However, with the continuous increase of processing capabilities of integrated circuits, DSP-based NLC techniques will be most likely implemented in future generation systems.
Besides nonlinear compensation techniques, the use of multi-level modulation formats beyond 16QAM and high symbol-rates have gained momentum in the last years. One of the
10 breakthroughs has been the introduction of QAM-based probabilistic constellation shaping (PCS-QAM), which has proven to outperform regular QAM formats. Not only the achievable rates approach the linear Shannon capacity as the constellation adopts a Gaussian like distribution, but rate adaptation is also possible while keeping the low complexity non-iterative decoding bit interleaved coded modulation scheme.
This thesis focuses on the evaluation of performance and achievable benefits of advanced modulation formats as PCS-QAM and digital nonlinear equalization techniques to increase the performance and throughput of long-haul optical fiber systems.
In the first part, the performance and achievable gains of low complexity nonlinear compensation techniques based on filtered DBP (FDBP), and PNLC are evaluated for long-haul submarine optical fiber systems. First, semi-analytical formulae are obtained for the optimization of the parameters involved in the FDBP algorithm, making complex and time-consuming exhaustive optimization unnecessary. Second, the impact of polarization mode dispersion (PMD) and polarization dependent loss (PDL) on the performance of FDBP and PNCL is experimentally addressed. Finally, a numerical study showing the practical limits of single channel nonlinear compensation versus algorithm complexity is carried out for transoceanic fiber-optic transmission systems
In the second part, the design and achievable rate increase brought by PCS-QAM over regular formats is addressed. First, the performance comparison of four advanced modulation formats for transoceanic coherent systems, i.e., 32QAM, 64QAM, 64APSK, and PCS-64QAM, is performed experimentally and numerically considering the theoretical gap to the linear Shannon capacity, nonlinear performance, back-to-back implementation penalties, and DSP challenges. Then, the design and optimization of a truncated-PCS (TPCS) to maximize the throughput of trans-Pacific optical fiber links is presented.
In the third part, PCS-QAM and NLC techniques are combined to demonstrate several transoceanic transmission records. First, the highest spectral efficiency for distances above 10,000 km using C-band EDFA only amplification is demonstrated. Then, cutting-edge CMOS digital-to-analog convertor’s technology and wideband receivers together with PCS-QAM and NLC are used to achieve the highest per channel bit-rate up to date for Atlantic and trans-Pacific distances. Finally, a record 65 Tb/s using C+L bands EDFA only amplification over 6,600 km employing PCS-64QAM, multi-rate FECs, and NLC is shown.
11
R
ESUME
Il est estimé que d'ici 2021 le trafic mondial de données atteindra 4.3 ZB par an, et que le nombre d'appareils IP connectés sera plus de trois fois supérieur à la population mondiale. Cette quantité de trafic de données mettra au défi l'infrastructure des réseaux IP/optiques qui représente l’épine dorsale des systèmes de télécommunications. En effet, la majeure partie des communications mondiales est transportée par des systèmes transocéaniques à fibre optique. Afin de faire face à cette demande croissante du trafic de données, différentes technologies sont actuellement étudiées pour augmenter la capacité de ces systèmes de transmission très longue distance.
La capacité des systèmes de transmission optiques modernes est fortement limitée par les effets non-linéaires de type Kerr dans la fibre. Dans ce contexte, différentes techniques de traitement de signal numérique (DSP) à complexité relativement élevée ont été proposées pour mitiger ces effets, notamment la rétropropagation numérique filtrée (FDBP), et la compensation non linéaire perturbative (PNLC). Avec le développement rapide des circuits intégrés à haute vitesse, les techniques de compensation non linéaire (NLC) basées sur DSP seront très probablement mises en œuvre dans les systèmes de future génération.
En outre, l’utilisation des formats de modulation multi-niveaux à haute efficacité spectrale au-delà de 16QAM a pris de l'ampleur pour augmenter la capacité de transmission de ces systèmes optiques. En particulier l’introduction du format QAM avec mise en forme probabiliste (PCS-QAM), démontré plus performant que les formats QAM classiques, a permis non seulement de s’approcher de la limite fondamentale de Shannon en régime linéaire, car la constellation adopte une distribution de type Gaussien, mais aussi d'adapter le débit du canal tout en conservant un schéma de codage à faible complexité basé sur la modulation codée avec entrelacement de bits (BICM).
12 Dans ce contexte, ce travail de thèse est axé sur l’étude de la performance et des gains réalisables par des techniques DSP à faible complexité pour mitiger les effets non-linéaires de type monocanal, ainsi que l’évaluation de la performances et mise en œuvre des formats PCS-QAM pour augmenter l’efficacité spectrale (SE) des systèmes pour les distances transocéaniques.
Dans le premier chapitre, les principaux aspects d'un système de communication numérique et des systèmes cohérents optiques longue distance basés sur le multiplexage en longueur d'onde (WDM) sont traités. D’abord, nous décrivons les principaux éléments de base de la transmission numérique, tels que : les taux réalisables dans les systèmes BICM, les codes de correction d'erreurs (FEC), les formats de modulation de cardinalité élevée incluant PCS-QAM, et la mise en forme des impulsions. Ensuite, nous décrivons les différents blocs d'un système cohérent optique long-distance, incluant : l’émetteur optique, les principaux phénomènes physiques affectant un signal optique pendant la propagation, l'architecture du récepteur cohérent, suivi par les principaux blocs DSP utilisés pour la récupération de données transmises. Enfin, nous abordons l’évaluation de la performance du système en termes du rapport signal à bruit (SNR), y compris toutes les sources de bruit comme : le bruit des amplificateurs optiques, le bruit lié au transmetteur et au récepteur, et le bruit non-linéaire lié à l’effet Kerr. Ce dernier est calculé à partir des modèles analytiques basés sur la théorie de perturbation de premier ordre.
Le deuxième chapitre est basé sur l'évaluation de la performance des algorithmes FDBP et PNLC utilisés pour mitiger les effets non-linéaires de type monocanal. Dans la première partie, nous étudions la dépendance des paramètres impliqués dans l'algorithme FDBP avec les différents paramètres du système, tels que : nombre de canaux WDM, puissance optique transmise, débit de modulation symbole et coefficients physiques de la fibre. Nous montrons numériquement et expérimentalement que les paramètres FDBP dépendent principalement de l'élargissement temporel des impulsions par étape FDBP, ce qui nous permet d’obtenir des formules semi-analytiques simples pour leur calcul, et d'éviter une optimisation exhaustive complexe. Dans la deuxième partie, nous étudions expérimentalement l'impact des effets de dispersion modale de polarisation (PMD) et de pertes dépendant de la polarisation (PDL) sur la performance des algorithmes FDBP et PNLC. Nous montrons que des valeurs de PMD aussi grandes que 5 fois la durée du symbole conduisent à une dégradation maximale observable de seulement ~0.1 dB dans le gain réalisable par la FDBP et la PNLC; tandis que la dégradation du gain correspondant à des valeurs PDL jusqu’à 9dB est de seulement ~0.2dB. Ces observations expérimentales montrent la robustesse de ces algorithmes contre les effets PDL et PMD. Enfin, dans la troisième partie, nous évaluons numériquement les gains pratiques réalisables par la FDBP et la PNLC en relation avec la complexité liée à son implémentation. Nous montrons que dans le cas idéal sans bruit linéaire d’amplification, la FDBP travaillant à une étape par tronçon de fibre peut atteindre 90% du gain maximum théorique, tandis que pour la PNLC il est réduit à ~75%. En considérant le bruit linéaire d’amplification, ces gains réalisables sont encore diminués, avec une dégradation plus élevée pour les distances de
13 transmission plus longues. Le bruit linéaire dégrade la performance de la FDBP et de la PNLC en même proportion indépendamment de la complexité de l'algorithme. Pour les régimes OSNR des systèmes transatlantiques, la PNLC peut atteindre des gains compris entre 0.5dB et 0.7dB pour les systèmes utilisant des canaux modulés à 32GBd, tandis que pour les systèmes avec des canaux modulés à 64GBd, les gains augmentent de 0.7 dB jusqu'à 1.1 dB. Le troisième chapitre est basé sur la conception et l'évaluation de la performance du format PCS-QAM par rapport aux formats de modulation réguliers en amplitude et en quadrature (QAM). Dans la première partie, nous comparons théoriquement et expérimentalement le débit de données atteignable par PCS-64QAM, 64APSK, 64QAM et 32QAM, en considérant des pénalités linéaires et non linéaires après 6600 km. Nous montrons que les formats PCS-64QAM et 64APSK présentent de nouveaux défis pour l’implémentation des algorithmes DSP, en nécessitant l’utilisation de symboles pilotes. En ce qui concerne le 64APSK, nous montrons expérimentalement que sa performance se dégrade rapidement à de faibles valeurs de SNR, ayant besoin d’un taux de pilotes plus élevé dans la chaine DSP. En tenant en compte les dégradations linéaires, non linéaires et les défis d’implémentation du DSP, le PCS-64QAM atteint des SE plus élevées par rapport à 32QAM, 64QAM et 64APSK pour les distances transocéaniques. Dans la deuxième partie, nous montrons la conception d'une version de PCS-64QAM nommée PCS-PCS-64QAM tronqué (TPCS-6AQAM) optimisée pour maximiser la SE des liens optiques transpacifiques. Le TPCS-64QAM proposé maximise la capacité sur la région de SNR entre 7 et 11.5 dB, tout en prenant en compte les pénalités liées au FEC.
Dans le quatrième chapitre, nous combinons la NLC avec les formats PCS-64QAM et TPCS-64QAM pour démontrer différents records de transmission transocéaniques. Dans la première partie, nous utilisons le TPCS-64QAM, la FDBP et des codes FEC basés sur la technologie SC-LDPC pour atteindre un record de 25.4 Tb/s avec une SE de 6.06 b/s/Hz après 10285 km. Nous montrons que le TPCS-64QAM apporte un gain de 0.25 b/symb/pol par rapport au 64QAM. De plus, nous montrons que l'augmentation de débit due à la FDBP est limitée à ~ 4% à cause de la puissance de sortie limitée de nos amplificateurs optiques. Dans la deuxième partie, nous présentons des nouveaux records de débit de données par canal pour les distances transocéaniques. Grâce à l’utilisation d’un DAC à haute vitesse, à un récepteur large bande, au PCS-64QAM et à la NLC, nous démontrons 550Gb/s par canal sur 6600km et 430 Gb/s sur 13200km. De plus, nous démontrons également 850 Gb/s à double porteuse sur 6600 km et 1Tb/s sur 3960 km. Enfin, dans la troisième partie, nous utilisons PCS-64QAM, ainsi que des codes SC-LDPC et la NLC pour atteindre un débit net de 65Tb/s sur 6600 km, avec une SE de 7.3 b/s/Hz. Toutes les démonstrations ci-dessus correspondaient à des records de transmission au moment de leurs réalisations.
15
L
IST OF ACRONYMS AND SYMBOLS
L
IST OF ACRONYMSADC analog to digital converter
AO acousto-optic
APSK amplitude phase shift-keying ASE amplified spontaneous emission ASIC application specific integrated circuit AWGN additive white Gaussian noise
B2B back-to-back
BER bit error rate
BICM bit interleaving coded modulation BMD bit metric decoding
BPS blind phase search BPSK binary phase shift keying CD chromatic dispersion CMA constant modulus algorithm
CMOS complementary metal oxide semiconductor COI channel of interest
CPE carrier phase estimation CSF coherent submarine fiber DAC digital to analog converter DBP digital backpropagation
DC dual carrier
DCU dispersion compensation unit DEMUX demultiplexer
DFB distributed feedback laser DGD differential group delay
DM dispersion managed
DSP digitial signal processing
DU dispersion unmanaged
ECL external cavity laser
EDFA erbium doped fiber amplifier EML electro absorption modulator ENOB effective number of bits FDBP filtered digital backpropagation FEC forward error correction FFT fast Fourier transform FIR finite impulse response FWM four wave mixing
GMI generalized mutual information
GN Gaussian noise
GVD group velocity dispersion
HD hard decision
ISI inter-symbol interference LMS least mean square
16 LO local oscillator
LPF low-pass filter
LUT look-up table
MCI multi-channel interference
ML maximum likelihood
MMA multi-modulus algorithm MSE minimum square error MUX multiplexer
MZM Mach-Zendher modulator
NF noise figure
NLC nonlinear compensation NLI nonlinear interference NLT nonlinear threshold NOB number of bits
NSNI nonlinear signal-noise interaction’ OPC optical phase conjugation
OSA optical spectrum analyzer OSNR optical signal to noise ratio PBC polarization beam coupler PBS polarization beam splitter
PCS probabilistic constellation shaping PCTW phase-conjugated twin waves PDL polarization dependent loss PM polarization multiplexing PMD polarization mode dispersion PMF polarization maintaining fiber
PNLC perturbative nonlinear compensation PPN phase and polarization noise
PSA phase-conjugated amplification PSD power spectral density
QAM quadrature amplitude modulation QPSK quaternary phase shift keying
RC raised cosine
ROADM reconfigurable optical add-drop multiplexer RP1 first order regular perturbation
RRC root raised cosine
RX receiver
SC single carrier
SCI self channel interference
SC-LDPC spatially coupled low density parity check
SD soft decision
SE spectral efficiency SER symbol error ratio
SG super-Gaussian
SNR signal to noise ratio
SOA semiconductor optical amplifier SOP state of polarization
SPM self-phase modulation SSFM split-step Fourier method SSMF standard single mode fiber TLS tunable laser source
17
TX transmitter
WDM wavelength division multiplexing WSS wavelength selective switch XCI cross-channel interference XPM cross-phase modulation
18
L
IST OF SYMBOLS𝐴𝐿𝑂 local oscillator amplitude
𝐴𝑒𝑓𝑓 fiber effective area
𝐴 input constellation alphabet
𝑎 complex points in constellation alphabet 𝐴 𝛼 fiber attenuation coefficient
𝑎𝑁𝐿𝐼 normalized nonlinear variance
𝐵𝐹𝐷𝐵𝑃 FDBP low-pass filter bandwidth
𝐵𝑟𝑒𝑓 optical spectrum analyzer reference bandwidth
𝛽2 group velocity dispersion
𝛽3 group velocity dispersion slope
𝛽 propagation constant
𝐶 Shannon capacity
𝑐 speed of light
𝐶𝑚𝑛 perturbative nonlinear coefficients
𝐷̂𝑧 dispersion operator
𝐷 fiber dispersion coefficient
𝛿𝑇𝑠 time offset
𝜀 pulse energy
𝐹 amplifier noise factor
𝑓 frequency
𝐺 amplifier gain
𝛾 fiber nonlinear coefficient
𝛤 PDL coefficient
𝐻 horizontal polarization ℎ𝑒𝑓𝑓 SSFM effective step size
ħ Plank’s constant divided by 2π
ℎ SSFM step size
𝜂 DSP B2B penalty factor
𝐼 in-phase component
𝕀 mutual information
𝐾𝑝 pilot symbol block length
𝜅 FDBP/PNLC/DBP scaling factor 𝜅𝑇𝑅𝑋 TX-RX impairments
𝐿𝑑 dispersion length
𝐿𝑒𝑓𝑓 effective span length
𝐿 link length
𝐿𝑠𝑝𝑎𝑛 span length
𝜆0 channel of interest central wavelength
𝜆 wavelength
𝑀 modulation order
𝜇𝑛 n’th constellation moment
𝑚 bits per symbol
𝑁0 noise power spectral-density
𝑁𝐴𝑆𝐸 power spectral density of ASE noise
𝑁𝑃 number of pilot symbols within a block
19 𝑁𝑠𝑡𝑝𝑠 DBP/FDBP steps per span
𝑁𝑡 adaptive equalizer number of taps
𝑛 fiber refractive index
𝑛2 fiber nonlinear Kerr coefficient
𝑛𝑠𝑝 amplifier spontaneous emission factor
𝜈 Maxwell-Boltzman distribution free parameter
𝜈𝑝 phase velocity
𝑃𝐴𝑆𝐸 ASE noise power
𝑃𝑐ℎ WDM channel power 𝑃 average power 𝜌 RRC roll-off factor 𝑄 quadrature component 𝑅𝑠 symbol-rate 𝑟̂ constellation amplitudes 𝑟𝑐 code rate ℛ detector responsivity 𝑅 information rate
𝜎𝐴𝑆𝐸2 ASE noise variance
𝜎𝑁𝐿𝐼2 nonlinear variance
𝑇𝑠 symbol duration
𝜏𝐷𝐺𝐷 differential group delay
𝑡 time 𝜑𝑠 phase offset 𝑉 vertical polarization 𝑊 WDM channel bandwidth 𝜔 angular frequency 𝑥 transmitted symbols 𝑥̂ estimated symbols 𝑦 received symbols 𝑧 distance 𝛺𝑠 frequency offset
21
1 C
OHERENT
O
PTICAL
F
IBER
T
ELECOMMUNICATIONS
S
YSTEMS
In this chapter, we first discuss the current status and trends of transoceanic submarine optical fiber systems. Then, we present the fundamental notions of digital communications and information theory over the linear Gaussian channel. Finally, we present the operation principles of coherent optical fiber systems, where linear and nonlinear impairments of signal transmission and the different techniques for their mitigation are also discussed.
1.1 T
RANSOCEANICS
UBMARINEO
PTICALF
IBERS
YSTEMSS
TATUS ANDT
RENDS The first deployment of a trans-Atlantic cable was done in 1858 relying North America and Europe. It consisted of several cooper wires and was used for telegraph communications. Even though the cable only served for three weeks, it represents an heroic event in the history of the human technical revolution. Almost a century later, in 1956, the first transatlantic telephone cable system (TAT-1) was inaugurated, initially carrying 36 telephone channels. The evolution of submarine cables was slow in the following 38 years, and by 1994, the maximum number of voice channels was increased to 10,500 [1-3].On the other hand, the first erbium doped fiber amplifier (EDFA) for optical fiber systems was shown in 1987, where optical gains up to 26 dB at a wavelength of 1530 nm were demonstrated [4, 5]. This experiment led to a worldwide effort on developing high gain EDFAs. In 1989, an experimental demonstration using EDFAs to amplify multiple wavelength signals
22 without cross-talk paved the way to amplified wavelength division multiplexing (WDM) systems [6]. The advent of WDM with optical amplification started a revolution for the development of high-capacity optical fiber systems. In 1996, the first trans-Atlantic optical cable making use of EDFA amplification and WDM technology (TAT-12/13) was deployed, initially carrying 2 WDM channels modulated at 5 Gb/s [4] using intensity modulation with direct detection (IM-DD).
The advances in high speed analog-to-digital converters (ADC), digital-to-analog converters (DAC), and high-speed application-specific integrated circuits (ASIC) in the early 2000s, together with the increased demand on data traffic renewed the interest for coherent technologies which were extensively studied during the 1980s. Since then, coherent detection has been the milestone technology for long haul optical fiber transmission systems. Its adoption has not only allowed the use of more complex higher order modulation formats, but has also enabled the use of advance digital signal processing (DSP) techniques enabling electronic equalization of deterministic system impairments. Coherent detection has become the de-facto standard for current commercial long-haul optical fiber systems. Modern commercial transoceanic cables can carry up to 20 Tb/s, equivalent to 312 millionvoice channels.
The transmission rates allowed by submarine optical cables are several tens of thousands of times more than can be achieved by satellites. In consequence, transoceanic optical fiber systems have become the backbone of international communications. It is commonly said that 99% of the total voice and data traffic is at present carried worldwide by submarine cables [3]. Fig. 1.1 shows the map of optical submarine cables laid worldwide by 2017, stretching over 1.1 million km [7].
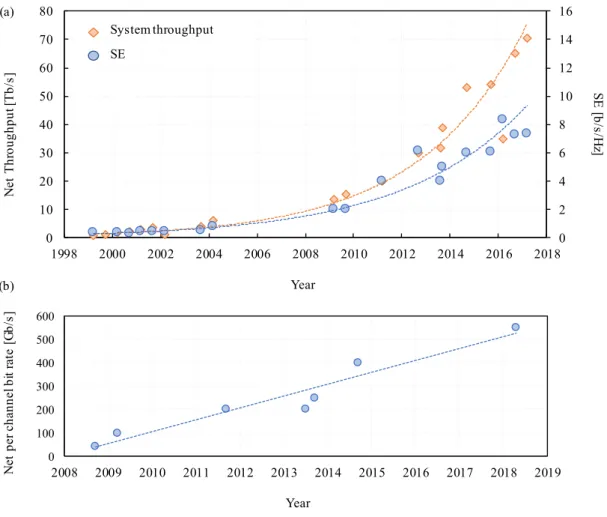
23 The evolution of system throughput, spectral efficiency (SE), and channel bit-rate in research lab demonstrations for trans-Atlantic distances (> 6,000 km) since 1999 is shown in Fig. 1.2 [8-24]. Before the arrival of coherent detection, the maximum achievable system throughput was 6 Tb/s using WDM channels modulated at 10 Gb/s reaching SEs of 0.8 b/s/Hz. After 2008, a non-stopping increase have been made possible thanks to the synergy of different cutting-edge technological advances.
Great advances in CMOS technology have led to high speed DACs and ADCs. Their sampling rates have increased from 22 GSamples/s in 2006 [25] to 100 GSamples/s in 2016 [26]. These great improvements have allowed the use of Nyquist pulse shaping techniques to further increase the SE. Together with coherent detection, they have also allowed the possibility to use powerful DSP algorithms to compensate for system impairments. Compensation of chromatic dispersion (CD), polarization mode dispersion (PMD), as well as transmitter/receiver imperfections such as time skew and imbalances of quadrature components and polarization tributaries are common practices in current coherent optical systems.
Fig. 1.2: (a) Net system throughput and spectral efficiency (SE) evolution in main research experiments over the years, (b) increase in channel bit rate since the arrival of coherent detection.
0 2 4 6 8 10 12 14 16 0 10 20 30 40 50 60 70 80 1998 2000 2002 2004 2006 2008 2010 2012 2014 2016 2018 System throughput SE N et T hr ou gh pu t [ Tb /s ] Year N et p er c ha nn el b it ra te [G b/ s] Year (a) (b) SE [b /s/ H z] 0 100 200 300 400 500 600 2008 2009 2010 2011 2012 2013 2014 2015 2016 2017 2018 2019
24 Moreover, a great increase in the system SE has been possible by the use of multi-level modulation formats and high symbol-rate channels. Systems working at 40 Gb/s with binary phase shift keying (BPSK) were rapidly updated to 100 Gb/s by the use of quadrature phase shift keying (QPSK) [14, 15], and to 200 Gb/s – 400 Gb/s using 16-quadrature amplitude modulation (16QAM) [23, 27, 28]. The net system throughput passed from 15 Tb/s in 2009, to 54,2 Tb/s by 2016, [15, 29]. Higher order modulation formats beyond 16QAM have gained momentum in the last couple of years. Experimental demonstrations using 32QAM and 64QAM have been presented [20, 21, 30, 31]. However, one of the recent breakthroughs has been the introduction of constellation shaping techniques, which have proven to outperform regular QAM formats. Geometric constellation shaping based on 64-amplitude phase shift keying (64PSK) was used in [20] to achieve a record C-band SE of 8.3 b/s/Hz (net 34.9 Tb/s) after 6,375 km, while 4D-PS-9/12-56APSK was used in [22] to achieve 7.2 b/s/Hz (net 70.4Tb/s) over 7,600 km, using C+L bands EDFA-only amplification. Similarly, probabilistic constellation shaping (PCS) based on 64QAM constellation (PCS-64QAM) was used in [30] to demonstrate a SE of 7.3 b/s/Hz (net 65 Tb/s) over 6,600 km with C+L-band EFDA-only amplification. Beyond laboratory experiments, PCS-64QAM has also been successfully demonstrated in field-trials, achieving a SE of 7.46 b/s/Hz over a 5,523 km in service EDFA-only trans-Atlantic Facebook cable [32].
Hard-decision forward error correction codes (HD-FEC) have been replaced with the more powerful soft-decision FECs (SD-FEC). Specially, high performance FEC codes based on spatially-coupled low-density parity-check (SC-LDPC) have been introduced [33-35]. Adaptive multi-rate FEC was used in [18, 19, 29, 30], to achieve up to 20% capacity increase over trans-Atlantic and trans-Pacific distances with respect a single FEC code rate.
With fiber Kerr nonlinear effects limiting the performance of current fiber-optic transmission systems, different digital nonlinear compensation (NLC) techniques have been proposed. The most efficient algorithm in terms of performance improvement is digital backpropagation (DBP) [36, 37]; however, its hardware implementation is challenging due to its high computational complexity. Different approaches to reduce the complexity of NLC have been proposed, as the low-pass filter DBP (FDBP) [38, 39], or perturbative nonlinear compensation (PNLC) [40]. DSP-based NLC has been used in all recent transmission experiments for distances above 6,000 km [18-20, 22, 29, 30, 41].
Finally, novel optical components as optical fibers with ultra-low loss (<0.16 dB/km), large effective area (≥150μm2), and high chromatic dispersion (>20ps/nm/km), together with wide-band amplification based on C+L wide-bands (~70nm) have been commonly adopted in laboratory experiments; increasing the SE by reducing the span loss, increasing tolerance to fiber nonlinearities, and practically doubling the useful bandwidth per optical cable [18-22, 29-31]. While high performance optical fibers are starting to be commercially deployed, C+L band amplification is likely to be adopted by the industry in the foreseeable future.
25 Compared to optical components, novel DSP techniques present an advantage for increasing the throughput of optical cables. With the wet plant lying on the seabed with twenty-five years’ life span and almost no possible upgrade capability [3,141], new optical components can only be adopted for optical cables to be laid in the future, and are not viable for already deployed systems. On the contrary, novel DSP techniques can be relatively easily implemented in the submarine line terminal equipment, leading to a simpler and smoother upgrade of already deployed systems.
In this work, we focus on the evaluation of novel DSP techniques to increase the throughput and spectral efficiency of transoceanic optical fiber systems. In particular DSP techniques for the mitigation of fiber nonlinear distortions will be investigated, as well as on the use of capacity approaching modulation formats for next generation optical fiber systems.
1.2 D
IGITALT
ELECOMMUNICATIONS
YSTEMSThe main objective of a digital transmission system is to transmit information from a given source to a given destination without errors despite the presence of noise and other signal perturbations. Fig. 1.3 shows a schematic representation of the main building blocks of a digital telecommunication system. The process of transmitting information can be described as follows.
Fig. 1.3: Basic elements of a digital communication system.
The digital source generates information bits (0s and 1s) representing the message to be transmitted. A process known as source encoding compress the data in order to remove redundancy, such that the information can be efficiently represented by the smallest number of bits possible. At the output of the source encoder, the binary data can be represented by a sequence of i.i.d bits. The resulting binary sequence is then passed to the channel encoder,
Digital
Source encoderSource
Destination decoderSource
Channel encoder Channel decoder Pulse Shaper Physical Channel Mapper Communication channel FEC encoder Channel decoder Demapper FEC decoder Modulator
Pre-equalization modulatorI/Q
Post-equalization Front-endCoherent Demodulator
26 which in introduces, in a controlled manner, some redundancy to increase robustness to noise. This error control scheme process is also known as forward error correction (FEC).
The resulting coded bits are then mapped to symbols drawn from a given constellation alphabet, also referred as a modulation format. The module which maps coded bits to symbols is called the mapper. For an equiprobable alphabet of size 𝑀, the number of coded bits per symbol is 𝑚 = 𝑙𝑜𝑔2(𝑀). For example, lets 𝐴 be the constellation alphabet with complex
constellation points, such that 𝐴 = {𝑎1, 𝑎2, … , 𝑎𝑀}. The mapper will map m-bit blocks at the
output of the FEC, to a unique member of A. This process will generate a symbol sequence represented by 𝒙 = (𝑥1, 𝑥2, … , 𝑥𝑘, … , ) with 𝑥𝑘 ∈ 𝐴.
In practice, information is transmitted over a physical medium in the form of an electromagnetic wave. Therefore, the discrete symbols at the mapper output have to be transformed to a signal waveform appropriate for transmission. This process is known as pulse-shaping. In this sense, while the modulation format determines the maximum information each symbol can carry, pulse shaping determines the spectral width occupied by the signal.
After pulse shaping, different kind of equalization techniques to compensate for channel impairments can be applied. Thanks to the availability of high resolution DACs, equalization can be performed at the transmitter side in the digital domain by means of DSP. This is referred as pre-equalization.
The resulting signal is then modulated into a carrier wave and transmitted through the physical channel. In the case of an optical fiber system, the signal is modulated into a laser source by means of an electro-optic IQ-modulator (see Sec. 1.3.1). After transmission, the received-signal coherently detected (see Sec. 1.3.3). Digital post-equalization can also be performed by means of DSP.
After post-equalization, the received symbols 𝒚 = (𝑦1, 𝑦2, … , 𝑦𝑘, … , ) have to be converted
back to a sequence of bits. To do so, a module called the channel decoder estimates the transmitted coded bits and performs error correction. Finally, the information bits are decompressed and the message is recovered.
We recall that in the frame of information theory, all elements between the channel encoder and the channel decoder are referred as the communication channel. That is to say, all elements working at the symbol level as shown in Fig. 1.3.
1.2.1 Achievable Information Rates 1.2.1.1 Channel Capacity
The maximum information rate that can be transmitted over a given communication channel was first formulated by Shannon in [42], and is referred as the channel capacity, 𝐶. Therefore,
27 reliable communication can be achieved only if the information rate, 𝑅, is smaller than or equal to the channel capacity, i.e., 𝑅 ≤ 𝐶.
The channel capacity is determined by the statistical properties of the channel. The simplest additive white Gaussian noise (AWGN) channel is given by:
where and are complex random variables representing the channel input and output respectively, and Z is a complex Gaussian random variable of zero mean accounting for noise. In this case, the AWGN channel will transform into following the channel conditional probability:
with 𝑥 and 𝑦 realizations of and , and 𝑁0 the complex noise variance. The quantity that
measures the maximum amount of information that can be transported over the channel is referred as the mutual information, 𝕀, and is obtained by [43]:
where 𝑝𝑋𝑌(𝑥, 𝑦) is the joint probability, and 𝑝𝑋(𝑥) and 𝑝𝑌(𝑦) are the marginal probability density
functions of and . The channel capacity is the maximum mutual information, where the maximization is performed over all possible input distributions 𝑝𝑋(𝑥), i.e., 𝐶 = max𝑝
𝑋(∙)𝐼( ; ). Shannon showed in [42] that for the AWGN channel, the optimum source distribution that maximizes C is itself complex and Gaussian, of the form:
with P the signal power. The channel capacity is therefore given by the celebrated Shannon capacity formula:
𝐶 = 𝑙𝑜𝑔2(1 + 𝑆𝑁𝑅)
( 1.5 ) and is measured in bits per channel use, where 𝑆𝑁𝑅 = 𝑃 𝑁⁄ 0 is the signal to noise ratio. The
channel capacity can be seen as the maximum achievable information rate at which information can be transmitted over the channel for a given SNR.
= + 𝑍 ( 1.1 ) 𝑝𝑌|𝑋(𝑦|𝑥) =𝜋𝑁1 0𝑒 −|𝑦−𝑥|2 𝑁0 ( 1.2 ) 𝕀( ; ) = ∬ 𝑝𝑋𝑌(𝑥, 𝑦) ∙ 𝑙𝑜𝑔2 𝑝𝑌|𝑋(𝑦|𝑥) 𝑝𝑌(𝑦) 𝑑𝑥𝑑𝑦 = ∬ 𝑝𝑋𝑌(𝑥, 𝑦) ∙ 𝑙𝑜𝑔2 𝑝𝑋𝑌(𝑥, 𝑦) 𝑝𝑋(𝑥) ∙ 𝑝𝑌(𝑦)𝑑𝑥𝑑𝑦 ( 1.3 ) 𝑝𝑋(𝑥) = 1 𝜋𝑃𝑒 −|𝑥|2 𝑃 ( 1.4 )
28 1.2.1.2 Constrained Capacity
The above formulation has been obtained considering that the input and output alphabets 𝐴, and 𝐵 have an infinite number of elements, such that the input and output distributions 𝑝𝑋(𝑥)
and 𝑝𝑌(𝑦) are continuous Gaussian functions. In practical systems, 𝐴 and 𝐵 are finite, and their
distributions are typically not Gaussian. The resulting information rates are denoted as modulation constrained capacity and are bounded away from the Shannon capacity.
Considering a finite constellation alphabet 𝐴 = {𝑎1, 𝑎2, … , 𝑎𝑖, … 𝑎𝑀} of size M, the
constrained capacity can be estimated by Monte-Carlo time averaging for long-enough N as:
where 𝑥𝑘 and 𝑦𝑘 are the k-th symbol of the transmitted and received symbol sequence of size
N. We define the source entropy 𝐻( ) as:
Eq. ( 1.6 ) corresponds to the maximum information rate that can be achieved for a given constellation. In practice, this limit is only attainable in systems where the channel coding and the mapper are jointly designed. This scheme is referred as coded modulation.
1.2.1.3 Generalized Mutual Information
In order to reduce system complexity associated to coded modulation, another coding scheme referred as bit-interleaved coded modulation (BICM) is typically preferred.
BICM allows to separate coding and mapping, resulting in a higher flexibility in system design. Within this scheme, the generated coded bits at the output of the FEC are interleaved to sparse possible burst errors during transmission. The resulting coded interleaved bits are then partitioned into blocks of length 𝑚 = 𝑙𝑜𝑔2(𝑀), and mapped to modulation symbols. At the
receiver side, soft information about the coded bits is propagated from the demodulator to the decoder in the form of bit-wise a posteriori probabilities or log-likelihood ratios. This decoding scheme is known as bit-metric decoding (BMD).
Due to the interleaving, the BICM system can be regarded as 𝑚 parallel memoryless and independent binary channels. The maximum information rate of BICM is usually referred as the generalized mutual information (GMI) defined by [44,45]:
𝕀̂( ; ) = 1 𝑁∑ 𝑙𝑜𝑔2 𝑝(𝑦𝑘|𝑥𝑘) ∑𝑥∈𝐴𝑝(𝑦𝑘|𝑥)𝑝𝑋(𝑥) 𝑁 𝑘=1 ( 1.6 ) 𝐻( ) = 𝐻 = ∑ −𝑝𝑋(𝑥) ∙ log2 𝑝𝑋(𝑥) 𝑥∈𝐴 ( 1.7 ) 𝐺𝑀𝐼 ≈ 𝐻( ) −1 𝑁∑ ∑ 𝑙𝑜𝑔2 ∑𝑥∈𝐴𝑞𝑌|𝑋(𝑦𝑘|𝑥)𝑝𝑋(𝑥) ∑𝑥∈𝐴𝑏𝑘,𝑖𝑞𝑌|𝑋(𝑦𝑘|𝑥)𝑝𝑋(𝑥) 𝑚 𝑖=1 𝑁 𝑘=1 ( 1.8 )
29 where 𝑞𝑌|𝑋 is the auxiliary channel conditional probability, 𝑏𝑘,𝑖 is the i-th bit of the k-th
transmitted symbol, and 𝐴𝑏𝑘,𝑖 is the set of the constellation symbols whose i-th bit is 𝑏𝑘,𝑖.
Employing a BICM scheme results in a capacity loss with respect to the coded modulation constrained capacity. However, this loss is very small assuming Gray-mapping.
1.2.2 Forward Error Correction Codes
As already mentioned, the main goal of channel coding, or FEC, is to add redundancy to the binary information sequence at the output of the source encoder. After transmission over the noisy channel, the FEC decoder exploits this redundancy to fully recover the source information. In general, the binary channel encoder will introduce redundancy bits in form of
parity checks. The code rate, 𝑟𝑐, is defined by:
𝑟𝑐=
𝐾𝑐
𝑁𝑐 ( 1.9 )
The FEC encoder takes a block of 𝐾𝑐 information bits, and adds 𝑁𝑐− 𝐾𝑐 redundant bits. The
FEC overhead is defined by:
𝑂𝐻 = 𝑁𝑐− 𝐾𝑐 𝐾𝑐 =
1 − 𝑟𝑐
𝑟𝑐
( 1.10 ) The Shannon capacity and the GMI derivations in Seq. 1.2.1 assumed ideal FEC codes with block lengths 𝑁𝑐tending to infinity. The information rates of real systems with practical FEC
codes will be bounded away from capacity.
A useful metric to quantify the performance of digital communication system is the bit-error-rate (BER), defined as the ratio between the number of received erroneous bits and the total number of transmitted bits. FEC coding schemes are usually characterized by their coding gain, which measures the difference of the required SNR between coded and uncoded transmission to achieve a given BER. In actual optical communication systems, the required BER after FEC decoding (post-FEC BER) is typically <10-15.
Over the years, different coding schemes have been introduced; i.e., Hamming codes, Reed-Solomon (RS) codes, Bose–Chaudhuri–Hocquenghem (BCH) codes, Block Turbo Codes (BTC), etc. Today high-capacity optical transmission systems beyond 100 Gb/s typically use Low-Density Parity-Check (LDPC) codes with 𝑂𝐻 ~ 20%. A new type of LDPC code referred to as spatially coupled LDPC codes (SC-LDPC) is an emerging channel coding scheme enabling virtually arbitrary long block lengths with manageable complexity [34,46]. SC-LDPC codes can achieve net coding gains close to theoretical limits, operating with less than 1 dB SNR gap to capacity. SC-LDPC will be use as the chosen coding scheme within this work.
30 1.2.3 Modulation Formats
A constellation alphabet having M points can carry a maximum of 𝑚 = 𝑙𝑜𝑔2(𝑀) bits per
symbol. This maximum is achieved only when the probability of occurrence of the constellation points is uniform, i.e., 𝑃𝑋( = 𝑎𝑘) = 1 𝑀⁄ , such that the constellation entropy is defined as:
𝐻( ) = 𝑚 = 𝑙𝑜𝑔2(𝑀) ( 1.11 )
The two real-valued components of the constellation symbols Re(𝑎𝑘), and Im(𝑎𝑘) are
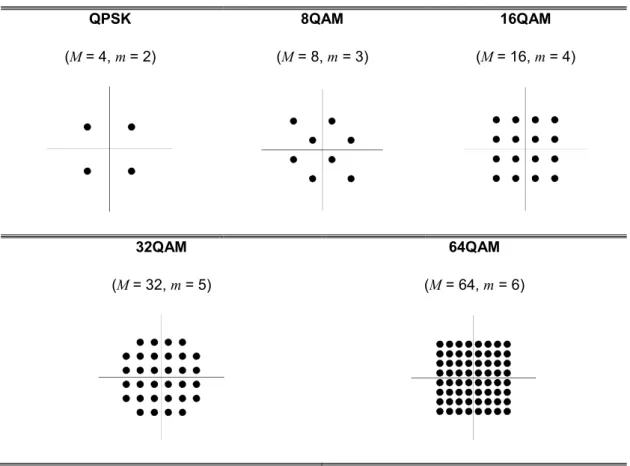
referred as the in-phase (𝐼) and quadrature (𝑄) components respectively, with Re and Im standing for real and imaginary parts. The most well-known modulation formats for coherent optical systems (sketched in Table 1) are: quadrature phase shift keying: (QPSK), and M -quadrature amplitude modulation (QAM), i.e., 8QAM, 16QAM, 32QAM, 64QAM.
Table 1: Some modulation formats used for in coherent optical fiber systems. QPSK (M = 4, m = 2) 8QAM (M = 8, m = 3) 16QAM (M = 16, m = 4) 32QAM (M = 32, m = 5) 64QAM (M = 64, m = 6)
The average power associated with a constellation is given by: 𝑃 = 1
𝑀∑|𝑎𝑘|2
𝑀
𝑘=1
31 For a constant output power of the modulator, constellations with higher values of M will have their points more closely packed together, leading to higher BER for the same SNR, and therefore requiring stronger FECs, i.e., lower code rates. For a given modulation format, BER can be minimized by the use of a proper bit-to-symbol mapping. In general, the probability of symbol error is higher for adjacent symbols, such that the minimum BER is found when adjacent symbols have only one bit difference. The mapping having this property is called Gray mapping.
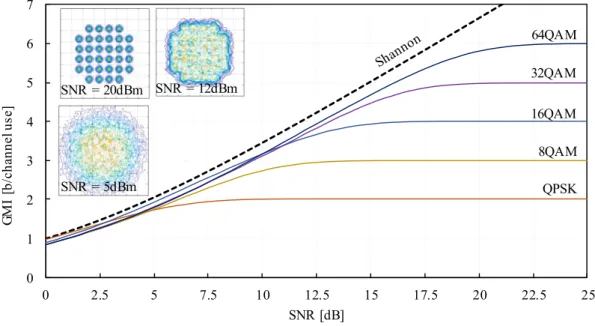
As observed in Table 1, the distribution of the discrete constellations points is not Gaussian, and therefore suboptimal for the AWGN channel. The resulting achievable information rates will be bounded away from the Shannon capacity. Fig. 1.4 shows the GMI in b/channel use for different formats, as well as the Shannon capacity.
Fig. 1.4: Soft-decision generalized mutual information for QPSK, 8/16/32/64QAM. Insets: 32QAM constellation for different SNR values.
At high SNR, all formats saturate at their corresponding entropies H. The insets of Fig. 1.4 show a 32QAM constellation at different values of SNR. For low values of SNR, the constellation resembles more a Gaussian distribution as the signal is highly impaired by AWGN.
Modulation formats with “Gaussian-like” distributions can be used to approach capacity. These formats rely on applying some kind of shaping to a constellation with a discrete number of points. The shaping technique can either be geometrical, where equiprobable constellation points are arranged in the complex plane to make the constellation to appear Gaussian, it can be probabilistic, where the constellation points are visited with nonuniform probability densities approximating the Gaussian distribution; or it can be a combination of both geometrical and probabilistic techniques. These techniques are well known in the literature [47-49], but have
0 1 2 3 4 5 6 7 0 2.5 5 7.5 10 12.5 15 17.5 20 22.5 25 GM I [b /c ha nn el us e] SNR [dB] QPSK 8QAM 16QAM 32QAM 64QAM SNR = 20dBm SNR = 12dBm SNR = 5dBm
32 been recently introduced for fiber-optic telecommunications systems, and have shown to outperform regular square QAM formats [20-22, 30, 41, 50-52].
A type of PCS based on QAM constellation was recently proposed in [50], presenting two main design advantages. First, it can be applied to any square QAM constellation which are desirable due to their simplicity, and for which the BICM scheme can be employed with almost no penalty thanks to the use of symbol Gray mapping; and second, FEC implementation is independent of shaping, such that no change in FEC engine is required for different shaping modes, allowing for rate adaptation with fine granularity [51]. In terms of performance, PCS based on 64QAM was shown to achieve higher shaping gains compared to geometric shaping based on 64-amplitude phase shift-keying (64APSK) [30], while at the same time being more tolerant to frequency offsets and phase noise resulting in lower implementation penalties for low operating signal-to-noise ratio (SNR) regimes [53]. For the above reasons, PCS-QAM has become one of the main subjects of research and is becoming an interesting candidate for implementation in future coherent optical commercial systems.
In PCS-QAM, the probability mass function (PMF) of the QAM constellation points are set according to a discrete Maxwell-Boltzmann distribution with free parameter 𝜈 ≥ 0, according to:
𝑃𝑋(𝑥) =
exp(−𝜈|𝑥|2)
∑ exp(−𝜈|𝑥|2)
𝑥∈𝐴 ( 1.13 )
The free parameter 𝜈 can be optimized to change the source distribution and minimize the gap to the Shannon capacity for a given target SNR. The entropy, 𝐻 , of the resulting constellation can then be obtained as per ( 1.7 ) .Considering a given FEC code rate, 𝑟𝑐, the
ideal transmission rate, R, is calculated by [51]:
𝑅 = 𝐻 − (1 − 𝑟𝑐) ∙ 𝑚 ( 1.14 )
where 𝑚 is the number of bits per symbol of the QAM constellation at which PCS is applied, i.e. 𝑚 = 6 for 64QAM.
In practice, the DSP module which sets the PMF of the constellation points for a given 𝜈 is called the distribution matcher (DM). At the transmitter, the DM is concatenated with a systematic binary encoder for FEC. This scheme is referred to as probabilistic amplitude shaping (PAS). At the receiver side, an inverse DM is placed after the de-mapper and the FEC decoder. Please note that the de-mapper should be modified to account for the symbols prior probabilities. The design of the DMs is an actual research topic and it is out of the scope of this work. The PCS-QAM can be seen as an instance of BICM with bit-metric mismatched decoding, for which the correct metric to measure the achievable rates is the GMI. A detail description of the PAS scheme is found is in [50]. Fig. 1.5a and Fig. 1.5b show the constellations and the PMFs of the in-phase or quadrature components for the standard 64QAM and PCS based on 64QAM with an arbitrary value of 𝜈.
33 Fig. 1.5: Constellations and PMFs of 𝐼 or 𝑄 components for (a) 64QAM and (b) PCS-64QAM formats. (c)
64APSK constellation.
Unlike QAM constellations, APSK constellations usually do not support Gray mapping and require complex iterative FEC decoding. In [52], a 64APSK constellation supporting Gray mapping was introduced, and further used in [20] for transoceanic distances, and it was shown to outperform regular QAM. In particular, 64APSK is composed of 4 concentric rings, each with 16 uniformly spaced PSK points as shown in Fig. 1.5c. On the other hand, hybrid constellations make use of coded modulation with complex iterative decoding, being unattractive for practical implementation in commercial systems and will not be considered in this work.
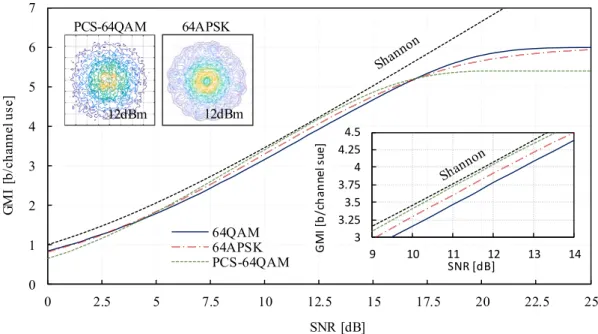
Fig. 1.6 shows the GMI for 64QAM, 64APSK and PCS-64QAM, where the last one is optimized for a SNR value of 12 dB. It is observed that PCS outperforms other formats and approaches the Shannon capacity. A performance comparison between regular QAM formats, 64APSK, and PCS-64QAM is presented in Sec. 3.1.
Fig. 1.6: GMI for 64QAM, 64APSK and PCS-64QAM optimized for a SNR value of 12 dB. -7 -5 -3 -1 1 3 5 7 I or Q symbol levels PM F -7 -5 -3 -1 1 3 5 7 PM F
64QAM PCS-64QAM 64APSK
I or Q symbol levels (a) (b) (c) 0 1 2 3 4 5 6 7 0 2.5 5 7.5 10 12.5 15 17.5 20 22.5 25 GM I [b /c ha nn el us e] SNR [dB] 64QAM 64APSK PCS-64QAM 3 3.25 3.5 3.75 4 4.25 4.5 9 10 11 12 13 14 G M I [ b /c h an nel su e] SNR [dB] 12dBm PCS-64QAM 64APSK 12dBm
34 1.2.3.1 System Performance Metrics
As already mentioned, the post-FEC BER in actual coherent optical communication systems is typically <10-15. In general, such low values make post-FEC BER evaluation practically impossible by means of numerical simulations and experimental off-line processing.
In order to relax this requirement, another performance metric referred as the FEC limit is typically used. It is defined as the maximum BER at the input of the FEC decoder for which the decoder successfully decodes the received block. It general, this approach works well when employing HD-FECs, however, for SD-FECs it is less accurate [54]. In this sense, it has been recently shown that for BICM systems the GMI can be used to make a more robust prediction of the post-FEC BER when QAM formats are used [55-58].
In this work, we focus on three main performance metrics, i.e., SNR, pre-FEC BER (pre-FEC Q2-factor), and the GMI. The pre-FEC BER can be calculated from the transmitted and decided received symbols as:
𝐵𝐸𝑅 = 1
𝑁 ∙ 𝐻∑ 𝑑𝐻(ℳ(𝑥𝑘), ℳ(𝑥̂𝑘))
𝑁
𝑘=1
( 1.15 ) where 𝑥𝑘 is the k’th transmitted symbol, N is the sequence length, ℳ(∙) accounts for
symbol-to-bit mapping, 𝑑𝐻(∙) is the Hamming distance, and 𝑥̂𝑘 is the k’th decided symbol obtained
using maximum a posteriori (MAP) detection as: 𝑥̂𝑘 = argmin
𝑥∈𝐴 [|𝑦𝑘− 𝑥|
2−𝑝𝑋(𝑥)
𝑆𝑁𝑅] ( 1.16 )
BER is usually converted to another performance metric called Q2-factor by: 𝑄2= 20𝑙𝑜𝑔
10[√2 ∙ 𝑒𝑟𝑓𝑐−1(2 ∙ 𝐵𝐸𝑅)] ( 1.17 )
with 𝑒𝑟𝑓𝑐−1 the inverse complementary error function.
While the GMI and the pre-FEC Q2-factor are performance metrics of a digital communication system depending on the modulation format and decoding schemes, the SNR is a direct measure of signal distortions. As it will be pointed out in Sec. 1.4, in modern optical long-haul optical fiber systems as the ones considered in this work, all sources of noise can be well approximated by Gaussian noise statistics, and can be correctly accounted for by SNR calculation. It can be analytically shown that the SNR can be estimated from the transmitted and received symbol sequences as:
𝑆𝑁𝑅̂ = [|𝒙|
2|𝒚|2
|𝒙𝒚†|2 − 1] −1
( 1.18 ) where † is the Hermitian conjugate.
35 1.2.4 Pulse Shaping
After choosing the modulation format, the signal has to be adapted to cope with the physical properties of the medium. Rectangular pulses are not suitable for transmitting data over band limited channels, as they will require infinite bandwidth to avoid distortion. However, limiting the signal bandwidth will produce pulses to spread over time, such that overlapping between different pulses will occur. At the receiver, the waveform will be converted back to the digital domain by means of the ADC. This process is realized by sampling the received waveform with a given sampling frequency. Without proper sampling and proper pulse shape, the sampled signal will suffer from inter-symbol interference (ISI).
The signal waveform can be written as: 𝑥(𝑡) = ∑ 𝑥𝑘𝑔(𝑡)
𝑘
( 1.19 )
where 𝑥𝑘 corresponds to the k’th transmitted constellation symbol. Each symbol will be
multiplied by a given pulse shape, 𝑔(𝑡). For a given symbol-rate, the pulse shape 𝑔(𝑡) that minimizes the signal bandwidth is the 𝑠𝑖𝑛𝑐 function, as its Fourier transform is the rectangular function such that:
𝑔(𝑡) = 𝑠𝑖𝑛𝑐(𝑡)
( 1.20 ) ℱ{𝑔(𝑡)} = 𝑔̃(𝑓) = 𝑟𝑒𝑐𝑡(𝑓 ∙ 𝑇𝑠)
( 1.21 ) where 𝑇𝑠 is the symbol duration. The bandwidth of the resulting complex signal is therefore 𝑊 =
𝑅𝑠, where 𝑅𝑠= 1/𝑇𝑠 is the symbol-rate. One particular property of the 𝑠𝑖𝑛𝑐 function is that it is
zero at all sampling instants 𝑡 = 𝑘𝑇𝑠 except for 𝑘 = 0, i.e:
𝑔(𝑘𝑇) = {1; 𝑘 = 00; 𝑘 ≠ 0 ( 1.22 )
such that perfect sampling at instances 𝑘𝑇𝑠 allows recovering the transmitted data symbols
without ISI. However, the main disadvantage of sync pulses is that the amplitude decays slowly such that unperfect sampling will lead to significant ISI.
36 Fig. 1.7: (a) Sinc pulses in time domain, and (b) raised cosine spectrum with various roll-offs factors.
Another pulse shape which satisfies ( 1.22 ) is the raise-cosine (RC) pulse defined as:
𝑔̃(𝑓) = { 1, |𝑓| ≤(1 − 𝜌) 2𝑇𝑠 1 2[1 + 𝑐𝑜𝑠 ( 𝜋𝑇𝑠 𝜌 [|𝑓| − (1 − 𝜌) 2𝑇𝑠 ])] , (1 − 𝜌) 2𝑇𝑠 < |𝑓| ≤ (1 + 𝜌) 2𝑇𝑠 0, 𝑜𝑡ℎ𝑒𝑟𝑤𝑖𝑠𝑒 ( 1.23 )
where 𝜌 is the roll-off factor. RC pulses decay faster than the 𝑠𝑖𝑛𝑐 pulses when 𝜌 > 0, and are therefore more tolerant to imperfect sampling. However, the required spectrum is increased to 𝑊 = 𝑅𝑠(1 + 𝜌).
Another and most commonly used pulse shape is the root-raised cosine (RRC), which is obtained by applying the square root to the frequency domain version of ( 1.23 ). A priori, RRC pulses do not satisfy ( 1.22 ) and therefore exhibit ISI. However, when the received signal is corrupted by noise, the optimum receiver that maximizes the SNR for AWGN channels is called the matched-filter receiver. The match filter function equals 𝑔(𝑡), such that having an RRC pulse and an RRC matched filter will lead to an overall pulse shape with RC spectrum. Throughout this work we will focus only on RRC pulse shaping.
1.3 C
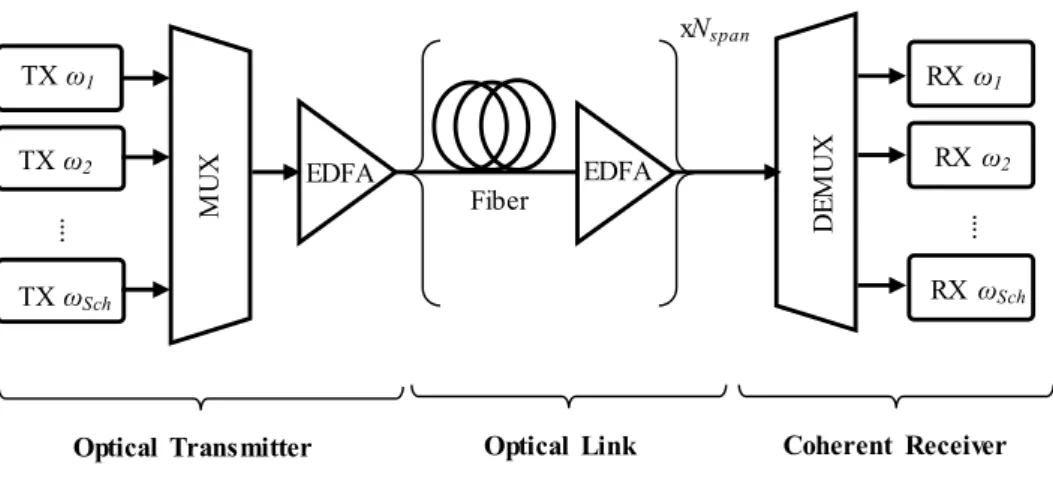
OHERENT OPTICAL COMMUNICATIONS SYSTEMSUp to know, an overview of a general digital telecommunication system, where information is transmitted from source to destination using a given physical channel, has been presented. For the particular case of transoceanic optical systems, the signal has to be adapted to the fiber channel. Fig. 1.8 shows the main structure of a coherent long-haul optical communication system based on WDM technology, consisting of three main blocks: the optical transmitter, the
0 Ts 2Ts 3Ts -Ts -2Ts -3Ts 𝑔 (𝑡 ) 2 𝑔 (𝑓 ) 2 0 Rs/2 Rs -Rs/2 -Rs 𝜌 = 0 𝜌 = 1 (a) (b)
37 optical link, and the coherent optical receiver. In the following, an overview of each of the main blocks is presented.
Fig. 1.8: General block diagram of long haul optical transmission systems.
1.3.1 Optical Transmitter
The main function of the optical transmitter is to convert an electrical waveform into the optical domain for further transmission through the optical link. For typical high-speed systems, this process is achieved by modulating the light of a laser source with an external optical modulator, which is driven by an electrical signal containing the data to be transmitted.
To maximize the spectral efficiency, all possible physical degrees of freedom of light should be considered. Modern coherent systems make use of amplitude, phase and polarization for data modulation. Therefore, any kind of multi-level modulation formats as the ones presented in Sec. 1.2.3 can be employed. The main structure of a WDM amplitude, phase and polarization diversity transmitter is sketched in Fig. 1.9.
After pulse shaping and pre-equalization, the two discrete waveforms to be transmitted over the two orthogonal polarizations 𝐻 and 𝑉 of light are divided into their real and imaginary parts (𝐼 and 𝑄 components), and transformed to an electrical analog waveform by means of four DACs. The four resulting signals are denoted as 𝑥𝑉𝐼, 𝑥𝑉𝑄, 𝑥𝐻𝐼, and 𝑥𝐻𝑄.
An optical carrier with central frequency 𝜔𝑆 is splitted into its two orthogonal polarizations,
each of them feeding two nested Mach-Zehnder (MZ) modulators with 𝜋/2 shift between their outputs. Each MZ is driven by the aforementioned electrical waveform signals. After modulation, the two orthogonal polarizations are recombined by the use of a polarization beam coupler (PBC). In the case of WDM transmission, the same process is performed for the rest Sch -1 optical channels, which outputs are then optically multiplexed by means of a WDM
TX ω1 TX ω2 TX ωSch M U X EDFA Optical Transmitter Fiber EDFA Optical Link xNspan D EM U X RX ω1 RX ω2 RX ωSch Coherent Receiver …. ….
38 multiplexer. The resulting field is finally amplified and sent to the fiber link. Throughout this work all modulation formats are considered to be dual polarization.
Fig. 1.9: Polarization division multiplexing IQ (PM-IQ) WDM transmitter.
In practice, the bandwidth and resolution of DACs are the key factors to achieve higher data rate transmissions. High-speed state-of-the-art DACs based on 28nm CMOS technology allowing sampling rates of 92 GS/s are commercially available [59], while DACs based on BiCMOS technology working at 100 GS/s have been demonstrated [26].
For high-speed long-haul transmission, MZ modulators are preferred over electro-absorption modulators (EML) due to their higher electro-optical bandwidth (~40 GHz), small insertion losses (≤4 dB), high extinction ratio (≥20 dB), and lower wavelength dependency.
1.3.2 Optical Link
The WDM signal at the output of the transmitter is then propagated through the optical link. For long haul applications, the link consists of a concatenation of single mode fiber spans, and optical amplifiers as sketched in Fig. 1.8.
The most common type of amplification is the erbium doped fiber amplifier (EDFA). The output power of an EDFA can exceed 25 dBm, they present relative flat gain spectrum, can achieve noise figures (NF) below 5 dB, and amplification bandwidths of ~35 nm. Moreover, they can be designed to work on C or L bands, such that WDM systems with a useful bandwidth of ~9.7 THz have been demonstrated [22]. Other amplification schemes based on Raman amplification, or hybrid Raman/EDFA also exist. However, due to their high pump power requiring high electrical power feeding, their use have been limited to terrestrial systems. Recently, large bandwidth amplification covering continuous 100 nm optical bandwidth using
Pu lse sh ap in g + Pr e-eq ua liz at io n 𝑥𝑘𝐻 𝑥𝑘𝑉 DAC DAC DAC DAC π/2 PBC Laser ωs
Digital Microwave Optical
Driver Amplifier 𝑥𝐻𝐼(𝑡)
𝑥𝐻𝑄(𝑡)
𝑥𝑉𝐼(𝑡)
39 semiconductor optical amplifiers (SOA) has also been demonstrated for terrestrial distances [60].
In legacy WDM systems, fiber CD was compensated either by introducing optical dispersion compensation units (DCU) in the link, or by the combination of fiber spans with positive and negative dispersion coefficients. These systems are typically referred as dispersion managed (DM). CD is now compensated in the digital domain thanks to the use of coherent detection and DSP, avoiding the use of the highly lossy DCUs, and simplifying the design of optical links. These systems are referred as dispersion unmanaged (DU) and have become the standard for current optical coherent systems. In this work, we focus only in DU long-haul transmission systems based on EDFA amplification (Fig. 1.8). Furthermore, we consider the case where all spans are identical (homogeneous spans).
During propagation, the signal will be impaired by fiber linear and nonlinear effects, as well as by amplified spontaneous emission (ASE) noise introduced at each EDFA stage. These impairments can be analytically represented as following.
Let’s consider the scalar optical field of a given WDM channel labeled by 𝑠, and with central carrier angular frequency 𝜔𝑠, be defined by:
𝐸𝑠(𝑧, 𝑡) = ∑ 𝑥𝑘𝑔𝑘,𝑠(𝑧, 𝑡) 𝑘
𝑒𝑥𝑝(−𝑖𝜔𝑠𝑡 + 𝑖𝛽(𝜔)𝑧) ( 1.24 )
where 𝑧 represents distance, 𝑡 represents time, 𝑥𝑘 correspond to the k’th complex
dimensionless modulation format symbols defining the message (Sec. 1.2.3), 𝑔𝑠(0, 𝑡) is the
pulse shape of the 𝑠 ’th optical channel waveform (Sec. 1.2.4), and 𝛽 is the propagation constant. The total optical field considering all WDM channels can then be expressed as:
𝐸(𝑧, 𝑡) = 𝐸0(𝑧, 𝑡) + ∑ 𝐸𝑠(𝑧, 𝑡) 𝑠
( 1.25 )
where the channel of interest (COI) corresponding to 𝑠 = 0 has been singled out from the summation. In this work, we suppose that 𝑔0(0, 𝑡) = 𝑔𝑠(0, 𝑡) for all s, such that all channels have
the same pulse shaping.
We define the pulse energy as:
𝜀 = ∫|𝑔0(0, 𝑡)|2𝑑𝑡 ∞
−∞
( 1.26 )
and the normalized optical field 𝑈(𝑧, 𝑡) at a given propagation distance z as: 𝑈(𝑧, 𝑡) = 𝐸(𝑧, 𝑡)
![Fig. 1.1 shows the map of optical submarine cables laid worldwide by 2017, stretching over 1.1 million km [7]](https://thumb-eu.123doks.com/thumbv2/123doknet/11409166.288203/23.892.145.753.690.1116/fig-shows-optical-submarine-cables-worldwide-stretching-million.webp)