BEVPS: A new test battery to assess visual perceptual and spatial processing
abilities in 5–14 year-old in children
Emilie Schmetz, Laurence Rousselle, Cécile Ballaz, Jean-Jacques Detraux, and Koviljka Barisnikov
QUERY SHEET
This page lists questions we have about your paper. The numbers displayed at left can be found in the text of the paper for reference. In addition, please review your paper as a whole for correctness.
Q1: Au: Please remove citation from abstract as not in accordance with APA style manual. Q2: Au: Please provide reference for citation [Dutton & Lueck, 2015].
Q3: Au: Please confirm whether [Humphreys & Riddoch, 1987] refers to [Humphreys & Riddoch, 1987a] or [Humphreys & Riddoch, 1987b]. Please check.
Q4: Au: Please confirm which [Humphreys & Riddoch] is [Humphreys & Riddoch’s model].
Q5: Au: Please confirm whether [Humphreys & Riddoch, 1987] refers to [Humphreys & Riddoch, 1987a] or [Humphreys & Riddoch, 1987b]. Please check.
Q6: Au: Please confirm whether [Humphreys & Riddoch, 1987] refers to [Humphreys & Riddoch, 1987a] or [Humphreys & Riddoch, 1987b]. Please check.
Q7: Au: Please confirm which [Humphreys & Riddoch] is [Humphreys & Riddoch’s model]. Q8: Au: Please confirm which [Humphreys & Riddoch] is [Humphreys & Riddoch’s model]. Q9: Au: Please confirm which [Humphreys & Riddoch] is [Humphreys & Riddoch’s model]. Q10: Au: Please confirm which [Humphreys & Riddoch] is [Humphreys & Riddoch’s model]. Q11: Au: Please confirm which [Humphreys & Riddoch] is [Humphreys & Riddoch’s model].
Q12: Au: Please confirm whether [Humphreys & Riddoch, 1987] refers to [Humphreys & Riddoch, 1987a] or [Humphreys & Riddoch, 1987b]. Please check.
Q13: Au: Please provide a translation in brackets for reference [Cannard et al., 2006]. Q14: Au: Please provide a translation in brackets for reference [Chaix & Albaret, 2014]. Q15: Au: Please provide a translation in brackets for reference [Charnallet, 1998]. Q16: Au: Please provide missing page range for the reference [Chokron, 2015].
Q17: Au: Please provide a translation in brackets for reference [Chokron, Cavézian, & de Agostini, 2010]. Q18: Au: Please provide missing page range for the reference [Dutton, 2015].
Q19: Au: Please provide a translation in brackets for reference [Gillet, Chabernaud, Batty, Barthélémy, & Jambaqué, 2009].
Q20: Au: Please provide missing publisher location for the reference [Hammil, Pearson, & Voress, 1993]. Q21: Au: Please provide missing publisher location for the reference [Hammil, Pearson, & Voress, 2013]. Q22: Au: Please provide missing publisher location for the reference [Humphreys & Riddoch, 1987a]. Q23: Au: Please provide missing publisher location for the reference [Humphreys & Riddoch, 1987b]. Q24: Au: Please provide missing book publisher for the reference [Kanisza, 1979].
Q25: Au: Please provide missing publisher location for the reference [Beery, Buktenica, & Beery, 2010]. Q26: Au: Please provide missing page range for the reference [Lueck, 2015].
Q27: Au: Please cite [Lueck, 2015] in text or delete reference.
Q28: Au: Please provide missing publisher location for the reference [Martin, 2006]. Q29: Au: Please provide a translation in brackets for reference [Schmetz & Rousselle, 2016]. Q30: Au: Please provide a translation in brackets for reference [Vilayphonh et al., 2009].
Q31: Au: Please provide missing publisher location for the reference [Warrington & James, 1991]. Q32: Au: Pease provide a translation in brackets for reference [Weber, Pache, Lütschg, & Kaiser, 2004].
TABLE OF CONTENTS LISTING The table of contents for the journal will list your paper exactly as it appears below:
BEVPS: A new test battery to assess visual perceptual and spatial processing abilities in 5–14 year-old in children Emilie Schmetz, Laurence Rousselle, Cécile Ballaz, Jean-Jacques Detraux, and Koviljka Barisnikov
APPLIED NEUROPSYCHOLOGY: CHILD https://doi.org/10.1080/21622965.2017.1336710
5
BEVPS: A new test battery to assess visual perceptual and spatial processing
abilities in 5–14 year-old in children
Emilie Schmetza, Laurence Roussellea, Cécile Ballazb, Jean-Jacques Detrauxc, and Koviljka Barisnikovd
aNeuropsychology Unit, Psychology Department, Cognition and Behaviour, FAPSE (Ulg), Reference Centre for Cerebral Palsy Ulg, Liège,
Belgium; bPsychology Department, FPSE - University of Geneva, Genève, Switzerland; cPsychology Department, FAPSE (Ulg), Liège, Belgium;
10 dChild Clinical Neuropsychology Unit, Psychology Department, FPSE - University of Geneva, Genève, Switzerland
ABSTRACT
This study aims to examine the different levels of visual perceptual object recognition (early, intermediate, and late) defined in Humphreys and Riddoch’s (1987a) model as well as basic visual spatial processing in children using a new test battery (BEVPS). It focuses on the age sensitivity, internal coherence, theoretical validity, and convergent validity of this battery. French-speaking, typically developing children (n à 179; 5 to 14 years) were assessed using 15 new computerized subtests. After selecting the most age-sensitive tasks though ceiling effect and correlation analyses, an exploratory factorial analysis was run with the 12 remaining subtests to examine the BEVPS’ theoretical validity. Three separate factors were identified for the assessment of the stimuli’s basic features (F1, four subtests), view-dependent and -independent object representations (F2, six subtests), and basic visual spatial processing (F3, two subtests). Convergent validity analyses revealed positive correlations between F1 and F2 and the Beery-VMI visual perception subtest, while no such correlations were found for F3. Children’s performances progressed until the age of 9–10 years in F1 and in view-independent representations (F2), and until 11–12 years in view- dependent representations (F2). However, no progression with age was observed in F3. Moreover, the selected subtests, present good-to-excellent internal consistency, which indicates that they provide reliable measures for the assessment of visual perceptual processing abilities in children. Q1
KEYWORDS
Child; development; object recognition; visual perceptual processes
35 Introduction
Visual perception refers to the processes involved in the detection and recognition of visual information and determines the way in which something is seen, known, and understood (Dutton & Lueck, 2015
Q2 ). Indeed, visual
40 perception is fundamental to the development of
cognitive, academic, and social skills (Chokron, Cavézian, & de Agostini, 2010).
As object recognition is involved in all daily activities, it is evidently an important aspect of visual
45 perceptual processing. Several theoretical models on
visual object recognition have been elaborated from behavioral data collected in healthy and brain-damaged adults. One of the most renowned theoretical frame-works is Humphreys and Riddoch’s model (Humphreys
50 & Riddoch, 1987a), which distinguishes two processing
stages in visual object recognition. First, the pre- semantic processing stage allows an object to be correctly perceived based on visual input and to be asso-ciated with structural knowledge. Second, the semantic
55 processing stage allows the elaborated percept to be
associated with semantic and functional knowledge about objects and to be named. Each processing stage encompasses multiple sub-processing steps that can be selectively impaired following a brain lesion (Rumiati,
60
Humphreys, Riddoch, & Bateman, 1994). Studies with brain-damaged adults showed a clear dissociation between pre-semantic and semantic processing stages, in case of right or left lateralized lesions (Warrington & Taylor, 1978), and in cases of integrative agnosia
65
(Butter & Trobe, 1994; De Renzi & Lucchelli, 1993; Humphreys & Riddoch, 1987a).
This paper will focus on the pre-semantic processing
stage including four levels (Charnallet, 1998;
Humphreys & Riddoch, 1987a, 2006). The first level
70
known as “early analysis” regroups the processes involved in the treatment of basic shape components and in the parallel coding of the local and global features of the object (internal details and contours). In the second level called “intermediate analysis,” local and
75
global traits are integrated to form a complete and flex-ible representation of objects (Humphreys & Riddoch,
none defined
CONTACT Emilie Schmetz [email protected] Neuropsychology Unit, Psychology Department, Cognition and Behaviour, FAPSE (Ulg), Reference Centre for Cerebral Palsy Ulg, Quartier Agora Place des Orateurs 1 – Bâtiment B33 4000, Liège, Belgium.
Color versions of one or more of the figures in this article can be found online at www.tandfonline.com/hapc.
© 2017 Taylor & Francis Group, LLC
2006; Riddoch et al., 2008). The parallel processes at work in intermediate analysis enable figure-ground discrimination and visual closure, and allow local and
80 global perceptual features to be grouped into a global
view-dependent representation of the object. These pro-cesses play a crucial role in the perceptual organization of the visual world by allowing us to use individual objects while ignoring background information. The
85 third processing level known as “late analysis” leads to
the elaboration of a 3D-object structures representation that is a view-independent representation of the object. As a result, objects that are presented from different points of view could be matched with episodic
represen-90 tations stored in memory at each encounter with this
object, on the basis of one or more distinctive character-istics (i.e., main axis, critical distinctive features, Humphreys & Riddoch, 1987
Q3 ). The fourth, pre-semantic
processing level, allows access to stored knowledge on
95 the physical characteristics of forms and objects, and
to match these with a prototypical representation stored in the long-term memory (Humphreys & Riddoch, 2006; Peissig & Tarr, 2007). These two last processing levels are regrouped into the name “late analysis” as
100 they both included mnesic representations.
As can be seen in the aforementioned section, the pre- semantic stage involves different processing levels that allow the construction of an elaborated percept based on the view-dependent and independent representations
105 of object and, on the access to stored structural
knowl-edge. In contrast, the semantic stages include the access to stored semantic and functional knowledge in long- term memory, and the object naming (Humphreys & Riddoch, 1987a, 2006; Riddoch et al., 2008).
110 Based on their theoretical model and clinical
observations of subgroups of brain-damaged adults, Humphreys and Riddoch (1993) developed the Birmingham Object Recognition Battery (BORB) to characterize specific patterns of impairments. However,
115 while the BORB is a useful screening tool for the
assess-ment of a large number of perceptual processes, some processes are not examined with this tests battery. For example, in terms of intermediate processing, only fig-ure-ground discrimination is evaluated, and no test is
120 proposed to assess visual closure and local-global
pro-cessing abilities. Moreover, some BORB’s drawings are unattractive or represent objects that are little or not at all known to children (e.g., thimble). Finally, the efficient use of objects and the interaction with them
125 also depends on spatial processing skills such as the
object’s location and its spatial orientation (Chaix & Albaret, 2014; Dutton, 2015; Schmetz & Rousselle, 2016), but these are not represented in Humphreys and Riddoch’s (1987a) model.
130
Considering the importance of object recognition abilities in daily life and learning, it is surprising that no tools simultaneously assess the different visual per-ceptual processing levels and visual spatial processing skills in children. Such tools are crucial for the precise
135
assessment of visual perceptual and spatial impairment in children, as they could help to determine whether and how these deficits influence cognitive development and learning abilities. In fact, many different visual perceptual tasks (mainly based on adult theoretical
140
models) are currently used to assess these abilities in typically developing (TD) and brain-damaged children. However, to the best of our knowledge, no study has assessed all visual perceptual and spatial processing abilities simultaneously using consistent methodology.
145
Table 1 presents a review of existing literature on the assessment of visual perceptual and spatial processing in TD children and reveals that none of the assessment tools allow a complete evaluation of the different visual perceptual processes. For each study, the table reports
150
the age of participants, the clinical comparison group, and the assessment tools used in reference to the different pre-semantic processing levels of Humphreys
and Riddoch’s model. Q4
Three studies used the original BORB subtests to
155
assess early, intermediate, and late perceptual proces-sing in 7- to 11-year-old TD children, and children with neuro-developmental pathologies (Gillet, Chabernaud, Batty, Barthélémy, & Jambaqué, 2009; Joy & Brunsdon, 2002; Swain, Joy, Bakker, Shores, & West, 2009). These
160
studies highlighted the difficulties faced by participants in different clinical groups compared to TD children matched for chronological or mental age. Joy and Brunsdon (2002) found that a child with a developmen-tal visual agnosia without brain lesion shows deficits in
165
all three processing levels. Swain et al. (2009) showed that children with myelomeningocele and hydrocepha-lus diagnosed at birth display deficits in both early and late processing levels, in particular in the length judgment and the object constancy subtests. Conversely,
170
Gillet et al. reported that children with autism showed equal performances in the different levels of analyses, except in orientation and location processing in these children, showed higher performances than TD children matched on mental age. Unfortunately, clinical groups
175
were very small and could not reflect the heterogeneity of cognitive processing present in children with differ-ent neuro-developmdiffer-ental pathologies. Moreover, the developmental trajectory of these processes was not examined in TD children. It should be also noted that
180
early processes were assessed with all four BORB sub-tests, while intermediate processes were assessed with only one subtest (figure-ground discrimination).
Over the last ten years, a series of other batteries have been set up and used to examine the typical
develop-185 ment of visual perceptual processes during childhood.
For example, the Visual Object and Space Perception Battery (VOPS; Warrington & James, 1991), allowing the assessment of intermediate and late perceptual processing levels as well as spatial processing, was
190 developed for adults, and then was used to collect
nor-mative data for a German-speaking population of TD children aged between 8 and 12 years (Weber, Pache, Lütschg, & Kaiser, 2004). Likewise, both the Develop-mental Test of Visual Perception, third edition (DTVP
195 III, Hammil, Pearson, & Voress, 2013) and the L94
visual perceptual battery (Stiers, De Cock, & Vandenbussche, 1999) were specifically created to assess intermediate and late visual perceptual processing and visual spatial processing in 4- to 12-year-old English-
200 speaking children and 2.5- to 7-year-old Flemish-
speaking children, respectively. The different subtests assess the intermediate and late processing levels, but again neglect to evaluate the early processing compo-nents. Moreover, Stiers et al. tested TD children using
205 the L94 visual perceptual battery to collect normative
data, but the typical developmental trajectory was not systematically examined. The Test of Visual Perceptual Skills (TVPS 3, Martin, 2006), standardized for
English-speaking children and adolescents aged
210
between 4 and 19 years, includes different subtests assessing intermediate and late visual perceptual processing, as well as visual memory and visual spatial processing. No test for the assessment of early visual perceptual processing component is included in those
215
four batteries of tests.
Recently, Chokron (2015) developed the Evaluation of Visual Attention Processing (EVA), a battery of tests designed to screen for visual attention disorders in 4- to 6-year-old French-speaking children (Vilayphonh et al.,
220
2009). This battery includes subtests that assess various neurovisual processing (e.g., visual pursuit, visual fields), visual cognitive abilities (e.g., visual memory for shapes, selective visual attention) and certain visual perceptual abilities (e.g., figure-ground discrimination,
225
shape matching) and thus constitute a useful assess-ment of neurovisual processes. However, it does not provide a complete screening of visual perceptual processing.
Finally, Pisella et al. (2013) developed a battery with
230
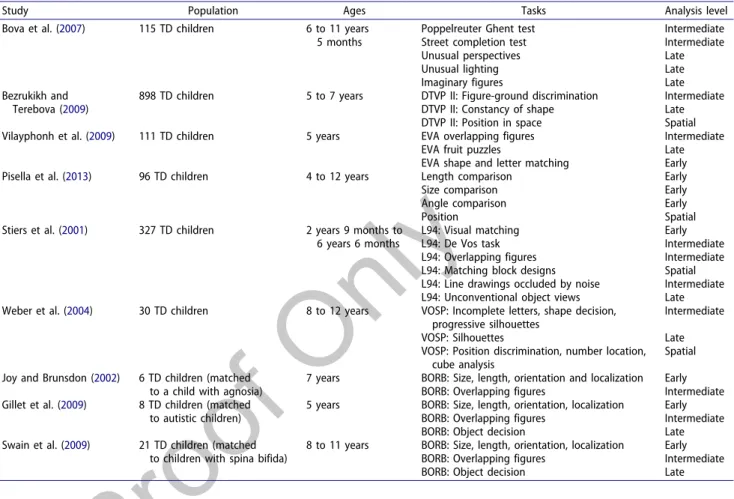
six tasks inspired by the BORB and VOSP subtests and tested French-speaking children between the ages of 4 and 12 years. These tests assess only the early level of perceptual processing (e.g., length, surface) and basic spatial characteristics (e.g., localization, orientation). Table 1. Studies on visual perceptual and spatial processing in TD children.
Study Population Ages Tasks Analysis level
Bova et al. (2007) 115 TD children 6 to 11 years
5 months Poppelreuter Ghent test Street completion test Intermediate Intermediate Unusual perspectives Late
Unusual lighting Late
Imaginary figures Late Bezrukikh and
Terebova (2009) 898 TD children 5 to 7 years DTVP II: Figure-ground discrimination DTVP II: Constancy of shape Intermediate Late DTVP II: Position in space Spatial Vilayphonh et al. (2009) 111 TD children 5 years EVA overlapping figures Intermediate
EVA fruit puzzles Late EVA shape and letter matching Early Pisella et al. (2013) 96 TD children 4 to 12 years Length comparison Early
Size comparison Early
Angle comparison Early
Position Spatial
Stiers et al. (2001) 327 TD children 2 years 9 months to
6 years 6 months L94: Visual matching L94: De Vos task Early Intermediate L94: Overlapping figures Intermediate L94: Matching block designs Spatial L94: Line drawings occluded by noise Intermediate L94: Unconventional object views Late Weber et al. (2004) 30 TD children 8 to 12 years VOSP: Incomplete letters, shape decision,
progressive silhouettes Intermediate VOSP: Silhouettes Late VOSP: Position discrimination, number location,
cube analysis Spatial
Joy and Brunsdon (2002) 6 TD children (matched
to a child with agnosia) 7 years BORB: Size, length, orientation and localization BORB: Overlapping figures Early Intermediate Gillet et al. (2009) 8 TD children (matched
to autistic children) 5 years BORB: Size, length, orientation, localization BORB: Overlapping figures Early Intermediate BORB: Object decision Late Swain et al. (2009) 21 TD children (matched
to children with spina bifida) 8 to 11 years BORB: Size, length, orientation, localization BORB: Overlapping figures Early Intermediate BORB: Object decision Late
235 None of the aforementioned studies provides a
systematic assessment of the development of different visual perceptual and spatial processes in the same sam-ple of children. Among the studies examining the visual perceptual or spatial processes (Table 1), very few
240 reported data on the developmental course of these
processes in children. As a result, there is currently no model that depicts the developmental trajectory of vis-ual perceptvis-ual and spatial processing abilities in chil-dren or that gives indications on the hierarchy of the
245 different visual perceptual processes in this population.
Some studies reported that visual object recognition develops gradually with age in TD children (Bezrukikh & Terebova, 2009; Bova et al., 2007). Pisella et al. (2013) show a significant development of early analysis
pro-250 cesses between the ages of 4 and 12 years with the
assessment of length, size, position, and angle compar-isons. Bova et al. (2007) highlighted that several pro-cesses of visual perception such as figure-ground discrimination (intermediate) as well as object
con-255 stancy and view-independent object recognition (late)
develop only after the age of 6 years. Some of these pro-cesses such as the perception of visual closure continue to progress after the age of 11 years. In adulthood, objects can be recognized from partial views, different
260 points of views, or partially occluded views, indicating
that the different levels of processing have matured. Pereira and Smith (2009) showed that very young children are able to recognize simple objects when presented as a whole, while 2 year olds can recognize
265 familiar objects by processing only local parts or
proto-typical details of these objects. From the age of 5 years, children can recognize objects by processing local parts and a global shape as well as from outline drawings.
In summary, the different batteries of tests used to
270 assess the typical development of visual perceptual
and spatial processes in TD children provide some information regarding the developmental trajectory of the underlying processes. However, no study to date has simultaneously assessed the different processing
275 levels of the pre-semantic stage as well as basic visual
spatial processing skills in the same sample of children with typical or atypical development. Furthermore, most batteries of tests are narrow in scope; they include only a few items and provide a global score for each
280 process without contrasting the different presentation
conditions and levels of difficulties (no individual score for each condition is available). As a result, the global view of the developmental trajectories of the specific processes of visual perception remains fragmented and
285 incomplete.
In light of these findings and concerns, the aim of the present study is to assess the different processing levels
of the pre-semantic stage defined in the Humphreys and Riddoch’s model (1987) as well as the basic visual spatial Q5
290
processing (essential for optimal object manipulation and interaction) in TD children using a new computer-ized battery of tests. Mainly inspired by the BORB, the subtests were supplemented with others in order to complete the assessment of intermediate visual
percep-295
tual processing such as visual closure and local-global processing abilities. The involvement of praxis, visual construction, motor, and language functions is strictly limited. It is hoped that this new tool will be of use in future studies on visual perceptual disorders in children
300
with neuro-developmental pathologies such as Cerebral Palsy who are at risk for associated disorders such as motor disabilities, oculomotor deficits, reduced short- term memory abilities, and language impairments.
To assess the different levels of the pre-semantic
305
processing stage (i.e., analysis of basic visual features, view-dependent and view-independent object represen-tations, and access to structural knowledge), and basic visual spatial processes (spatial location and evaluation of distances), all BEVPS (Battery for the Evaluation of
310
Visual Perceptual and Spatial processing in children) subtests were administered to a sample of TD children aged between 5 and 14 years. The distribution of perfor-mances was examined separately according to age and visual perceptual and spatial processing levels in order
315
to select the most appropriate tasks by removing any that were considered too long, difficult, easy, or redun-dant. Exploratory factorial analysis was also performed to assess the latent factor structure of our different sub-tests. Finally, convergent validity was examined between
320
the performances for our subtests using a valid test (i.e., Visual Perception subtest of the Beery-Buktenica Developmental Test of Visual-Motor Integration, VMI, 2010).
Methodology
325 Participants
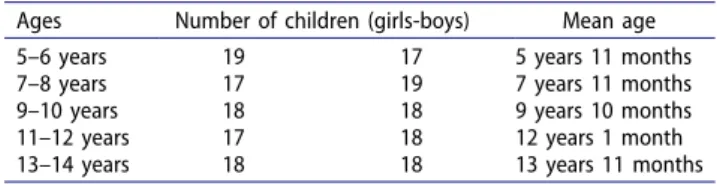
This explorative study included 179 TD children aged between 5 and 14 years 11 months divided into five age groups (Table 2). The criteria for exclusion were the following: the presence of a neuro-developmental
330
disorder (including Cortical Visual Impairment) or a Table 2. Distribution of typically developing children.
Ages Number of children (girls-boys) Mean age 5–6 years 19 17 5 years 11 months 7–8 years 17 19 7 years 11 months 9–10 years 18 18 9 years 10 months 11–12 years 17 18 12 years 1 month 13–14 years 18 18 13 years 11 months
medical pathology resulting in school absenteeism, the repetition of a grade in school, a learning disability, and an uncorrected eye disorder. Children included in the sample were drawn from middle-class schools in
335 the Walloon Region, Belgium, and were tested by
examiners trained to apply the method and guidelines for the administration of the tests. Informed consent was obtained from the participants and their parents in accordance with the Declaration of Helsinki.
340 Materials
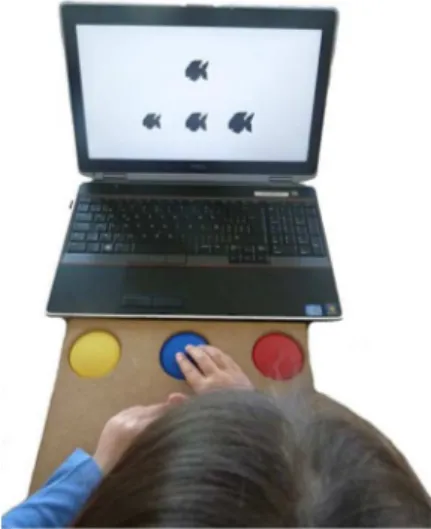
The new tests battery is administered on a laptop with a 15.6-inch screen. Before presenting each item, a screen appeared with a central fixed point for a duration fixed at 1200 ms to respect the speed processing of
345 information of the youngest children and children with
neuro-developmental pathologies. Responses were recorded using the Superlab 4.5 software (Cedrus Corporation, San Pedro– USA). To respond, the child had to press one of three colored switches (6 cm in
350 diameter each yellow on the left, blue in the middle,
and red on the right) corresponding to the correct response. The three switches were embedded in a wooden support and placed on the table in front of the laptop (Figure 1).
355 Tasks and stimuli
We have created fifteen subtests with new attractive drawings using Paint.net free software (dotPDN LLC), Gimp free software (The GIMP Team), and Publisher software (Microsoft Office 2013) to assess the different
360 visual perceptual and spatial processes in children.
The subtests were classified into three groups: (a) visual perceptual processing subtests (divided into early,
intermediate, and late processing stages), (b) visual spa-tial processing subtests, and (c) control subtests. The
365
subtests could be matching tasks, which required the child to choose the stimulus corresponding to a target from three possibilities; naming tasks, in which the child had to name the stimulus; or binary decision task, which required the child to classify the stimulus into two
370
categories.
To target the processes of interest, the presentation of the items and the modality of responses were designed to reduce as much as possible the involvement of other cognitive processes such as working or long-term
375
memory, praxis and motor skills, visual constructional aptitudes, and language abilities. In all tasks, no time limit was placed on the stimuli presentation so as to ensure that each child had sufficient time to see all items presented on the screen and avoid memory-based
380
responses. This methodological choice was made to use these subtests in comparative studies with children presenting different neuro-developmental pathologies. The use of large switches instead of a keyboard aimed to limit the involvement of motor and praxis functions.
385
Testing only involved perceptual processing, thus avoided visual constructional skills. While the instruc-tions were given in the form of short sentences, the examiner also touched the target and the stimuli on the screen to explain the purpose of the subtest. One
390
point was given for each correct response.
A series of subtests was designed to examine the dif-ferent processing levels of the pre-semantic stage described in Humphreys and Riddoch’s (1987a) model. Table 3 reports the different tasks used to assess each
395
processing level as well as those for visual spatial processing (15 in total).
Visual perceptual processing: Early analysis
The subtests examining the early level of analysis assessed the processing of local basic shape components
400
and global features of the stimuli. Except for the detec-tion of visual features, all other subtests in this early level of analysis (i.e., surface, length, orientation, pos-ition) were matching tasks inspired by the BORB (Humphreys & Riddoch, 1993). In each subtest, items
405
varied according to three levels of difficulty, and within each level, the items were presented in increasing order of difficulty, with more and more subtle differences to be gradually perceived.
Surface
410
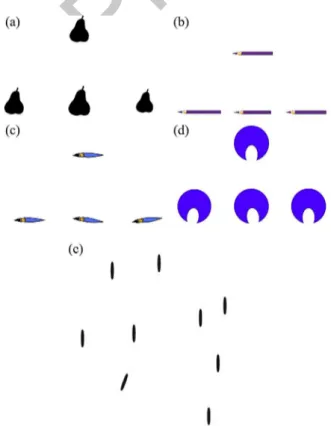
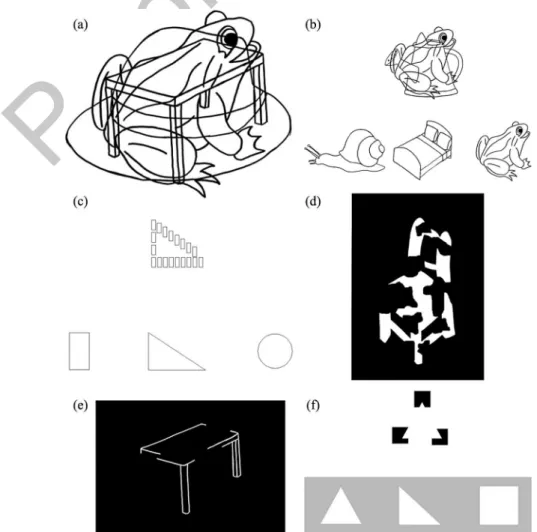
This subtest assessed the ability to estimate the surface area occupied by objects. Children were presented with four drawings of black silhouettes of everyday objects Figure 1. Computer with the three response switches.
(one target and three possible answers) and asked to select one of the three silhouettes that corresponded
415 to the target silhouette presented at the top of the screen
(Figure 2a). Items varied in terms of the percentage difference in surface area between the distractors and the target (from 1% to 15%). For each item, the percent-age difference was equal for both distractors, with each
420 one either over- or underestimating the surface of the
target. Three items were presented for each percentage difference in surface area, with a total of 45 items in the whole task.
Length
425 This subtest assessed the ability to estimate the length of
objects. Children were asked to select one of the three pencils that corresponded to the length of the target pencil (Figure 2b). In half of the items, the pencils were placed horizontally, and in the other half, vertically. As
430
their length did not vary locally at the pencil lead, the children had to analyze the length globally. Moreover, in the vertical presentation, the three pencils were aligned at their midpoint. Similarly to the surface sub-test, items varied with regard to the percentage
differ-435
ence in the length between the distractor and the target (from 1% to 15%). For each item, the percentage difference in the length was equal for both distractors, with each one either over- or underestimating the target length. Three items were presented for each percentage
440
difference in length, with a total of 45 items in the whole task.
Orientation
This subtest assessed the ability to understand the orien-tation of objects. Children were asked to select one of
445
three paintbrushes that corresponded to the orientation of the target paintbrush presented at the top of the screen (Figure 2c). The paintbrushes were placed hori-zontally, vertically, or in an oblique position (⌃45° from the vertical axis). For each item, the two distractors were
450
presented with either a clockwise or counterclockwise rotation of 1°, 3°, 5°, 7°, 9°, 11°, 13°, or 15° from the tar-get position, with the amount of deviation being equal for both distractors. A total of 64 items were presented in this subtest, with eight items for each 1° rotation (two
455
horizontal, two vertical, two oblique to the left, and two oblique to the right).
Position
This subtest assessed the ability to evaluate the relative position of objects. Children were presented with discs
460
with a semi-circular opening. They were asked to select one of three discs that corresponded to the position of the target disc (Figure 2d). The opening of the target was oriented horizontally for half of the trials (left/right counterbalanced) and vertically for the other half (top/
465
down counterbalanced). For each item, the two distrac-tors presented either a clockwise or counterclockwise rotation of 1° to 15° from the position of the target, with the amount of deviation being equal for both distrac-tors. Four items were presented for each 1° rotation,
470
with a total of 60 items in the whole task.
Table 3. Repartition of visual perceptual processing subtests according to Humphreys and Riddoch’s model (1987)as well as visual Q6 spatial processing subtests.
Visual perceptual processing Visual spatial processing
Early analysis Intermediate analysis Late analysis Basic components Surface Overlapping figures Object constancy Location in a box
Length Hierarchical figures Object decision Topology
Orientation Incomplete figures Object completion Evaluation of distances
Position White figures
Detection of visual features
Figure 2. Examples of items found in the subtests for the early processing stage. (a) Surface, (b) Length, (c) Orientation, (d) Position, and (e) Detection of visual features.
Detection of visual features
This subtest assessed the perception of line orientations as based on the protocol in the study of Ballaz, Boutsen, Peyrin, Humphreys, and Marendaz (2005). The subtest
475 was divided into two detection tasks (Figure 2e).
Children had to decide (a) whether an oblique line was hidden among a set of vertical lines (oblique detection) and, inversely, (b) whether a vertical line was presented among a set of oblique lines (vertical
480 detection). The size of the display increased in
com-plexity with three, six, and then nine lines. For each display size, 16 items were presented, with a total of 48 items in each of the two detection tasks.
Visual perceptual processing: Intermediate
485 analysis
The subtests examining the intermediate level of analysis assessed a child’s ability to integrate local and global traits into a view-dependent representation of an object. Four subtests were proposed to each participant:
490
(a) overlapping figures to assess figure-ground discrimi-nation abilities, (b) hierarchical figures to test local- global perceptual processing, (c) incomplete figures to assess visual closure on everyday objects, and (d) white figures to examine visual closure on geometrical shapes.
495
In the overlapping and incomplete figures subtests, items belonged to four different semantic categories (utensils, furniture, clothing, and animals) and were selected based on the ability of a 5-year-old child to name the objects or animals. For each picture, the success rate was between
500
95% and 100% (Cannard et al., 2006).
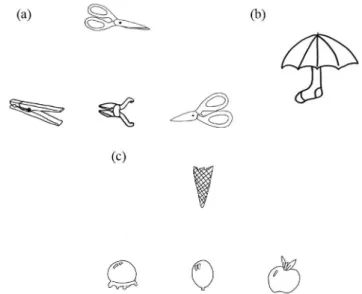
Overlapping figures
This subtest assessed the ability to discriminate between figure and ground. Children were presented with two, three, or four overlapping black outline drawings on a
505
white background and were asked to identify the overlapping figures. This subtest included two tasks administered in the following order: a naming task in which participants had to name the different objects (Figure 3a) and a matching task in which participants
Figure 3. Examples of items found in the subtests for the intermediate processing stage. (a) Naming task and (b) Matching task from the overlapping figures subtest, (c) Hierarchical figures subtest, (d) White silhouette task, and (e) Outlined drawing task from the incomplete figures subtest, and (f) White figures subtest.
510 had to identify among three pictures the one hidden in
the overlapping figures (Figure 3b). Each task consisted of 36 items. The naming task began with 12 items with fully overlapping figures, followed by 12 items with a partial overlap, and then 12 items with figures with no
515 overlap but touching outlines. For each overlapping
level, children were first presented with two, three, and then four figures, each with four items. In the matching task, all items included fully overlapping figures with eight, twelve, and sixteen items for two,
520 three, and four figures, respectively, presented in a
counterbalanced order.
Hierarchical figures
This subtest, drawing from the study of Navon (1977), assessed the preferential perceptual processing strategy
525 (global or local) used to identify forms. Children were
presented with a series of basic shapes (local) arranged to form a geometric figure (global). The subtest was divided into two tasks in which children had to select one of three shapes corresponding to either the overall
530 shape of the stimuli (global identification task, see
Figure 3c) or the constitutive elements (e.g., crosses) (local identification task). Local and global identifi-cation tasks were administered in a counterbalanced order. Each task consisted of 30 items presented in
535 random order; in half of the items, the local and global
features referred to the same shape (e.g., a square made of squares), and in the other half, the local and global features corresponded to different shapes (e.g., a square made of triangles). Figures consisted of simple
(rec-540 tangle, square, triangle, circle, and ellipse) and complex
geometric shapes (diamond, star, cross, and hexagon).
Incomplete figures
Inspired by Biederman’s (1987) work, this subtest assessed the visual closure of objects, that is, the ability
545 to form a coherent global perception based on an
object’s local features. Children were asked to recognize and name living and non-living objects depicted by a white image on a black background degraded by 50%. Again, this subtest was divided into two 30-item tasks:
550 (a) one task presented white silhouettes (Figure 3d)
and (b) the other presented white outline drawings (Figure 3e). These two tasks were administered in a counterbalanced order across participants. The image degradation was either in the middle of the drawing
555 (for the easiest items), at the intersections, or on the
prototypical parts. Each task started with 10 items degraded on the prototypical part, followed by the 10 items degraded at the intersections, and then the 10 items with the degradation in the middle.
560 White figures
This subtest assessed visual closure abilities on geo-metrical shapes. Children were presented with 10 simple white geometric figures surrounded by black shapes suggestive of the white figure’s edges, as a variation of
565
the Kanisza (1979) figures. This subtest included two tasks administered in the following order: a naming task in which participants had to name the white shape and a matching task in which they had to select one of three shapes that corresponded to the target (Figure 3f).
570 Visual perceptual processing: Late analysis
Three subtests inspired from the BORB (Humphreys & Riddoch, 1993) were included to assess late analysis, namely object constancy, object decision, and object completion. These subtests examined the children’s
575
ability to form a view-independent perception of the object.
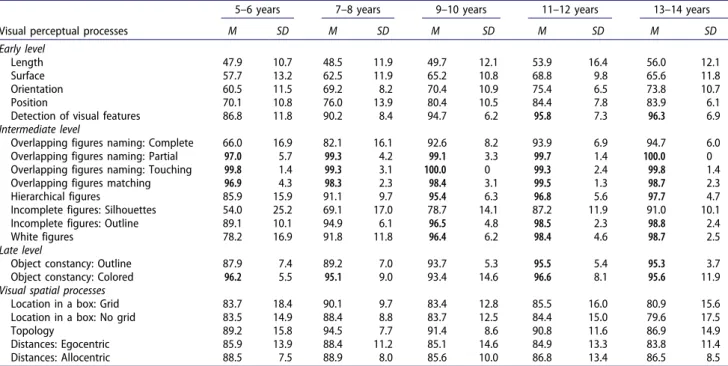
Object constancy
Object constancy is a matching task designed to assess the visual recognition of objects presented from an
580
unconventional perspective. This subtest was divided into two distinct tasks: one with black outline drawings on a white background (Figure 4a) and the other one with colored drawings. The two tasks were administered in a counterbalanced order across participants. Children
585
were asked to select one of three possibilities that matched the target object presented from a different perspective. Correct answers represented the target object from nine possible perspectives (rotation of 45°, 90°, 135°, 180°, 225°, 270°, and 315° on the horizontal
Figure 4. Examples of items found in the subtests for the late processing stage. (a) Object constancy, (b) Object decision, and (c) Object completion.
590 plane, and two vertical views from above and below).
The distractors presented objects with a similar overall shape to the target. For each task, three items were pre-sented for each rotation or view, with a total of 54 items.
Object decision
595 Object decision is a subtest designed to evaluate the
access to the 3D-structural representation of the object based on known, physical characteristics. Children were presented with a series of black outline drawings pre-sented on a white background and were asked to decide
600 whether the presented object was real or not (Figure 4b).
A total of 32 items were presented in random order, with 16 items with living objects (e.g., owl, dog) and 16 with nonliving objects (e.g., trousers, chair). In each category, half of the items were real objects presented
605 from a prototypical perspective, while the other half
were nonreal objects created by assembling the parts of real objects.
Object completion
Object completion is a matching task assessing the
610 ability to access the structural description of the object
on the basis of its local parts. Children were presented with parts of an object and had to choose the missing parts of the target object from among three possibilities (Figure 4c). The subtest included 10 items with living
615 objects (e.g., owl, dog) and 10 items with nonliving
objects (e.g., trousers, chair) presented in random order, with a total of 20 items. The distractors consisted of parts of real objects presenting a similar global shape to the correct response.
620 Visual spatial processing
Visual spatial processing was assessed in a series of three matching tasks, namely location in a box, topology, and evaluation of distances, which were designed to examine how children process spatial relationships.
625 Location in a box
Location in a box is a matching task designed to test the ability to determine the position of elements in an over-all configuration. It was inspired by the block matching task of the L94 battery (Stiers et al., 2001). This subtest
630
was divided into two distinct tasks: one had a grid within the frame and the other only a frame; both tasks included one, two, or three red squares. The two tasks were administered in a counterbalanced order across participants. Children were asked to select one of three
635
possible frames with red squares located in the same position as the target (Figure 5a). Among the three pro-posals, one was identical to the target, one presented the red squares in the same arrangement but in another position within the frame (displacement error), and
640
one presented the red squares in a different arrange-ment with one square displaced to another position within the frame (distortion error). The size of the frame and the number of red squares were manipulated to create items of increasing difficulty presented in the
645
following order: 16-cell frame (four items with one square and four items with two squares), 25-cell frame (10 items with two squares), 36-cell frame (10 items with two squares and 10 items with three), and 49-cell frame (10 items with two squares and 10 items with
650
three), with 58 items per task for a total of 116 items.
Figure 5. Examples of items found in the subtests for visual spatial analysis. (a) Location in a box, (b) Topology, and (c) Evaluation of distances.
Topology
Inspired by the DTVP II spatial relation test (Hammil, Pearson, & Voress, 1993), this subtest assessed the abil-ity to discriminate topographical relationships between
655 different interrelated elements. Children were presented
with a square matrix in a regular arrangement of 9, 12, 16, 25, or 36 black dots. Within this arrangement, some of the dots (3 to 10 dots) were connected to each other by lines that formed a path (Figure 5b). Children were
660 asked to select the same arrangement as the target from
among three possibilities (i.e., the same path located in the same position). Among the three proposals, one was identical to the target, one presented the interconnected dots in the same arrangement but in another position
665 within the matrix (displacement error), and one
pre-sented the interconnected dots in a different arrange-ment in which one dot was displaced by one position (distortion error). The size of the matrix and the num-ber of interconnected dots were manipulated to create
670 items of increasing difficulty administered in the
follow-ing order: 9-dot matrix (four items with three intercon-nected dots), 12-dot matrix (four items with four interconnected dots), 16-dot matrix (four items with five interconnected dots followed by four items with
675 six interconnected dots), 25-dot matrix (four items
with seven interconnected dots followed by four items with eight interconnected dots), and 36-dots matrix (four items with nine interconnected dots followed by four items with ten interconnected dots), for a total of
680 32 items in the subtest. Evaluation of distances
This subtest assessed the judgment of relative dis-tances between elements in the child’s environment and in a visual scene. Children were presented with
685 photographs of Playmobil figures (men, women,
chil-dren, animals, and everyday objects) that depicted a daily life scene (Figure 5c). The subtest was divided into two distinct tasks requiring the child to assess the distance using an egocentric or allocentric cue.
690 These two tasks were administered in a
counterba-lanced order across participants. In the estimation of egocentric distance, the child had to choose the character closest to him from among three possible answers. In the evaluation of allocentric distance, the
695 child had to identify the closest character to a target
object. A distance of 3, 4, 5, 7, and 10 cm separated the characters from one another. The items were pre-sented in an increasing order of difficulty, with items with larger distances being presented first (random
700 presentation within each distance). For each task of
the subtest, there were six items per distance, with a total of 60 items.
Control subtests
Two additional subtests were administered as a control
705
task to measure the children’s speed processing and naming abilities.
Reaction time
The reaction time subtest is a matching task used to measure the general processing speed required to
710
provide a manual motor response using the switches, the matching skills, and to measure visual-attention abilities. These individual motor response latencies were used to control for inter-individual differences in gen-eral processing speed in the matching tasks. Children
715
were presented with 24 colored geometric shapes (e.g., circle, arrow, rectangle, and cross) and were asked to select the identical stimuli from among three possibili-ties. The distractors were highly distinguishable from the targets as they differed in shape, size, and color to
720
minimize perceptual processing. As in the other match-ing tasks of the battery, stimuli were left in full view with no time limit.
Picture naming
In the picture-naming task, children were asked to
725
name 45 black outline drawings of objects and animals presented in the battery. This was implemented to ensure that the children knew the names of the pictures used in the different subtests without any additional perceptual processing requirements.
730 Procedure
Children were tested individually in a quiet room. The administration of subtests was distributed over three to five sessions of 45 minutes maximum depending on the child’s attention. The order of the subtests was
735
counterbalanced across children with the exception of the two control subtests: reaction times was the first subtest administered to allow the children to become familiarized with the equipment, while picture naming was the final subtest. Each subtest started with two
prac-740
tice trials that presented the easiest items to ensure that children understood the instructions and requirements of the task. No feedback was provided during the test. Children answered in an autonomous manner, with the examiner only intervening in the case of technical
745
problems or to recall the instructions if needed. Results
All computations were performed using Statistica 13 software (StatSoft France). Accuracy data did not fit a
normal distribution; as a result, percentages (P) of
750 correct responses were subjected to a natural logarithm
transformation using the formula LN [P/(100–P)]. Despite this transformation, our data did not follow a normal distribution. Accordingly, data were analyzed using non parametric statistics each time when it was
755 appropriate.
First, the selection of the most appropriate tasks is performed by removing any that were considered too easy (ceiling effect analyses) or redundant (correlation analyses). Children were considered to perform at
ceil-760 ings in tasks where they reached at least 95% of correct
responses from the younger age groups. Percentages of correct responses of TD children in the 15 subtests of the battery are presented in Table 4.
Second, internal consistency was examined in each of
765 the 12 remaining subtests using the Cronbach a coefficient
to assess subtest reliability of the underlying processes. Third, the theoretical validity of the battery was examined by exploring the latent factorial structure of the different subtests. It was analyzed using exploratory
770 factor analysis with normal Varimax rotation, which
represents the best choice for our type of data because it maximizes the variance on the factors and provides a clear structure of the factor weights. This analysis aimed to determine whether the latent structure reflect
775 the different processing levels of the Humphreys and
Riddoch’s (1987a) model, and how the different subtests co-vary with the underlying latent factors.
Fourth, correlation analyses were performed to examine a possible correlation between the scores
780
obtained on the Visual Perception subtest of the Beery-VMI (VP; Beery, Buktenica, & Beery, 2010) and the scores obtained on each of our subtests. This VP subtest allows the assessment of visual-perceptual matching abilities, and only requires identifying each
785
item’s identical match from a set of similar shapes with limited task motor requirements. Based on factorial analysis, a global score of performances for each of the three factors was computed. Correlation analyses were also performed to determine a possible correlation
790
between the scores obtained on the VP and these global scores.
Lastly, nonparametric Kruskal-Wallis tests (with a significance level of 5%) were separately conducted for each factor on percentages of correct responses to assess
795
the effect of Age (5–6, 7–8, 9–10, 11–12, 13–14). When statistically differences were detected, separate nonpara-metric Mann-Whitney with Bonferroni adjustments for multiple comparisons (with a significance level of 5%) were performed to determine performances differences
800
between age groups.
Task sensitivity
As depicted in Table 4, results showed the presence of a ceiling effect on the colored drawings task of the object constancy subtest and on some parts of the overlapping Table 4. Descriptive statistics: Mean percentage of correct responses and standard deviation for each subtest according to the five age groups.
Visual perceptual processes
5–6 years 7–8 years 9–10 years 11–12 years 13–14 years
M SD M SD M SD M SD M SD Early level Length 47.9 10.7 48.5 11.9 49.7 12.1 53.9 16.4 56.0 12.1 Surface 57.7 13.2 62.5 11.9 65.2 10.8 68.8 9.8 65.6 11.8 Orientation 60.5 11.5 69.2 8.2 70.4 10.9 75.4 6.5 73.8 10.7 Position 70.1 10.8 76.0 13.9 80.4 10.5 84.4 7.8 83.9 6.1 Detection of visual features 86.8 11.8 90.2 8.4 94.7 6.2 95.8 7.3 96.3 6.9 Intermediate level
Overlapping figures naming: Complete 66.0 16.9 82.1 16.1 92.6 8.2 93.9 6.9 94.7 6.0 Overlapping figures naming: Partial 97.0 5.7 99.3 4.2 99.1 3.3 99.7 1.4 100.0 0 Overlapping figures naming: Touching 99.8 1.4 99.3 3.1 100.0 0 99.3 2.4 99.8 1.4 Overlapping figures matching 96.9 4.3 98.3 2.3 98.4 3.1 99.5 1.3 98.7 2.3 Hierarchical figures 85.9 15.9 91.1 9.7 95.4 6.3 96.8 5.6 97.7 4.7 Incomplete figures: Silhouettes 54.0 25.2 69.1 17.0 78.7 14.1 87.2 11.9 91.0 10.1 Incomplete figures: Outline 89.1 10.1 94.9 6.1 96.5 4.8 98.5 2.3 98.8 2.4 White figures 78.2 16.9 91.8 11.8 96.4 6.2 98.4 4.6 98.7 2.5 Late level
Object constancy: Outline 87.9 7.4 89.2 7.0 93.7 5.3 95.5 5.4 95.3 3.7 Object constancy: Colored 96.2 5.5 95.1 9.0 93.4 14.6 96.6 8.1 95.6 11.9 Visual spatial processes
Location in a box: Grid 83.7 18.4 90.1 9.7 83.4 12.8 85.5 16.0 80.9 15.6 Location in a box: No grid 83.5 14.9 88.4 8.8 83.7 12.5 84.4 15.0 79.6 17.5 Topology 89.2 15.8 94.5 7.7 91.4 8.6 90.8 11.6 86.9 14.9 Distances: Egocentric 85.9 13.9 88.4 11.2 85.1 14.6 84.9 13.3 83.8 11.4 Distances: Allocentric 88.5 7.5 88.9 8.0 85.6 10.0 86.8 13.4 86.5 8.5 Note. All scores are significantly higher than chance (ps < .05), set at 33% because of the three response possibilities in each matching task. Bold numbers
805 figures subtest (i.e., matching task; partially overlapping
and touching items of the naming task). The detection of visual features subtest proved to be time-consuming to administer and unattractive for children, as they had difficulty maintaining their attention and
complet-810 ing this task (e.g., they frequently said that it was too
long or it was not fun). Subsequently, these different tasks were removed from the battery.
Correlation analyses were used to examine whether some tasks were redundant. These analyses revealed
815 significant positive correlations between the white
silhouette drawing and outline drawing tasks in the incomplete figure subtest (r à 0.52; p < .001) and between the white silhouette drawing task of the incomplete figures subtest and the white figures subtest
820 (r à .56; p < .001). Indeed, these tasks assessed the same
processing (i.e., visual closure). Subsequently, the easiest correlated tasks were systematically removed as they proved to be less discriminating (i.e., outline drawing task of the incomplete figure subtest and the white
825 figure subtest). The more difficult silhouette drawing
task of the incomplete figures subtest was retained, as children’s performances did not reach the ceiling level. Correlation analysis also revealed significant positive correlations between the location in a box and topology
830 subtests (r à 0.75; p < .001). As these two subtests
assessed the same processing (i.e., spatial localization), the easiest subtest (i.e., topology) was removed.
Internal consistency
The majority of subtests reached coefficients exceeding
835 .80 (Table 5). These high reliability indexes suggest that
the subtests are a reliable measure of the underlying processes with highly correlated items. Slightly lower
reliability was observed in the length, surface, and over-lapping figures (naming task) subtests, with coefficients
840
ranging between .70 and .80, which are acceptable coef-ficients of internal consistency. No coefficient could be calculated for the object decision subtest, because it presented a near zero variance. For the object com-pletion subtest, the coefficient of internal consistency
845
reached only .59, which represents a low reliability measure. Such a low coefficient might indicate that the subtest items measure different latent variables, resulting in a lower correlation between items.
Theoretical validity
850
Exploratory factor analysis conducted on the remaining 12 subtests with developmental data yielded three factors that explained 56.78% of the model’s variance. The output factors did not reflect the structure
proposed in Humphreys and Riddoch’s model. Q7
855
As shown in Table 6, the four subtests of early analy-sis (length, surface, position, and orientation) loaded on Factor 1 (early analysis), which captured 16% of the variance. Factor 2 (intermediate and late analyses) explained 21.62% of the variance and regrouped six
860
subtests, which respectively assess the ability to form a view-dependent and -independent representation of the object, and to access to the structural representation of the object: the three subtests in the intermediate analysis, namely, hierarchical figures, overlapping
865
figures (completely overlapping items of the naming task), and incomplete figures (white silhouette drawing task), and the three subtests in the late analysis, namely
Table 5. Coefficients of internal consistency (Cronbach alphas) for each subtest.
Visual perceptual processes a Cronbach coefficients Early level Length .73 Surface .74 Orientation .80 Position .85 Intermediate level
Overlapping figures naming: Complete .79 Hierarchical figures .92 Incomplete figures: Silhouettes .93 Late level
Object constancy: Outline drawings .82
Object decision /
Object completion .59
Visual spatial processes
Location in a box: Grid .93 Location in a box: No grid .92 Distances: Egocentric .85 Distances: Allocentric .81
Table 6. Factor loadings for exploratory factor analysis of BEVPS subtests. Factor 1 (Early analysis) Factor 2 (Intermediate and late analyses) Factor 3 (Spatial analysis) Length .76 .04 .03 Surface .73 .30 .01 Orientation .71 .34 .00 Position .51 .40 .08 Hierarchical figures .05 .76 .06 Object constancy: Outline drawings .17 .74 .03 Overlapping figures naming: Complete .27 .72 .00 Incomplete figures: Silhouettes .34 .66 .04 Object completion .28 .54 .14 Object decision .11 .50 .13 Location in a box: Grid .08 .09 .90
Location in a box: No grid .11 .07 .87
Distances: Egocentric .01 .02 .80
Distances: Allocentric .18 .05 .65
Note. Factor loadings >.50 are in boldface. We applied a normal varimax rotation to raw data to maximize the variance on the factors and obtain a clear structure of the factor weights.
object constancy (outline drawing task), object com-pletion, and object decision subtests. Finally, the two
870 subtests assessing basic spatial dimensions of visual
per-ception, namely location in a box (with and without grid tasks) and evaluation of distances (egocentric and allocentric tasks), loaded on Factor 3 (spatial analysis), which explains 19.16% of the variance.
875 Convergent validity
Table 7 shows the significant positive correlations between the VP and the tasks assessing visual perceptual
processing, except for the object decision subtest (r à .21, p > .05). Subtests assessing basic visual spatial
880
processing did not show any significant correlations with the VP. Table 7 also shows the significant positive correlations between Factor 1 and VP scores (r à .52, p < .05), and between Factor 2 and VP scores (r à .57, p < .05), but no significant correlation between Factor
885
3 and VP scores (r à .04, p > .05).
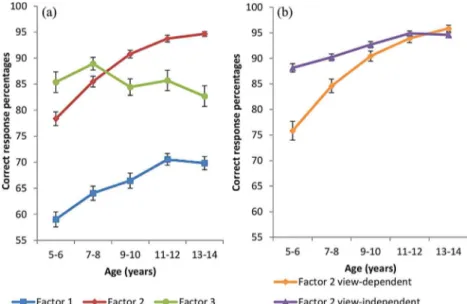
Developmental trajectories
As shown in Figure 6, nonparametric Kruskal-Wallis tests (with a significance level of 5%) were separately conducted for each factor on percentages of correct
890
responses, and revealed that Factors 1 and 2 showed a significant increase in performance across ages (5–6, 7–8, 9–10, 11–12, 13–14), H(4) à 37.63; p < .001, and H(4) à 100.59; p < .001, respectively. Factor 3 did not show any significant increase in performance across
895
age, H(4) à 6.31; p > .05. More specifically, in Factor 2, the effect of age was computed separately for the subtests loading to intermediate and late levels of analy-sis, to compare their two developmental curves, and to be sure that no great age discrepancy was present
900
between the construction of view-dependent and -independent object representation, which are clearly separate in adult literature. These two levels showed a significant increase in performance with age, H(4) à 88.16; p < .001, and H(4) à 66.53; p < .001, respectively.
905
Factor 1 showed a significant improvement in the performances of children aged between 5–6 and 9–10 years, 11–12 years, 13–14 years (ps < .001), and between 7–8 and 11–12 years (p < .002), 13–14 years Table 7. Coefficients of correlations between the VP subtest of
the Beery-VMI and our different subtests and factors.
Visual perceptual processes Visual perception subtest Beery-VMI Early level Factor 1 .52 Length .32 Surface .41 Orientation .46 Position .40 Intermediate level Factor 2 .57
Overlapping figures naming: Complete .45 Hierarchical figures .37 Incomplete figures: Silhouettes .46 Late level
Object constancy: Outline drawings .43
Object decision .21 ns
Object completion .40
Visual spatial processes
Factor 3 .04 ns
Location in a box: Grid .00 ns Location in a box: No grid .06 ns Distances: Egocentric .04 ns Distances: Allocentric .02 ns Note. ns means that the coefficient of correlation is not significant at a 95%
confidence level.
Figure 6. Correct response percentages presented by (a) factor and (b) view type in factor 2 Note. Error bars represent standard error of the mean.