P a g e 1
N
O
.10
M
INIMUM
W
AGE
,
I
NCOME
D
ISTRIBUTION AND
P
OVERTY
IN
B
RAZIL
April 2016
João Saboia
, UFRJ, Universidade Federal do Rio de Janeiro; [email protected].
For several years, the Brazilian minimum wage has been going through an
intense process of growth. Different authors have argued that an important part
of the improvement in income distribution can be attributed to increased
minimum wage in the recent past. Using income elasticities with respect to
minimum wage, we seek to estimate the effects of current minimum wage
adjustment policy on improving income distribution. The results of simulations
show that the minimum wage contributed greatly in recent years through the
labour market as well as through pensions and other official income transfers.
Since the 2000s, the minimum wage in Brazil has been going through an intense process of growth. Although no well-defined rule for its periodical adjustment existed until recently, the political and economic situation of the country favoured the granting of real increases. The result is that the minimum wage grew by 74% in real terms between 2003 and 2013. Currently the minimum wage receives each year the correction of inflation by the national index of consumer prices, as well as a real increase according to the Gross Domestic Product (GDP) growth rate recorded two years earlier. This rule was created in 2011 through Law 12/382, it was renewed in 2015 and should remain valid until 2019. Brazil is known for its great social inequalities that are reflected in the unequal distribution of income and wealth. Since the 2000’s, however, the main income distribution indicators experienced a
P a g e 2
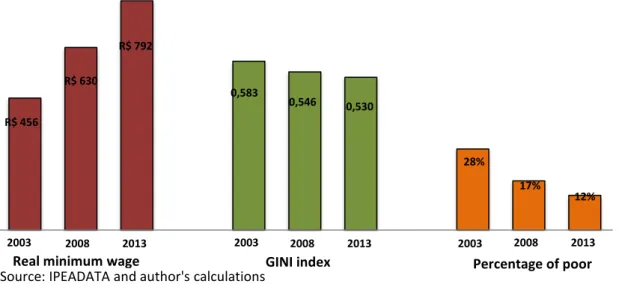
great improvement. The Gini index1 of the household per capita income distribution, for example, fell from 0.583 in 2003 to 0.527 in 2013. Similarly, poverty rates also fell sharply. The proportion of poor households was reduced from 28% to 12% over the same period. Figure 1 illustrates these results. The role of minimum wage in Brazil is not limited to the labour market, in that it also represents the floor of the benefits of the official social security system. Therefore, its potential for improving income distribution and reducing poverty is very large. However, we concentrate the discussion here on the role of the minimum wage to reduce income inequalities.
Figure 1 - Minimum Wage (R$ of 2013), Gini Index and Poverty Rate - 2003/2008/2013
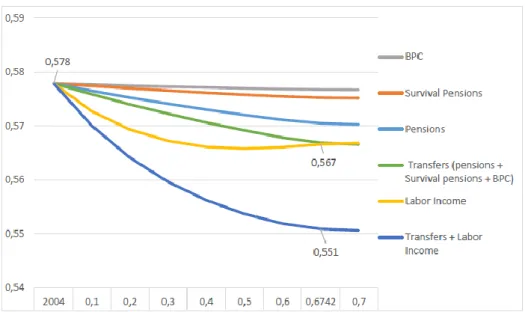
Using the observed effect of the minimum wage growth on various sources of income, it was possible to estimate its effect on the improvement of income distribution. We considered both the labour income and the social transfers (pensions, survivor pensions and the continuous cash benefit2). Figure 2 shows the estimated reduction on Gini index according to the growth rate of the minimum wage. It is clear from Figure 2 that when the minimum wage increases, the Gini index tends to fall. Note, however, that the intensity of the fall is reduced when considering higher rates of minimum wage growth. While, in 2004, the Gini index was 0.578, the simulations show that, with the increase of 67.4% (the effective growth rate for the minimum wage in the period), the index would drop to 0.551. In fact, the Gini index in 2013 was 0.530. Therefore, the increase in the minimum wage would have been responsible for 56% of the decline in income inequality measured by the Gini index.
It is confirmed that pensions and labour income have a high potential to contribute to the reduction of income inequalities. As a whole, transfers (pensions, survivor pensions and continuous cash benefit) would be responsible for reducing the Gini index to 0.567, same value found for the reduction obtained with labour income. In other words, transfers and labour income would be responsible each for about half of the simulated reduction in the Gini index in the period.
1
Gini index varies from zero to one. The lower is its value the best is the income distribution. 2
Benefício de Prestação Continuada (BPC).
2003 2008 2013 2003 2008 2013 2003 2008 2013
Real minimum wage GINI index Percentage of poor Source: IPEADATA and author's calculations
R$ 456 R$ 630 R$ 792 0,583 0,546 0,530 28% 17% 12%
P a g e 3
Figure 2 - Simulation of the Gini index of per capita household income distribution from 2004 according to the real growth rate of minimum wage
The policy of minimum wage has provoked many discussions among economists and other specialists in Brazil. There is a general recognition that it has played an important role in improving income distribution, but some authors place more emphasis on targeted programs of income transfers, such as the Bolsa Família Program, whose effect on poverty reduction is unquestionable. In general, such criticisms are related to the fact that people who receive the minimum wage in the labour market or as a pensioner are not the poorest ones and that the minimum wage increase has an unfavourable effect on public accounts. Brazil was able to implement the policy to increase the minimum wage in the last years because its real value had suffered great losses in the past due to the high inflation rates before the implementation of the Real Plan (Plano Real) to combat inflation in 1994. Thus, there was some economic space for its growth. Therefore, part of its increase in recent years is just the recovery of past losses. At the same time, its growth contributed to increase the purchase power of the population helping to boost GDP from the demand side of the economy.
Any policy of increase of the minimum wage must take into account the level of labour productivity in the various sectors and regions of the country. Therefore, it has to be complemented with measures to increase productivity so that legislation can be respected and there are neither inflationary pressure nor increase in informality in the labour market.
Policy Recommendations
• The minimum wage growth has a great potential to improve income distribution. Thus, a policy to increase the minimum wage can both benefit income distribution and poverty conditions;
• To achieve better results in terms of combating poverty, the minimum wage policy should be complemented with targeted income transfer programs such as Brazilian Bolsa Família; • A minimum wage policy should take into consideration both the level of labour productivity
as well as its growth rate in the country. Better economic and social results will be obtained if measures to increase labour productivity are taken simultaneously.
P a g e 4
The main objective of the research was to estimate the contribution of the minimum wage to improve income distribution in Brazil. The methodology is based on the economic concept of elasticity, which is a measure that links two increase rates, in our case, the growth rate of labour income divided by the minimum wage growth rate. In other words, it estimates the percentage of the minimum wage growth that is transferred to different labour incomes in the formal and informal sectors. For the social transfers, it was considered its floor, which is equal to one minimum wage in the case of pensions, survival pensions and continuous cash benefit. Thus, when the minimum wage increases, the value for these transfers follows the new value of the minimum wage.
Income inequality was measured through the classic Gini index for the per capita household income. The data source utilized for the income distribution is the National Household Survey - Pesquisa Nacional por Amostra de Domicílios (PNAD) of the Instituto Brasileiro de Geografia e Estatística (IBGE).3
Saboia, J. and Hallak, J, Minimum Wage and Income Distribution in Brazil from the 2000s, Nopoor Working Paper No.72, 2016. URL: http://bit.ly/1Ok5pZJ
Lavinas, L., 21st Century Welfare, New Left Review, n. 84, November/December 2013.
3 For more details of the methodology and results see Saboia, J. and Hallak, J, Minimum
Wage and Income Distribution in Brazil from the 2000s, Nopoor paper, 2015. RESEARCH PARAMETERS
P a g e 5
PROJECT NAME NOPOOR – Enhancing Knowledge for Renewed Policies against Poverty
COORDINATOR Institut de Recherche pour le Développement, Paris, France
CONSORTIUM CDD The Ghana Center for Democratic Development – Accra, Ghana
CDE Centre for Development Economics – Delhi, India
CNRS (India Unit) Centre de Sciences Humaines – New Delhi, India
CRES Consortium pour la Recherche Èconomique et Sociale – Dakar, Senegal GIGA German Institute of Global and Area Studies – Hamburg, Germany GRADE Grupo de Análisis para el Desarrollo – Lima, Peru
IfW Kiel Institute for the World Economy – Kiel, Germany IRD Institut de Recherche pour le Développement – Paris, France
ITESM Instituto Tecnológico y de Estudios Superiores de Monterrey – Monterrey, Mexico LISER Luxemburg Institute of Socio-Economic Research – Esch-sur-Alzette, Luxemburg OIKODROM - The Vienna Institute for Urban Sustainability – Vienna, Austria
UA-CEE Université d’Antananarivo – Antananarivo, Madagascar UAM Universidad Autónoma de Madrid – Madrid, Spain UCHILE Universidad de Chile – Santiago de Chile, Chile
UCT–SALDRU University of Cape Town – Cape Town, South Africa UFRJ Universidade Federal do Rio de Janeiro – Rio de Janeiro, Brazil UNAMUR Université de Namur – Namur, Belgium
UOXF-CSAE University of Oxford, Centre for the Study of African Economies – Oxford, United Kingdom
VASS Vietnamese Academy of Social Sciences – Hanoi, Vietnam
FUNDING SCHEME FP7 Framework Programme for Research of the European Union –SSH.2011.4.1-1:
Tackling poverty in a development context, Collaborative project/Specific International Cooperation Action. Grant Agreement No. 290752
DURATION April 2012 – September 2017 (66 months)
BUDGET EU contribution: 8 000 000 €
WEBSITE http://www.nopoor.eu/
FOR MORE
INFORMATION Xavier Oudin, Scientific coordinator, IRD-DIAL, Paris, France, Delia Visan, Manager, IRD-DIAL, Paris, France [email protected] [email protected]
Tel: +33 1 53 24 14 66 Contact email address: [email protected]
EDITORIAL TEAM
Edgar Aragon, Laura Valadez (ITESM) Heidi Dumreicher (OIKODROM)
Anne-Sophie Robilliard (IRD-DIAL), Hélène Lenoble (Paris-Dauphine-DIAL)
The views expressed in this paper are those of the authors and do not necessarily represent the views of the European Commission.