R E V I E W A R T I C L E
Surface
‐assisted laser desorption/ionization mass
spectrometry imaging: A review
Wendy H. Müller
|
Alexandre Verdin
|
Edwin De Pauw
|
Cedric Malherbe
|
Gauthier Eppe
Mass Spectrometry Laboratory, MolSys Research Unit, Chemistry Department, University of Liège, Liège, Belgium Correspondence
Gauthier Eppe, Mass Spectrometry Laboratory, MolSys Research Unit, Chemistry Department, University of Liège, Allée du Six Août, 11—Quartier Agora, B‐4000 Liège, Belgium. Email:[email protected]
Abstract
In the last decades, surface‐assisted laser desorption/ionization mass spectro-metry (SALDI‐MS) has attracted increasing interest due to its unique capabilities, achievable through the nanostructured substrates used to promote the analyte desorption/ionization. While the most widely recognized asset of SALDI‐MS is the untargeted analysis of small molecules, this technique also offers the possi-bility of targeted approaches. In particular, the implementation of SALDI‐MS imaging (SALDI‐MSI), which is the focus of this review, opens up new oppor-tunities. After a brief discussion of the nomenclature and the fundamental me-chanisms associated with this technique, which are still highly controversial, the
Mass Spec Rev. 2020;1–48. wileyonlinelibrary.com/journal/mas | 1
This is an open access article under the terms of the Creative Commons Attribution License, which permits use, distribution and reproduction in any medium, provided the original work is properly cited.
© 2020 The Authors. Mass Spectrometry Reviews Published by Wiley Periodicals LLC
Acronyms: 9‐AA, 9‐aminoacridine; AgLDI, silver‐assisted laser desorption/ionization; AgNPET, silver nanoparticle‐enhanced target; AMP, adenosine monophosphate; ATP, adenosine triphosphate; AuNPET, gold nanoparticle‐enhanced target; BP, benzylpyridinium; CALDI, cation‐ assisted laser desorption/ionization; Cer, ceramides; CHCA, apha‐cyano‐4‐hydroxycinnamic acid; CPA, cyclic phosphatidic acid; DAN,
1,5‐diaminonaphthalene; DESI, desorption electrospray ionization; DG, diglycerides; DHB, 2,5‐dihydroxybenzoic acid; DIOM, desorption ionization on mesoporous silicate; DIOS, desorption/ionization on silicon; DIUTHAME, desorption ionization using through‐hole alumina membrane; DNA, deoxyribonucleic acid; ESI, electrospray ionization; FA, fatty acid; FFPE, formalin fixed paraffin embedded; FLT, 3’‐deoxy‐3’‐fluorothymidine; FLT‐MP, FLT monophosphate; FT‐ICR, Fourier‐transform ion cyclotron resonance; GALDI, geomatrix‐assisted laser desorption/ionization; GALDI, gold‐assisted laser desorption/ionization; GALDI, graphene‐assisted laser desorption/ionization; GALDI, graphene oxide assisted laser desorption/ ionization; GALDI, graphite‐assisted laser desorption/ionization; GO, graphene oxide; GPCp, glycerophosphorylcholine phosphodiesterase; H&E, haematoxylin and eosin; IMP, inosine monophosphate; ITO, indium tin oxide; IUPAC, International Union of Pure and Applied Chemistry; LDI, laser desorption/ionization; LPE, lysophosphatidyl ethanolamine; MALDI, matrix‐assisted laser desorption/ionization; MCPA, 2‐methyl‐4‐ chlorophenoxyacetic acid; MELDI, material‐enhanced laser desorption/ionization; MELDI, matrix‐enhanced laser desorption/ionization; ME‐NIMS, matrix‐enhanced nanostructure initiator mass spectrometry; ME‐SALDI, matrix‐enhanced surface‐assisted laser desorption/ionization; Mf‐MELDI, matrix‐free material‐enhanced laser desorption/ionization; MILDI, matrix‐implanted laser desorption/ionization; MILDI, matrix implantation laser desorption/ionization; MS, mass spectrometry; MSI, mass spectrometry imaging; MUC1, Mucin1; NALDI, nano‐assisted laser desorption/ionization; NALDI, nanomaterial‐assisted laser desorption/ionization; NALDI, nanoparticle‐assisted laser desorption/ionization; NALDI, nanostructure‐assisted laser desorption/ionization; NALDI, nanowire‐assisted laser desorption/ionization; Nano‐PALDI, nanoparticle‐assisted laser desorption/ionization; NAPA‐LDI, nanopost array laser desorption/ionization; NIMS, nanostructure‐initiator mass spectrometry; NIMS, nanostructure imaging mass spectrometry; nPALDI, nanoparticle‐assisted laser desorption/ionization; NPs, nanoparticles; NPs‐ALDI, nanoparticle‐assisted laser desorption/ ionization; OCT, optimal cutting temperature; PA, phosphatidic acid; PC, phosphatidylcholine; PE, phosphatidylethanolamine; PHO‐S,
phosphoethanolamine; PI, phosphatidyl inositol; PS, phosphatidylserine; RNA, ribonucleic acid; SA, sinapinic acid; SALDI, surface‐assisted laser desorption/ionization; SELDI, surface‐enhanced laser desorption/ionization; SERS, surface‐enhanced Raman spectroscopy; SIMS, secondary ion mass spectrometry; SPALDI, silicon nanoparticle assisted laser desorption/ionization; SPALDI, silicon nanopowder assisted laser desorption/ ionization; SPILDI, silica plate imprinting laser desorption/ionization; SP‐LDI, silica plate laser desorption/ionization; ST, sulfatides; SY, survival yield; TK1, thymidine kinase; TLC, thin layer chromatography; TOF, time of flight; UV, ultraviolet; UV‐Vis, ultraviolet‐visible.
analytical strategies to perform SALDI‐MSI are extensively discussed. Emphasis is placed on the sample preparation but also on the selection of the nanosub-strate (in terms of chemical composition and morphology) as well as its func-tionalization possibilities for the selective analysis of specific compounds in targeted approaches. Subsequently, some selected applications of SALDI‐MSI in various fields (i.e., biomedical, biological, environmental, and forensic) are pre-sented. The strengths and the remaining limitations of SALDI‐MSI are finally summarized in the conclusion and some perspectives of this technique, which has a bright future, are proposed in this section.
K E Y W O R D S
desorption/ionization, imaging, mass spectrometry, nanomaterials, SALDI, small molecules
1
|
I N T R O D U C T I O N : A B R I E F
H I S T O R Y O F M A S S
S P E C T R O M E T R Y I M A G I N G
Mass spectrometry imaging (MSI) has brought a new valuable dimension in mass spectrometry (MS) data collection as, besides the detection and identification of various compounds provided by conventional MS, MSI additionally allows the visualization of the spatial loca-lization of the analytes in complex solid samples (Chughtai & Heeren,2010; McDonnell & Heeren,2007). To perform MSI analyses, the analytes have to keep a precise position in the solid sample. Several strategies can be followed to generate intact gas‐phase ions from molecules in the condensed phase (Amstalden van Hove et al., 2010; Bodzon‐Kulakowska & Suder, 2016; Chughtai & Heeren,2010; Tsai et al.,2015). Three main ionization sources are currently used in MSI. First, the sample can be bombarded by an incident beam of charged particles. This is the case in secondary ion mass spectrometry (SIMS), which involves the bombardment of the sample surface by an energetic “primary” ion or cluster beam, leading to the sputtering of secondary species from the surface (Benninghoven et al., 1987; Fearn,2015; Schaepe et al.,2020). Second, ionization can occur under ambient conditions (Chernetsova & Morlock, 2011; Perez et al.,2019; Wu et al.,2013; Xiao et al., 2020) through the interaction of charged micro-droplets of a solvent with the sample surface, in a tech-nique called desorption electrospray ionization (DESI) (Takats et al., 2004) or, more recently, nano‐DESI (Yin et al.,2019). A third technique consists in the irradiation of the sample by a laser in a technique called laser des-orption, developed about 50 years ago (Kupka et al., 1980; Posthumus et al., 1978; Vastola & Pirone,
1968). However, the high laser power required for the laser desorption of large molecules induced their
fragmentation due to an increase of their internal energy. It was not until the development of the matrix‐assisted laser desorption/ionization (MALDI) technique that in-tact biomolecules could be analyzed by laser desorption MS. MALDI involves a laser striking light‐absorbing molecules, called“matrices,” that (i) protect the analytes from direct laser irradiation, (ii) assist the desorption and ionization of the co‐crystallized analytes. In particular, MALDI‐MS Imaging (MALDI‐MSI), promoted by the pioneering works of Spengler (Spengler et al.,1994) and Caprioli (Caprioli et al.,1997), has become the MSI re-ference technique for the analysis of various high molecular weight biomolecules, opening up new oppor-tunities in the area of molecular biology (Gessel et al.,2014) but also in plant biology (Kaspar et al.,2011) and biomedicine (Schwamborn & Caprioli,2010). How-ever, MALDI‐MSI also suffers from limitations. First, the quality of the matrix deposit on the sample has a sig-nificant impact on the analytical performance of the MALDI‐MSI experiment. Indeed, the heterogeneity in the analyte‐matrix co‐crystallization is responsible for the formation of hot spots leading to a lack of reproducibility (both shot‐to‐shot and sample‐to‐sample reproducibility) (Goodwin,2012; Kaletas et al.,2009). Also, the integrity of the molecular spatial distributions may be affected by an inappropriate matrix application, which may in turn cause significant migration or delocalization of the mo-lecules of interest (Chaurand, 2012; Fournelle et al.,
2020; Römpp & Spengler,2013), affecting the spatial re-solution and/or leading to misinterpretation of the MSI results. Furthermore, the formation of matrix crystals larger than the laser spot size may also affect the spatial resolution (Kaletas et al., 2009; Phan et al., 2016). For example, DHB and CHCA matrix crystals sizes are usually comprised between 5 and 20 µm using spraying deposition (Phan et al., 2016). High spatial resolution MALDI‐MSI (Römpp & Spengler, 2013;
Römpp et al.,2010; Schober et al.,2012) (down to 1.4 µm) has however been recently achievable (on single cells and tissues) but through the implementation of a sophisti-cated experimental workflow including an optimized pneumatic‐spray matrix application and a newly devel-oped high‐resolution atmospheric‐pressure MALDI imaging source comprising a laser focusing objective to improve the laser focus diameter (Kompauer et al.,2017). The implementation of dry matrix applications, such as matrix sublimation, has also helped to increase the spa-tial resolution by providing a highly homogeneous matrix deposition with minimal lateral analyte diffusion and smaller crystal size (Gemperline et al., 2014; Hankin et al., 2007; Thomas et al., 2012). However, due to its solvent‐free nature, matrix sublimation may suffer from poor analyte extraction, decreasing the signal intensity (Phan et al.,2016). Then, when it comes to investigating the spatial distribution of small molecules (<700 Da), conventional MALDI‐MSI turns out to be challenging (Calvano et al.,2018; Kaletas et al.,2009). Indeed, upon laser irradiation, the analytes and the matrix simulta-neously desorb, ionize, and potentially fragment. The ionization and fragmentation of the matrix lead to high chemical background in the low m/z range (Van Kampen et al., 2011), usually hampering the detection of small molecules and metabolites (<700 Da) (He et al.,2019; Lu et al.,2017). Moreover, in MALDI‐MS, the ionization of the analytes by the organic matrices is usually char-acterized by a low efficiency and therefore, a large excess of the organic matrices (the typical matrix/analyte ratio is 5000:1 [Chaurand,2012]) is usually required to provide a satisfactory ionization yield of the analytes, which may in turn cause analyte‐ion suppression (Abdelhamid,2018). However, small molecules are of high significance in the biological field as they can play, for instance, an active role in biochemical processes such as the development of a disease or intercellular communica-tions. Consequently, the analysis of small molecules and metabolites by MS techniques has aroused interest over the last decades. The matrix‐related problems encountered in MALDI‐MSI have thus encouraged the search for adjusted approaches. Several alternatives were proposed involving the sample preparation (such as analyte/matrix derivatization, addition of dopants, or optimized matrix application), significant instru-mental improvements, and the development of novel organic matrices (Bergman et al.,2014; Calvano et al.,
2018; Trim & Snel,2016). To overcome the limitations inherent to the MALDI‐MSI technique, other LDI techniques employing solid nanosubstrates as assisting materials have also been developed over the last decades.
2
|
S A L D I‐MS: AN EMERGING
T E C H N I Q U E F O R T H E A N A L Y S I S
O F S M A L L M O L E C U L E S
2.1
|
What is SALDI?
In recent years, the emergence of a novel implementation of the LDI techniques, namely surface‐assisted laser desorption/ionization mass spectrometry (SALDI‐MS), fostered by the rapid development of nanomaterials, has created new prospects for the imaging of low molecular weight compounds (limited to 25 kDa with Pt nanosub-strates, e.g., Chiang et al.,2010), which are of particular interest, especially in the era of metabolomics and lipi-domics. In SALDI‐MS, the nanosubstrates, which can be colloidal nanoparticles, solid nanostructured platforms, or sputtered metal nanoclusters, are the key elements in the desorption/ionization process, by absorbing the laser energy, enabling a rapid and sharp increase in the sur-face temperature leading to the analytes desorption (Chen et al.,2011; Law & Larkin2011; Pilolli et al.,2012; Song & Cheng, 2020). Thus, while MALDI‐MS is parti-cularly suitable for the analysis of large molecules, SALDI‐MS, which benefits from the use of nanosub-strates instead of conventional organic matrices to assist the LDI process, offers significant advantages for the analysis of small molecules by greatly limiting the in-terference in the low m/z range. In this sense, SALDI‐MS represents a complementary technique to MALDI‐MS (Phan et al.,2016; Pomastowski & Buszewski,2019), and should not be seen as a competitive approach. The SALDI nanosubstrates have to meet the same specifica-tions as organic matrices: they must be able to absorb the energy of the laser radiation, to promote the analytes desorption and provide a source of ionization (Chen et al.,2011; Pilolli et al.,2012).
The first example applying nanostructured inorganic matrices in“laser ionization” MS was reported as early as 1988, when Tanaka et al. used ultrafine 30‐nm cobalt nanopowders mixed with a glycerol liquid matrix as a dispersant to successfully analyze peptides and intact large proteins (up to 20 kDa) (Tanaka et al., 1988). However, it was not until 1995 that the name “SALDI‐ MS” was proposed by Sunner et al. to emphasize the importance of the nanosubstrate in the laser desorption/ ionization mechanism (Sunner et al.,1995).
However, although it has greatly evolved since these original examples, SALDI‐MS has struggled to expand and is still not extensively employed compared with the established MALDI‐MS. This is due both to fundamental (see Section 2.3) and technical reasons (see Section 3), but also probably due to some unfamiliarity with this
technique. In particular, SALDI‐MS imaging (SALDI‐ MSI) has only emerged in the late 2000s in the literature, 10 years later than MALDI‐MSI and is still limited to a few dozen of papers. Nevertheless, the increase in pub-lications on SALDI‐MS over the last two decades, as shown in Figure 1, indicates a growing interest in this technique.
This surge of interest since the early 2000s is probably due as much to the boom in small molecules analyses as to the advent of nanotechnology, and in particular to the access of a wide range of nanomaterials. Indeed, many nanostructured substrates have been developed and employed for the analysis of small molecules by SALDI‐ MS (Dattelbaum & Iyer, 2006; Kuzema, 2011). These nanosubstrates have found useful applications in many research areas including biomedicine (Dufresne et al.,2017; Qiao & Liu, 2010), drug analysis (Peterson,
2007), environment (Lu et al., 2017), and forensics (Guinan et al., 2015; Lim et al., 2012). For instance, SALDI‐MS has already been used to detect bone bio-markers for osteoporosis risk assessment (Pan et al.,
2019), environmental pollutants from water samples (Moriwaki et al.,2018), and explosives and illicit drugs in latent fingermarks (Guinan et al., 2015; Rowell et al.,2012). However, in spite of the increased attention
to SALDI‐MS, the application of this technique in an imaging context is still in a latency phase, with less than 10 publications published per year in the literature, while MALDI‐MS imaging has been booming since the early 2000s, as also shown in Figure1.
Moreover, while there are already some reviews on SALDI‐MS, they are mainly focused on the nanosub-strates (Abdelhamid, 2019; Chu et al., 2018; Lin & Cai,2018; Mandal et al.,2019; Muthu et al.,2018; Shi & Deng, 2016), on the SALDI mechanisms (Picca et al.,2017; Song & Cheng,2020; Stolee et al.,2012) or on both (He et al., 2019; Iakab et al., 2019; Law & Larkin,
2011; Silina & Volmer,2013). To our knowledge, there is no review solely dedicated to SALDI‐MS imaging, in-cluding a discussion about the nanosubstrates and their use in imaging approaches. Therefore, in this review, emphasis will be placed on SALDI‐MS in the context of imaging analyses.
2.2
|
MALDI or not MALDI?
A discussion about SALDI
‐MS
nomenclature and acronyms
2.2.1
|
MALDI or not MALDI?
Tanaka and his colleagues can be considered as the “SALDI pioneers” and as a result of their research, Tanaka became a co‐laureate of the Nobel Prize in Chemistry in 2002 for "the development of soft deso-rption ionization methods for mass spectrometric ana-lyses of biological macromolecules.” However, in a bit of a leap, the Tanaka's work is commonly linked to the development of MALDI‐MS. We had to wait another 7 years before the "SALDI" acronym was proposed by Sunner et al. to emphasize that the use of active surfaces and structured nanomaterials as new LDI‐assisting ma-trices induces adaptation in the sample preparation (see Section3) and more importantly is associated with fun-damental changes in the desorption/ionization process in SALDI‐MS compared with MALDI‐MS (see Section2.3) (Sunner et al., 1995). These reasons justify the use of distinctive acronyms for MALDI and SALDI.
2.2.2
|
Are all acronyms necessary?
Unfortunately, since the first report of “SALDI‐MS” (in 1995) and its contemporary “DIOS” (for desorption ionization on silicon, which designates a SALDI variant triggered by porous silicon substrates) in 1999 (Wei et al., 1999), the nomenclature associated with this technique has never stopped expanding, leading to a
F I G U R E 1 Number of publications in the field of MALDI‐MSI, SALDI‐MS, and SALDI‐MSI. Used keywords in the abstract on Scopus:“MALDI AND Imaging” for MALDI‐MSI, the sum of articles with the following keywords“SALDI,” “DIOS,” and “Nano‐PALDI,” for SALDI‐MS and the sum of articles with the following keywords“SALDI AND Imaging,” “DIOS AND Imaging,” and “Nano‐PALDI AND Imaging,” for SALDI‐MSI [Color figure can be viewed atwileyonlinelibrary.com]
plethora of names and acronyms often linked to the nature of the nanosubstrate, employed both in the ima-ging context (see Table1) and in the general context of SALDI‐MS (see Table2). Hence, it is already very com-plicated to make a comprehensive state of the art on this technique and, as the use of SALDI‐MS is expected to
grow, in parallel with the fast development of improved nanosubstrates and novel LDI approaches, there is an underlying risk of facing an uncontrollable growth of new terms and acronyms in a near future that will make the understanding and reviewing of the SALDI‐MS technique increasingly difficult.
T A B L E 1 Names and acronyms given to different SALDI‐MS techniques in the context of SALDI‐MS imaging with references
Acronym Complete name References
No acronym MALDI‐MS with/using nanoparticles (or another nanosubstrate)
Guan et al. (2018); Jackson et al. (2014); Muller et al. (2015); Tang et al. (2011b); Zhou et al. (2017)
Mass spectrometry using nanoparticles Goto‐Inoue et al. (2010)
AgLDI Silver‐assisted LDI Baquer et al. (2020); Lauzon et al. (2015); Yang et al. (2020)
AuLDI – Fournelle et al. (2020)
DIOS Desorption/ionization on silicon Guinan et al. (2015b); Liu et al. (2007); Ronci et al. (2012); Rudd et al. (2015,2019)
DIUTHAME Desorption ionization using through‐hole alumina membrane
Kuwata et al. (2020)
GALDI Graphite‐assisted LDI Cha and Yeung (2007); Zhang et al. (2007)
LDI Laser desorption/ionization Dupré et al. (2012); Dufresne et al. (2013,2016); Hansen et al. (2019); Jun et al. (2010); McLaughlin et al. (2020); Misiorek et al. (2017); Niziol et al. (2019); Niziol and Ruman (2013b); Rafols et al. (2018); Schnapp et al. (2016); Sekula et al. (2015a); Tseng et al. (2017)
NALDI Nano‐assisted LDI Creran et al. (2012); Ronci et al. (2012); Tata et al. (2012, 2014);
Vidova et al. (2010)
Nanomaterial‐assisted LDI Kim et al. (2011); Qiao and Liu (2010)
Nanoparticle‐assisted LDI Huang et al. (2015)
Nanostructure‐assisted LDI Krasny et al. (2015); Skriba and Havlicek (2018)
Nano‐PALDI NanoParticle‐assisted LDI Ageta et al. (2009); Hayasaka et al. (2010); Shiono and Taira 2020); Shrivas et al. (2011); Taira et al. (2008)
NAPA‐LDI NanoPost array LDI Fincher et al. (2019a,2019b,2020a,2020b); Samarah and Vertes
(2020); Stopka and Vertes (2020); Stopka et al. (2016)
nPALDI nanoParticle‐assisted LDI Morosi et al. (2013)
NIMS Nanostructure‐initiator MS Calavia et al. (2012); Greving et al. (2011); Lee et al. (2012);
O'Brien et al. (2013); Palermo (2020); Palermo et al. (2018); Patti et al. (2010a,2010b); Yanes et al. (2009)
Nanostructure imaging MS Guinan et al. (2015); Palermo et al. (2018)
ME‐NIMS Matrix‐enhanced nanostructure initiator MS Moening et al. (2016)
ME‐SALDI Matrix‐enhanced surface‐assisted LDI Brown et al. (2015); Liu and He (2009); Liu et al. (2009)
MILDI Matrix implantation LDI Muller et al. (2017)
Pt‐SALDI Surface‐assisted laser desorption/ionization with sputter‐deposited platinum film
Ozawa et al. (2016)
SALDI Surface‐assisted LDI Chau et al. (2017); Cheng et al. (2016); Dutkiewicz et al. (2019);
Iakab et al. (2020); Lopez de Laorden et al. (2015); Müller et al. (2020); Niziol et al. (2016); Phan et al. (2016); Wang et al. (2020a, 2020b)
SPILDI Silica plate imprinting LDI De Oliveira et al. (2014)
Furthermore, the use of some acronyms is not al-ways appropriate. As a matter of fact, some acronyms refer to different techniques and do not have the same meaning, such as NALDI or GALDI. Some other techniques are referred to by several acronyms, such as nanoparticle‐assisted laser desorption/ionization. Again, the understanding of the literature could be affected by this ambiguity in terminology. This messy nomenclature is concerning and there is an urgent need to clarify the terminology and unify the field concepts and theories.
Certainly, some differences lie between all the SALDI sub‐categories such as the physicochemical properties of the nanosubstrate (linked to its nature and structure), the way in which the nanosubstrate is em-ployed, or whether or not other LDI assisting molecules are added to the sample. However, we believe that the differences between the above techniques are not suf-ficiently significant to warrant the creation and use of new terminologies. Therefore, we suggest the use of a generic appellation for all these techniques. In this context, common sense would dictate recommending the most widely and frequently accepted terms in the literature. In this context, the terms DIOS and SALDI seem to be the most employed. In addition, the IUPAC's
recommendations for the Definitions of Terms Relating to Mass Spectrometry (2013) (Murray et al.,2013) also support the use of DIOS and SALDI. The definitions provided by the IUPAC are:
DIOS (desorption ionization on silicon): Soft ionization alternative to matrix‐assisted des-orption/ionization involving laser desorption ionization of a sample deposited on a porous silicon surface.
SALDI (surface‐assisted laser desorption/io-nization): Class of matrix‐free laser desorption ionization techniques for biological macro-molecules. Note: an example is desorption io-nization on silicon (DIOS).
Nevertheless, the terms DIOS and SALDI seem to be redundant since DIOS is a particular case of SALDI, employing porous silicon as substrate. Thus, we would suggest the use of the term“SALDI” as a general des-ignation as (i) the term encompasses a very large number of sub‐techniques and (ii) it reminds us that the technique belongs to the wider group of LDI techniques.
T A B L E 2 Some other names of SALDI‐MS (not met in the imaging context) with references
Acronym Complete name References
No acronym Inorganic material‐assisted LDI Qiao and Liu (2010) Matrix‐less mass spectrometry Niziol and Ruman (2013a)
Matrix‐free LDI Niziol et al. (2013)
CALDI Cation‐assisted LDI Ha et al. (2008)
DIOM Desorption/ionization on
mesoporous silicate
Chang‐soo Lee et al. (2007)
GALDI Graphene‐assisted LDI Abdelhamid and Wu (2012)
Graphene oxide assisted LDI Abdelhamid and Wu (2015)
Gold‐assisted LDI Abdelhamid and Wu (2016)
Geomatrix‐assisted LDI Yan et al. (2007)
NALDI Nanowire‐assisted LDI Kang et al. (2005)
Nanostructure‐assisted LDI Wyatt et al. (2010)
NPs‐ALDI NanoParticle‐assisted LDI Abdelhamid (2018)
MELDI Material‐enhanced LDI Feuerstein et al. (2006); Rainer
et al. (2011) mf‐MELDI matrix‐free material‐enhanced LDI Qureshi et al. (2014)
MILDI Matrix‐implanted LDI Novikov et al. (2004); Tempez
et al. (2005) SPALDI Silicon nanoParticle assisted LDI Wen et al. (2007)
2.2.3
|
Is the IUPAC definition of SALDI
outdated?
Other issues now concern the SALDI definition proposed by the IUPAC, which no longer corresponds to the technique in the field of MS. First, there is some con-troversy over the so‐called “matrix‐free” methods, since there is in fact a matrix involved in SALDI. The unique difference is that these matrices are simply not conven-tional organic matrices as designed in MALDI‐MS but rather nanostructured substrates used to assist the LDI process. Second, SALDI‐MS has been employed to ana-lyze a wide variety of molecules, not just biological macromolecules. Third, SALDI is more commonly used for the analysis of small molecules rather than macro-molecules. We would therefore suggest to adapt the IUPAC's definition of SALDI, following for example the criteria already proposed by Law and Larkin in 2011 (Law & Larkin,2011) as well as recently exposed criteria, including the enhanced specificity and sensitivity of this technique (compared with MALDI‐MS) due to the high affinity of the nanosubstrate with specific analytes (see Section3.3).
2.3
|
SALDI
‐MS fundamental
mechanisms
The understanding of the fundamental mechanisms un-derlying the LDI processes remains the topic of a lively discussion in the scientific community. While the me-chanistic aspects of MALDI have gained sizeable knowledge over the past decades (see Dreisewerd, 2003; Jaskolla & Karas, 2011; Karas & Krüger, 2003; Knochenmuss,2006; Knochenmuss & Zenobi,2003; Lee et al., 2019; Niehaus & Soltwisch, 2018; Zenobi & Knochenmuss, 1998, for example), the study of the key principles of SALDI is still in a nascent state (Cheng & Ng,2020; Law & Larkin,2011; Picca et al.,2017; Song & Cheng, 2020; Stolee et al., 2012; Vertes, 2007) and re-presents one of the most controversial part of the SALDI research (Law & Larkin, 2011), hindering its develop-ment and applications (Zhu et al.,2020). The elucidation of the SALDI mechanistic aspects is far from easy be-cause many factors affect the analytical performance of the SALDI processes and the proper impact of each factor remains ambiguous (Picca et al., 2017). Some of these factors are related to the SALDI nanosubstrate, such as the surface morphology (Zhu et al., 2020) (e.g., shape, size, and porous nanostructure) and nature, which define its physicochemical properties (e.g., photoabsorption ef-ficiency, thermal conductivity, melting point) (Lai et al., 2016). Other parameters depend on the nature of
the analytes including their chemical properties and the interactions between the nanosubstrate and the analytes (Picca et al., 2017). Finally, some parameters fall into experimental operating parameters, such as the excita-tion laser irradiaexcita-tion parameters (e.g., irradiance, wave-length, number, wave-length, energy, and frequency of the pulses) and ionization mode (positive or negative) (Picca et al., 2017). The only point on which the scientific community comes to some sort of agreement is that the nanosubstrates play a major role in the desorption/ioni-zation mechanisms, by absorbing the laser energy, en-abling a rapid and sharp increase in the surface temperature, and that both thermal and non‐thermal processes may be involved in the overall SALDI‐MS process (Law & Larkin,2011; Song & Cheng,2020).
Different models have attempted to explain (at least partially) the SALDI mechanisms. These models have generally focused on one of the two distinct, but con-comitant, contributions of the SALDI process: the deso-rption or the ionization. On the one hand, desodeso-rption is thought to mainly occur via thermal processes including the rapid and highly localized heating of the nanosub-strate (see Section2.3.1), even if some other non‐thermal processes may also help the analyte desorption, such as surface restructuring or destruction (see Section 2.3.2). On the other hand, ionization has been presented as a non‐thermal process (see Section 2.3.2) but remains misunderstood as it can be promoted by various phe-nomena, including charge transfers, photo‐ionization reactions, or surface melting/destruction.
This section summarizes the main hypotheses pro-posed to explain the SALDI fundamental mechanisms. It is however impossible to take all the fine details pre-sented in the literature into account and this section will be restrained to a simplified explanation of the SALDI mechanistic aspects. Interested readers are therefore in-vited to consult the various references mentioned throughout this section.
2.3.1
|
Thermal processes promoting
analyte desorption
The SALDI desorption process has been widely re-cognized as a laser‐induced thermal‐driven phenomenon (Lai et al.,2016; Ng et al.,2015; Picca et al., 2017). This mechanism is based on the rapid heating of the nano-substrate, coupled with heat confinement effects (Picca et al., 2017), resulting from the interaction of a nanosecond‐pulsed laser with the nanostructure (Song & Cheng, 2020). Thus, upon laser irradiation, the local temperature around the nanosubstrate can be very high, high enough to desorb most kinds of analytes
(Ng et al., 2015). Nanosubstrates, characterized by a strong absorbance in the UV‐Vis region, a low heat ca-pacity, and a reduced thermal conductivity (related to their size, surface roughness, and electron thermal con-ductivity [Picca et al., 2017]), might therefore play an active role in this mechanism (Song & Cheng,2020). The local thermal density has to be high and it is essential that the nanosubstrate has a low thermal conductivity so that the “thermal spike” (Vineyard, 1976) does not dis-sipate too rapidly. Hence, an efficient energy transfer from the nanosubstrate to the analytes seems to induce efficient desorption (Song & Cheng, 2020) and signal enhancement in SALDI‐MS.
2.3.2
|
Non
‐thermal processes behind
analyte desorption and ionization
Non‐thermal processes are also generally proposed as possible mechanisms for desorption and ionization in SALDI‐MS. On the one hand, non‐thermal processes such as laser‐induced surface restructuring or destruc-tion are mendestruc-tioned as possible mechanisms for the des-orption process in SALDI‐MS (Song & Cheng,2020). On the other hand, the ionization in SALDI may also be driven by different non‐thermal processes. However, the ionization mechanism remains largely unclear as various pathways can promote ionization, such as the emission of hot electrons, the presence of pre‐existing ions in the sample, photoionization reactions between the solvent molecules (trapped in the nanostructure) and the ana-lytes, and proton or electron transfer between the surface and the analytes (Luo et al.,2005). The surface melting and destruction have also been suggested as potential parts of the SALDI ionization mechanisms. Indeed, ions and charged clusters originating from the substrates are often detected during a SALDI‐MS experiment (Song & Cheng,2020).
In particular, plasmonic nanomaterials (such as gold‐, silver‐, and platinum‐based nanoparticles) exhibit a high photochemical activity when they are irradiated by a UV‐Vis laser (Kamat et al., 1998), facilitating the conversion of light energy into chemical energy by gen-erating high‐energy electrons (called hot electrons [Li et al.,2018]) and paired with holes (Cheng & Ng,2020). The ionization process in SALDI‐MS has been mainly considered as the result of the ejection of hot electrons, which are the most likely source of initial charges in SALDI, and their subsequent transfer from the nanos-tructure to the adjacent molecules (Li et al., 2018). In-deed, upon nanosecond‐pulsed laser excitation, noble metal nanoclusters can become positively multiply‐ charged due to the release of a high quantity of electrons (Shoji et al.,2008). The nanoparticle then carries so many charges that it eventually become unstable, because the Coulomb repulsive forces between these charges exceed the cohesive forces operating inside the nanocluster. Coulomb explosion finally leads to the spontaneous fragmentation of the nanoparticle (Shoji et al.,2008), as shown in Figure 2, resulting in the ejection of quite a number of electrons (Werner & Hashimoto, 2011) and nanosubstrate ions.
However, the hot electrons are only one side of the coin. Indeed, recently, Cheng and Ng brought the “Hidden Heroes,” namely the holes generated si-multaneously with the hot electrons, out of the sha-dows (Cheng & Ng, 2020). They emphasized the importance of the contributions of the holes, usually disregarded, in a new“charge‐driven” desorption me-chanism. This mechanism involves positive hole‐ containing nanosubstrates formed via the hot‐electron transfer from the substrate to the conductive support (e.g., MALDI plate adapter). The holes reduce the in-teractions between the analyte ions and the nanosub-strate surface and achieve Coulomb repulsion between the positively charged nanosubstrate and the analyte
F I G U R E 2 Fragmentation of silver nanoparticle upon laser irradiation. The transient aggregate formed via the photoejection of electrons is considered as a precursor for complete fragmentation of the nanoparticle. Adapted with permission from Kamat et al. (1998). © 1998 American Chemical Society [Color figure can be viewed atwileyonlinelibrary.com]
ions, allowing their desorption in positive ioniza-tion mode.
In another approach, an analogy is made between SALDI ionization and laser ablation. Indeed, the surface melting/destruction occurring in SALDI through laser irradiation can be seen as a similar process to the laser ablation process if enough laser energy is absorbed by the nanosubstrate (Song & Cheng,2020). Without going into details not covered in this review (more information can be found in the work of [Song & Cheng, 2020]), laser ablation is a non‐thermal process generating a plasma, induced by laser irradiation of the sample surface, as shown in Figure 3. Surface melting, dissociation, vapor-ization, ionvapor-ization, and removal by the shock wave are all parts of the laser ablation process (Song & Cheng,2020). As shown in Figure3, the laser‐induced plasma contains a variety of species such as electrons, neutrals, excited neutrals and ions. Numerous gas‐phase collisions can occur among species inside the laser‐induced plasma due to the dense population of various energetic species. SALDI‐MS ionization process may therefore result from these collisions, which can also produce ions from ana-lytes in the gas phase (Song & Cheng,2020).
2.3.3
|
Exploring SALDI
‐MS processes
with
“thermometer ions”
The correlation between internal energy transfer and ion desorption efficiency is generally probed to explore the LDI processes (Picca et al., 2017). Internal energy trans-fer investigations have already contributed to the (par-tial) understanding of MALDI and ESI ionization sources and are expected to shed light on the fundamental me-chanisms of SALDI.
In this context, as originally proposed by De Pauw et al., preionised substituted benzylpyridinium (R·BP+) salts can be used as chemical thermometers probing the extent of heat transfer from the nanosubstrate to the (R·BP+) ions during the LDI process (Collette & De Pauw, 1998). Laser desorbed (R·BP+) ions, possessing a greater amount of internal energy than the critical energy of the unimolecular dissociation energy (E0), could un-dergo a simple cleavage of the C—N bond between the benzyl C and the pyridine N, producing (R·BP— Pyridine)+ “fragment ions” (Figure 4). The extent of fragmentation can be evaluated from the relative pro-portion of the survived intact (R·BP+) “parent ions” to the total intensity of desorbed benzylpyridinium ions, expressed by the survival yield (SY), defined as
SY I I I = + , P P F
where IP and IF indicate the intensity of the (R·BP+) parent ions and (R·BP—Pyridine)+ fragment ions, re-spectively. Several SY methods can be employed (namely the “original” (Collette & De Pauw, 1998; Derwa et al., 1991; Tang et al., 2009), the “modified” (Tang et al., 2009) and the “simplified” (Bian & Olesik, 2020; Luo et al.,2002; Tang et al.,2009) SY methods) to eval-uate the extent of internal energy transfer during the laser‐induced desorption process. A comprehensive ex-planation of the SY procedure is again beyond the scope of this review but interested readers may consult the publications of (Greisch et al.,2003) and (Gabelica & De Pauw, 2005), for example, in addition to the references already mentioned in this paragraph.
In particular, some SY procedures and other experi-ments using benzylpyridinium thermometer ions have
F I G U R E 3 Schematic illustration of laser‐induced plasma. Adapted from Chaudhary et al. (2016) [Color figure can be viewed at wileyonlinelibrary.com]
brought the foundation stones for the elucidation of the complex SALDI‐MS fundamental processes. For in-stance, Lai et al. investigated the effect of the different phase transition steps of gold nanoparticles on benzyl-pyridinium ions desorption efficiency upon laser irra-diation (Lai et al.,2016). They plotted the experimental total intensity of desorbed (R·BP+) ions as a function of theoretically calculated maximum laser‐induced heating temperatures of the gold nanoparticles, as shown in Figure 5. They proposed that when the gold nano-particles remain solid (i) or liquid (ii), the (R·BP+) des-orption is mainly driven by the thermal desdes-orption process, and the total intensity of desorbed (R·BP+) ions remains low (Lai et al.,2016). This is confirmed by the calculations of Pyatenko et al. which concluded that the photothermal mechanism prevails at low laser intensities (Pyatenko et al.,2009). In contrast, when the laser energy is high enough to vaporize the nanoparticles, the total intensity of desorbed (R·BP+) ions increases steadily (iii) (Lai et al.,2016). Finally, when laser energy exceeds
a threshold value through region (iv), the phase explo-sion of the nanosubstrate occurs, leading to a significant increase of the total intensity of desorbed (R·BP+) ions (Lai et al.,2016).
Moreover, the same research group studied the influence of the tuning of the metal contents of Ag‐Au alloy nanoparticles on the SALDI desorption effi-ciency and heat transfer (Lai et al.,2017). They found that the composition of the nanosubstrate affects the ion desorption efficiency but also the extent of heat transfer from the substrate to the analyte, as shown in Figure6.
Overall, these fundamental studies indicate that the SALDI processes are a combination of both thermally and non‐thermally energy transfers depending on the nature of the substrate and the energy brought to the sample by the exciting laser.
3
|
A N A L Y T I C A L S T R A T E G I E S
F O R S A L D I‐MS IMAGING
As for every MS experiments, the quality of the sample is paramount (Chaurand,2012), but sample preparation is also one of the crucial steps, determining the success of the imaging analysis (Goodwin,2012; Phan et al.,2016). A variety of sample preparation procedures have been developed to fulfill all requirements of each imaging technique. All steps of the preparation will often influ-ence the results and therefore have to be optimized, from sample collection to surface treatment prior mass
F I G U R E 4 General fragmentation scheme of the benzylpyridinium ions
F I G U R E 5 Effect of the computed maximum laser‐induced heating temperature of the AuNP on the normalized total intensity of BP ions desorbed from AuNPs. (i) Solid, (ii) liquid, (iii) gas, and (iv) phase explosion regions are also labeled. Reprinted with permission from Lai et al. (2016). © 2016 American Chemical Society [Color figure can be viewed at wileyonlinelibrary.com]
analysis (Amstalden van Hove et al.,2010). In particular, care must be taken to preserve the integrity and the spatial distribution of the analytes in the sample, which is critical in imaging analyses (Fournelle et al., 2020).
While countless samples have already been studied by MALDI‐MSI in disciplines as varied as pharmaceu-tical research (Schulz et al., 2019; Swales et al., 2019), ecotoxicology (Lagarrigue et al., 2016), plant biology (Boughton et al., 2016), biomedicine (Schwamborn et al.,2017), and molecular biology (Cornett et al.,2007), the variety of samples that have already been imaged by SALDI‐MSI remains rather limited, as shown in Figure7
and Table 3. Among these samples, the majority of re-ported SALDI‐MS imaging analyses focused on murine tissue sections (about 50% of which were mouse brain sections). This is not surprising as the most imaged tissue
type, regardless of the MSI technique, is mouse brain due to its small size, its characteristic internal structure (which is nowadays well documented), and its ease of sectioning (Chughtai & Heeren,2010).
Obviously, the sample preparation depends on the sample itself. Each sample needs its own preparation optimization, which is impracticable to cover in this re-view. Therefore, only the most common sample pre-paration protocols in the frame of SALDI‐MS imaging will be discussed.
Overall, the analytical strategy implemented in SALDI‐ MSI is very similar to the MALDI‐MSI analytical workflow. Thus, SALDI‐MSI experiments do not require any sig-nificant change in instruments and protocols compared with MALDI‐MSI, making this technique accessible to all laboratories familiar with MALDI‐MSI. Moreover, as SALDI and MALDI MSI are complementary techniques, their similar instrumentation is a real asset in the context of multimodal MSI. Their combination has already proved to allow a better molecular coverage. For example, Fincher and coworkers took profit of this complementarity to image lipids in biological samples. The analysis of neutral lipids (e.g., triglycerides [TG] and hexosylceramides) remains challenging by MALDI‐MSI due to ion suppression by phospholipids. In Fincher's studies, silicon nanosubstrates (NAPA) were able to selectively ionize neutral lipids (Fincher et al., 2020a, 2020b). In contrast, MALDI‐MSI provided higher signals for phosphatidylcholines (PC, a class of phospholipids) compared with SALDI‐MSI (Fincher et al.,2020a) (Figure8).
However, despite the similarities between SALDI and MALDI experimental workflows, some characteristics are specific to SALDI‐MSI such as the influence of the nanosubstrate chemical composition and shape (Section 3.3) on the LDI mechanisms (see Section 2.3), the possibilities of nanosubstrate functionalization for targeted SALDI‐MSI (see Section 3.4) or some nanosub-strate deposition methods specific to SALDI‐MSI (see Section3.5).
In this section, to provide the reader with a complete overview of the SALDI‐MSI analysis, each part of the SALDI‐MSI sample preparation will be discussed, even those already commonly encountered in MALDI‐MSI.
3.1
|
Stabilization of the sample
After sample collection, the sample degradation and analyte delocalization have to be avoided. In this respect, the embedding in a protective material and/or flash‐ freezing helps to preserve the sample integrity. In gen-eral, most samples used for MSI analyses are fresh‐frozen and chemically unmodified (Chughtai & Heeren, 2010).
F I G U R E 6 Effect of laser fluence on the survival yield of BP ions desorbed from AgNPs, Ag55Au45NPs, Ag15Au85NPs and AuNPs. Reprinted with permission from Lai et al. (2017). © 2017 PCCP Owner Societies [Color figure can be viewed at
wileyonlinelibrary.com]
F I G U R E 7 Sample types in SALDI‐MSI [Color figure can be viewed atwileyonlinelibrary.com]
Indeed, other treatments, such as formalin fixation, might not be compatible with MS analyses due to the formation of chemical cross‐links in the sample and/or interfering signals in the m/z range of interest (Buchberger et al.,2018; Kaletas et al.,2009). This is also the case for SALDI‐MSI experiments, in which the lar-gest part of the analyzed samples are either fresh‐frozen
(~40% of the samples reported in Table 3) or non‐ stabilized samples (i.e., without any treatment or freez-ing) (~30% of the samples reported in Table 3) mainly encountered in the “imprinting” and “deposition” sam-ple preparation (see Section3.5).
Fresh‐freezing is, for instance, performed using an isopentane bath chilled with liquid nitrogen or dry ice
T A B L E 3 Summary of the different types of samples analyzed by SALDI‐MSI
Sample type References
Murine brain Ageta et al. (2009); Baquer et al. (2020); Cha and Yeung (2007); Dufresne et al. (2013); Fincher et al. (2019a,2020b); Goto‐Inoue et al. (2010); Guan et al. (2018); Iakab et al. (2020); Kim et al. (2011); Lee et al. (2012); Lopez de Laorden et al. (2015); Muller et al. (2017); Müller et al. (2020); Patti et al. (2010a,2010b); Rafols et al. (2018); Shrivas et al. (2011); Stopka et al. (2016); Taira et al. (2008); Wu et al. (2017); Yanes et al. (2009); Yang et al. (2020); Zhou et al. (2017)
Murine kidney Baquer et al. (2020); Chau et al. (2017); Cheng et al. (2019a,2019b); Dufresne et al. (2013); Iakab et al. (2020); Krasny et al. (2015); Stopka et al. (2016) Tata et al. (2014); Vidova et al. (2010)
Murine lung Fincher et al. (2020a,2020b)
Murine colon Palermo et al. (2018)
Murine pancreas Baquer et al. (2020)
Murine liver Dufresne et al. (2013,2016); Iakab et al. (2020); Liu et al. (2007)
Murine retina Hayasaka et al. (2010)
Murine heart Jackson et al. (2014)
Murine testis Dufresne et al. (2013)
Fingerprints Cheng et al. (2016); Guinan et al. (2015a,2015c); Iakab et al. (2020); Lauzon et al. (2015); Niziol and Ruman (2013b); Sekula et al. (2015a,2015b); Schnapp et al. (2016); Skriba and Havlicek (2018); Tang et al. (2010); Yang et al. (2019); Wang et al. (2020b)
Tumoral and cancerous samples
Huang et al. 2015; Morosi et al. (2013); Niziol et al. (2016,2020); O'Brien et al. (2013); Rudd et al. (2019); Tang et al. (2011b); Tata et al. (2012); Tseng et al. (2017); Zhou et al. (2017)
Flowers Dutkiewicz et al. (2019); Jun et al. (2010); Niziol and Ruman (2013b); Patti et al. (2010b); Wang et al. (2020)
Leaves Ozawa et al. (2016)
Fruits De Oliveira et al. (2014); Niziol et al. (2019); Zhang et al. (2007)
Roots and bulbs Hansen et al. (2019); Jun et al. (2010); Misiorek et al. (2017); Sekula et al. (2015a); Shiono and Taira (2020)
Stems Dutkiewicz et al. (2019); Niziol and Ruman (2013b); Patti et al. (2010b)
Seeds Hansen et al. (2019)
Bacteria and fungi Chen et al. (2018); Dutkiewicz et al. (2019)
Cells and embryos Ferreira et al. (2014); Liu et al. (2007); McLaughlin et al. (2020); Stopka and Vertes (2020)
Insect samples Phan et al. (2016); Schnapp et al. (2016)
Banknotes and documents Tang et al. (2011a)
Peptide droplets Dupré et al. (2012)
Rabbit adrenal gland Dufresne et al. (2016)
Human skin tissues Fincher et al. (2019b,2020a)
TABLE 4 Summary of the deposition/utilization of the nanosubstrates Spraying Imprinting Deposition Sputtering Implantation Instrumentation Easy ‐to ‐handle instrumentation, automated devices allow a fairly good control of the spraying parameters Does not require any particular instrumentation Does not require any particular instrumentation Requires sophisticated instrumentation and the precise control of the sputtering parameters Requires specialized instrumentation for NP implantation Spatial resolution Limited by the migration of the analytes due to the solvent and by the aggregation and diffusion of the nanosubstrates. Usual spatial resolution varies between 10 and 200 µm Limited by the smudging of the spatial details during the imprinting step. Spatial resolution varies between 50 and 200 µm, 150 µm is usually employed Only limited by the instrumentation (i. e., laser spot size and moving stage). Currently a spatial resolution down to 10 µm can be achieved Only limited by the instrumentation (i. e., laser spot size and moving stage). Currently a spatial resolution down to 10 µm can be achieved. Dufresne et al. also employed a 5‐ µm resolution (Dufresne et al., 2013 ) The dryness of the method and the lack of turbulent flow avoid any physical movement of the analytes and thus allow a high spatial resolution. A 50 ‐µm resolution is usually employed but perhaps needs optimization. Other advantages Large selection of commercially available colloids Easy and rapid procedure Easy and rapid procedure Eliminates nanoparticle aggregation, high reproducibility, renders surfaces conductive (allows imaging of samples on nonconductive surfaces) Eliminates nanoparticle aggregation, high reproducibility of the implantation Other limitations Often requires stabilizing agents, which may cause interference in the low m/z range and/or ion suppression of the analytes Lack of sensitivity for low ‐ abundant species, inefficiency in transferring some analytes Need for very thin tissue sections (<5 µm), thus usually requiring embedding of the sample. Thicker sections affect conductivity and lead to low ionization efficiency, may suffer from limited sensitivity. Imaging artefacts may result from the different behaviors of histologically different regions of the tissue section upon laser irradiation High purity metals and argon are expensive High purity metals and argon are expensive (Continues)
TABLE 4 (Continued) Spraying Imprinting Deposition Sputtering Implantation Some examples of nanosubstrates AuNPs (Goto ‐Inoue et al., 2010 ; McLaughlin et al., 2020 ; Müller et al. 2020 ; Phan et al., 2016 ), AgNPs (Guan et al., 2018 ; Hayasaka et al., 2010 ; Jun et al., 2010 ), Graphene oxide (Zhou et al., 2017 ), TiO 2 NPs (Morosi et al., 2013 ; Shrivas et al., 2011 ; Yang et al. 2019 ), Graphite (Cha & Yeung, 2007 ; Zhang et al., 2007 ) AuNPET (Misiorek et al., 2017 ; Niziol et al., 2016 ; Sekula et al., 2015b ), 109 AgNPET (Niziol & Ruman, 2013a ; Niziol et al., 2019 , 2020 ) Etched Ag foils (Schnapp et al., 2016 ), TiO 2 nanowire surface (Dutkiewicz et al., 2019 ), Porous silicon (Ronci et al., 2012 ; Rudd et al., 2015 ), Commercial NALDI target (Krasny et al., 2015 ; Skriba & Havlicek, 2018 ; Tata et al. 2012 , 2014 ; Vidova et al. 2010), Silica plate (De Oliveira et al., 2014 ), AuBSi (Iakab et al., 2020 ) Silicon nanopost array (Fincher et al., 2019a , 2019b , 2020a , 2020b ; Stopka et al., 2016 ), Silica plate (Ferreira et al., 2014 ), (Modified) etched silicon (Guinan et al., 2015c ; Liu et al., 2007 ; O'Brien et al., 2013 ; Patti et al. 2010b ; Yanes et al., 2009 ), SiO 2 NPs (Dupré et al., 2012 ) Pure metal: Au (Chau et al., 2017 ; Dufresne et al., 2016 ; Hansen et al., 2019 ; Rafols et al. 2018 ; Tang et al., 2010 , 2011a , 2011b ), Ag (Baquer et al., 2020 ; Dufresne et al., 2013 ; Hansen et al., 2019 ; Lauzon et al., 2015 ; Yang et al., 2020 ), Pt (Hansen et al., 2019 ; Ozawa et al., 2016 ), Cu (Hansen et al., 2019 ), Ti (Hansen et al., 2019 ), Ni (Hansen et al., 2019 ); Pure metal oxide: ITO (Lopez de Laorden et al., 2015 ) Pure metal: Ag (Jackson et al., 2014 ; Muller et al. 2015 , 2017 )
(Goodwin,2012). This procedure allows to rapidly freeze samples that contain high amount of water so that the water does not have time to crystallize, maintaining water in a vitreous form that does not expand under solidification. The formation of ice crystals in the sample often induces physical distortion in the samples as well as tissue cracking. Other freezing procedures employ li-quid nitrogen or dry ice. However, the use of lili-quid ni-trogen has to be avoided as a vapor barrier forms at the interface of the sample with the liquid nitrogen, which boils when it gets in contact with the sample to be frozen. This lowers the cooling rate and leads to unpredictable freezing process, which in turn inflicts damage to the tissue. However, obtaining fresh‐frozen samples without embedding is sometimes difficult, especially in the
medical field in which the samples are routinely alcohol‐ or formalin‐fixed and paraffin‐embedded (FFPE) just after biopsy. In that case, a paraffin removal step using a xylene wash will have to be carried out prior imaging as paraffin suppresses ionization (Ly et al.,2016). However, the deparaffinisation steps using xylene can alter the distributions of molecular species soluble in organic solvents (such as lipids) or even wash out these com-pounds from the sample (Pietrowska et al., 2016). Sam-ples can also be embedded in other materials, such as optimal cutting temperature (OCT) polymeric matrices, epoxy resin, carboxymethyl cellulose or gelatin. Em-bedded samples are generally easier to be cut in sections than fresh‐frozen samples (Chughtai & Heeren, 2010). However, the flip side of the embedding step is that the
F I G U R E 8 (A and D) Optical images of serial mouse lung tissues sections. (B and E) Distribution of the [M+H]+ionic species of a
phospholipid (PC(36:4)) acquired by NAPA‐ LDI‐MSI (B) and MALDI‐MSI (E). (C and F) Distribution of the [M+Na]+adduct of a
triglyceride (TG(52:3)) acquired by NAPA‐ LDI‐MSI (C) and MALDI‐MSI (F). (G) Comparison of the averaged mass spectra of the entire tissue region acquired by NAPA‐ LDI‐MSI (NAPA) and MALDI‐MSI (DHB). Reprinted with permission from Fincher et al. (2020a). © 2019 John Wiley & Sons, Ltd. [Color figure can be viewed at wileyonlinelibrary.com]
protective material ionizes as well. OCT matrices, for instance, ionize easily, which leads to significant spectral interference and ion suppression in the low m/z range (Phan et al., 2016; Schwartz et al., 2003). Despite the interference generated by their desorption and ioniza-tion, OCT matrices are nevertheless quite regularly en-countered in SALDI‐MSI (~ 10% of the samples reported in Table 3). Compared with OCT matrices, gelatin pro-vides a much cleaner signal background (Chughtai & Heeren,2010; Phan et al.,2016).
3.2
|
Cryosectioning
Once stabilized, samples are generally cut in thin and flat microsections (required for MSI analyses) using a cryo‐ microtome. In SALDI‐MSI analyses, section thickness is usually chosen between 10 and 20 µm. Indeed, thinner sections tear easily and thicker sections, although easier to manipulate, require longer drying‐time, which can cause cracking and warping of the sections. Yet, some authors reported sections down to 3–5 µm, enabling to better visualize histological features and required in the “deposition” method as it will be further explained in Section 3.5. Sections up to 30‐µm thick were also re-ported, suitable in the “imprinting” method (See Section3.5). To perform MSI analyses, the sample sec-tions must be mounted on an electrically conductive target plate, to properly extract the ions produced at the sample surface. Hence, thicker sections might not be conductive enough and thin sections are often preferred. The conductive support is usually either an Indium Tin Oxide (ITO)‐coated glass slide or a nanostructured sub-strate for SALDI‐MSI.
3.3
|
Selection of the nanosubstrates for
SALDI
‐MSI
Once the sample has been selected, collected, and pre-pared, the next step is to consider the selection of the appropriate SALDI nanosubstrate based on the target analytes and applications. Back in 1988, Tanaka et al. al-ready defined characteristics that the materials have to present to be suitable to assist the LDI process (Tanaka et al.,1988). Among these features are a strong absorption in the UV range, allowing efficient absorption of the laser energy, and a low heat capacity and a large surface area per volume unit, both ensuring rapid heating, highly localized and uniform energy deposition (Morosi et al.,2013; Northen et al., 2007). In this context, nano-materials, displaying the ideal characteristics, have been attracting considerable attention and their development
led to the emergence of SALDI‐MS. Moreover, SALDI nanosubstrates have additional interesting physicochem-ical properties compared with organic matrices, such as low chemical background in LDI‐MS, non‐volatility (they are thus stable in vacuum conditions for MS imaging ex-periments) (Hansen et al., 2019) and their large surface area offers high molecular loading capacities (>1000 small molecules per nanoparticle) (Abdelhamid,2018).
Since the first implementations of SALDI‐MS, a great variety of nanomaterials and nanostructured surfaces have been tested and reported as SALDI nanosubstrates, with varying degrees of success (Law & Larkin, 2011). However, in this section, we only focus on the different nanosubstrates used in SALDI‐MS imaging applications, as the nature of the nanosubstrates used in “general” SALDI‐MS experiments has already been depicted in many other SALDI‐MS reviews (Abdelhamid2019,2018; Chiang et al.,2011; Lu et al.,2017).
3.3.1
|
Chemical composition of the
nanosubstrates
Nanosubstrates with various compositions have been used in SALDI‐MSI, as shown in Figure 9. Nanosub-strates are mainly based on silicon, gold, and silver but TiO2 and carbon‐based nanosubstrates as well as the commercial NALDI™ plate (Bruker Daltonics) are also quite usually met in SALDI‐MSI.
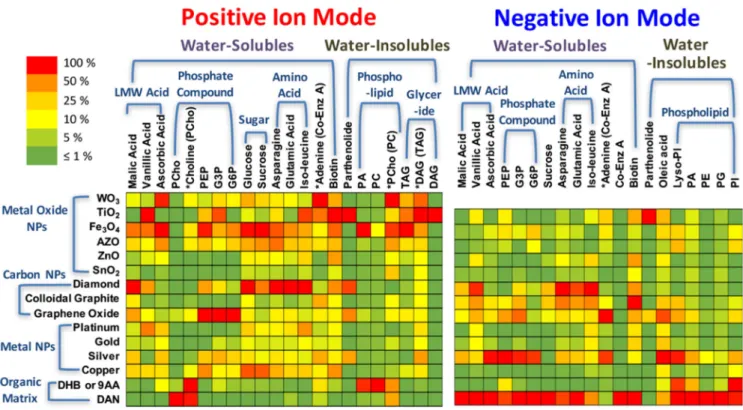
This variety of compositions can be partly explained by the preferential desorption/ionization of some specific classes of analytes with certain elements, as shown in Figure10. Some nanomaterials are known for their high natural affinity for specific functional groups and can thus be efficiently used to specifically analyze certain classes of analytes (Yagnik et al.,2016). There are several
F I G U R E 9 Compositions of the nanosubstrates used in SALDI‐MSI [Color figure can be viewed atwileyonlinelibrary.com]
well‐known examples; one of the best known is the af-finity of gold and silver for sulfur‐containing compounds (including thiols) (Arakawa & Kawasaki,2010). Another widely exploited example is the ability of silver (a strong Lewis acid) to form weak charge transfer complexes with double bonds (Muller et al., 2017), which makes it se-lective for long‐chain unsaturated hydrocarbons (Arakawa & Kawasaki, 2010; Dufresne et al., 2013), which are usually difficult to ionize with conventional MALDI‐MS (Schnapp et al., 2016), and for aromatic compounds by forming Ag adducts (Ozawa et al.,2016). Several authors took profit of this unique affinity to im-age the distributions of cholesterol and other lipids as well as olefins in rodent brain sections, an organ rich in lipids with important biological functions (Dufresne et al., 2013; Guan et al., 2018; Muller et al.,2017; Yang et al., 2020). Lipids species forming silver adducts were also imaged in other rodent organs such as rat kidney (Dufresne et al., 2013; Muller et al., 2015), rat heart (Jackson et al., 2014) and mouse retinal sections (Hayasaka et al., 2010). Alternatively, silver affinity to-ward lipids was used to image butterfly hindwing and fingermarks (Schnapp et al., 2016). Gold nanoparticles, besides their affinity for sulfur‐containing compounds, also offer selective ionization for some lipids especially triacylglycerides and small peptides, such as des‐acyl
ghrelin in fly brain (Phan et al., 2016) and glyco-sphingolipids in mouse brain (Goto‐Inoue et al., 2010). Metal oxide nanoparticles are also known for specific affinities. For example, ZnO nanoparticles have an affi-nity for amines, whereas TiO2 nanoparticles can selec-tively ionize enediol compounds (Arakawa & Kawasaki, 2010). TiO2nanoparticles are also known for their affinity for phosphorylated compounds (Pilolli et al.,2012).
Figure10also clearly shows the affinities of different nanosubstrates toward some of the low molecular weight metabolites, experimentally demonstrated (Yagnik et al., 2016). For example, TiO2nanoparticles are more inclined to detect water insoluble metabolites, especially parthenolide (a terpene) in positive ionization mode. Carbon‐based nanoparticles are also characterized by specific affinities: diamond nanoparticles work well with sugars and amino acids, in both ionization modes, while graphene oxide nanoparticles are particularly efficient with phosphate compounds in positive ionization mode. Complementarily, silver nanoparticles allow the sensitive detection of phosphate compounds in negative ionization mode. Pt usually interacts with alkyl carboxylic acid and alkylamine (Kawasaki et al.,2009), which may justify its affinity for amino acids. The carboxylic functional group can also link with Fe (Kawasaki et al., 2009). The
F I G U R E 10 Summary of nanoparticle screening for small molecule metabolite analysis. Ion signals are normalized to the highest ion signal for each analyte and shown as a heat map. DHB and DAN were used for positive ionization mode and 9‐AA and DAN were used for negative ionization mode. Reprinted with permission from Yagnik (2016). © 2016 American Chemical Society [Color figure can be viewed at wileyonlinelibrary.com]
intrinsic affinities of these different nanosubstrates for various types of specific analytes also shows the potential of a combination of several nanosubstrates in one single experiment. A thermal desorption model has been de-veloped to explain the different SALDI‐MS efficiencies (Yagnik et al., 2016). However, the influence of other parameters including hydrophobicity‐hydrophilicity and electrostatic properties of the surface still have to be in-vestigated to understand the preferential desorption/ ionization observed for the nanosubstrates. Indeed, without a better understanding of the SALDI funda-mental mechanisms (see Section2.3), the selection of the nanosubstrate will remain purely empirical.
As also shown in Figure 10, the composition of the nanosubstrate will usually dictate the choice of the io-nization mode (either positive or negative). For example, the analysis of vanillic acid will be preferentially per-formed in negative ionization mode with diamond na-noparticles and in positive ionization mode with TiO2 nanoparticles. It is however worth to note that the most common nanomaterials, such as silver‐ and gold‐based nanoparticles (Müller et al.,2020), can work in both io-nization modes, either positive or negative for the ana-lysis of various small molecules (Abdelhamid,2018). In another study, gold and silver‐based nanoparticles are clearly efficient in both ionization modes for soluble and insoluble water compounds (Hansen et al.,2019). Porous TiO2 film immobilized with gold nanoparticles also ex-hibit high performance in dual polarity analyses (Wang et al., 2020). On the contrary, usual MALDI matrices such as DHB or 9‐AA are respectively used in positive and negative ionization modes. Figure10also indicates that 1,5‐diaminonaphthalene (DAN) is more efficient than the nanoparticles in the negative ionization mode.
The SALDI mass spectra of the samples can also be internally mass calibrated using the nanosubstrate ions or cluster ions (e.g., Aun+/− and Agn+/− clusters) (Kolárova et al., 2017; Prysiazhnyi et al., 2019; Ràfols et al., 2018). Indeed, in most cases, the nanosubstrates used in SALDI‐MSI are also ionized and associated with intense signals. Nevertheless, the ionization of the LDI‐ assisting substrate in SALDI‐MSI does not significantly increase the chemical background of the spectra in the low m/z values, which is not the case in MALDI‐MS. Moreover, recently developed chemometric approaches enable to annotate the signals attributed to the nano-substrate in SALDI‐MSI and thus, to clean up the mass spectra from the LDI‐assisting substrate signals (Baquer et al.,2020). In this context, silver‐based nanosubstrates are particularly adapted thanks to the two abundant and stable natural isotopes of silver, 107Ag (51.839%) and
109
Ag (48.161%), which can be distinguished in the mass spectrum. Several silver clusters can thus be identified
based on exact mass measurements and their character-istic isotope patterns. Additionally, silver is not naturally abundant in biological samples, such as tissues or cell cultures (Muller et al.,2015). Therefore, one can be en-sured that the image of the analytes as silver adducts (thanks to the ionization of silver from the nanosubstrate itself) represents the natural distribution of the analytes. This is not necessarily the case for Na+ or K+ adducts. Indeed, these ubiquitous alkali ions are naturally abun-dant and thus, the image of the alkali cationised adducts may be more dependant of the distribution of Na+/K+ ions across the imaged samples (Muller et al., 2015). Moreover, abnormal Na+and K+distributions may result from an alteration of the ATP metabolism underlying a disease (Guan et al.,2018). However, close attention has to be paid to the SALDI‐MSI data processing due to the high heterogeneity in the formation of adducts between biological compounds from the sample and silver cations (Baquer et al.,2020).
3.3.2
|
Morphology of the
nanosubstrates
The majority of the nanosubstrates employed in SALDI‐ MSI are either nanostructured solid surfaces (~40% of the samples reported in Table3) or colloidal nanomaterials (~40% of the samples reported in Table3) sprayed at the sample surfaces (see Section 3.5). Sputtered metal na-noclusters are also commonly encountered in SALDI‐ MSI (~20% of the samples reported in Table 3). Besides this general appearance, the fine nanostructure of the nanosubstrate can also be described. The morphology of the nanosubstrate (e.g., size, porosity, type of nanos-tructure) is of prime importance as it significantly affects the desorption/ionization efficiency in SALDI‐MS (Zhu et al.,2020). For instance, it has been demonstrated that the ionization/desorption processes are greatly impacted by the roughness/porosity of the nanostructure (Law,2010) and, in particular, by the pore depth (Xiao et al.,2009). The size of TiO2particles in monoliths was also found to affect the detection of intact lipids and their fragmentation (Wu et al.,2017). The appropriate nano-substrate morphology can also improve the sample pre-paration. For example, a novel porous aluminum oxide slide has been recently developed to drastically minimize lipid delocalization and ion suppression effects (Fournelle et al.,2020).
In the context of SALDI‐MSI, colloidal nanomaterials are almost exclusively used in the form of colloidal gra-phite (or graphene oxide) or colloidal nanoparticles of different diameters, usually comprised between 2 and 10 nm. Nanoparticles with diameters higher than 30 nm
have also been reported in SALDI‐MSI (Müller et al.,2020; Tseng et al.,2017; Wang et al.,2020).
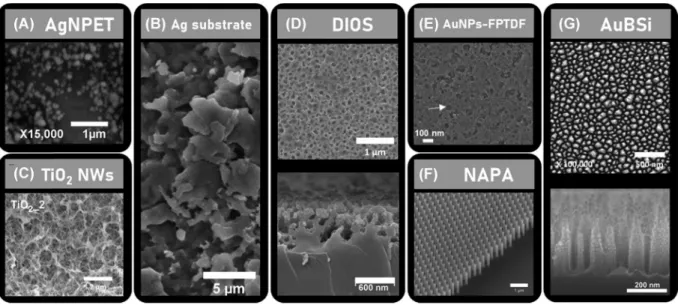
The fine structure of the solid nanosubstrates is more diversified, as shown in Figure 11, ranging from highly engineered, controlled and uniform nanostructures to more randomly organized structures. For example, the solid nanosubstrates can be prepared by coating a target plate with metallic nanoparticles. The research team of T. Ruman has developed AgNPET (Figure. 11A) (Niziol et al., 2013, 2019, 2020) and AuNPET (Misiorek et al., 2017; Niziol et al., 2016; Sekula et al., 2015a), by coating a steel target with ~100 nm of AgNPs and AuNPs, respectively. Metal targets can also be directly etched to form Ag etched substrates, for example (Figure 11B) (Schnapp et al.,2016). A titanium target has also already been etched through an inexpensive modified hydro-thermal process to form TiO2 nanowires (Figure 11C) (Dutkiewicz et al., 2019). Nanowires also constitute the silicon nanostructure of the NALDI™ plate used in var-ious SALDI‐MSI studies (Krasny et al., 2015; Skriba & Havlicek, 2018; Tata et al., 2012, 2014; Vidova et al.,
2010). In DIOS, the nanostructured surface is produced via the etching of a silicon wafer, leading, for instance, to ordered nanocavity arrays (Liu et al., 2007). DIOS na-nosubstrates are employed in several works (Guinan et al., 2015a; Ronci et al., 2012; Rudd et al., 2015). Figure 11D shows a DIOS nanosubstrate characterized by a pore diameter of ~80 nm and depth of
~450 nm (Guinan et al., 2015b). The etched silicon sur-face was further oxidized and finally silanised. The NIMS chips share a common fabrication procedure with DIOS platforms, except that the silicon etched surface of the NIMS chips are further coated with an fluorinated in-itiator solution (e.g., BisF17, Bis(heptadecafluoro‐1,1,2,2‐ tetrahydrodecyl)tetramethyldisiloxane) (Woo et al.2008). NIMS chips are mainly used by G. Siuzdak and cow-orkers (Lee et al., 2012; O'Brien et al. 2013; Patti et al.,2010a,2010b; Yanes et al.,2009). In SPILDI (or SP‐LDI), the solid substrate is simply a silica TLC plate (De Oliveira et al.,2014; Ferreira et al.,2014). Be-sides silicon‐based nanosubstrates, TiO2 has also been used as a porous nanostructure covered with AuNPs (Figure 11E) (Wang et al., 2020). Finally, some nanos-tructured solid substrates used in SALDI‐MSI are more engineered leading to more complex nanostructures. For example, in NAPA‐LDI, the nanosubstrate is composed of nanopost arrays, also prepared from silicon wafers. Figure11Fshows the highly ordered and uniform NAPA platform with silicon nanoposts characterized by an average height of 1100 nm, an average diameter of 150 nm and an average periodicity of 337 nm) (Morris et al., 2015). NAPA platforms have been developed and are still commonly used by the research group of A. Vertes (Fincher et al.2019a,2019b,2020a,2020b; Stopka et al., 2016). The gold‐coated black silicon substrates (AuBSi) (Figure11G) developed by Iakab et al. are also
F I G U R E 11 SEM images of (A) AgNPET. Reprinted with permission from Niziol et al. (2013). © 2012 Elsevier B.V. (B) etched Ag substrates. Reprinted with permission from Schnapp et al. (2016). © 2016 Elsevier Inc. (C) TiO2nanowires (NWs). Reprinted from
Dutkiewicz et al. (2019) (CC BY‐NC‐ND 4.0). (D) DIOS nanosubstrate, top view (top) and cross‐section (bottom). Reprinted with permission from Guinan et al. (2015b). © 2015 The Royal Society of Chemistry. (E) Functionalized porous TiO2film immobilized with gold
nanoparticles (AuNPs‐FPTDF). Reprinted with permission from Wang et al. (2020a). © American Chemical Society. (F) NAPA platform. Reprinted with permission from Morris et al. (2015). © 2015 The Royal Society of Chemistry. (G) Gold‐coated black silicon substrate (AuBSi). Reprinted with permission from Iakab et al. (2020). © 2020 American Chemical Society