HAL Id: hal-00734617
https://hal.archives-ouvertes.fr/hal-00734617
Submitted on 24 Sep 2012HAL is a multi-disciplinary open access archive for the deposit and dissemination of sci-entific research documents, whether they are pub-lished or not. The documents may come from teaching and research institutions in France or abroad, or from public or private research centers.
L’archive ouverte pluridisciplinaire HAL, est destinée au dépôt et à la diffusion de documents scientifiques de niveau recherche, publiés ou non, émanant des établissements d’enseignement et de recherche français ou étrangers, des laboratoires publics ou privés.
Generation and characterization of radiolabelled
nanosized carbonaceous aerosols for human inhalation
studies
Jérémie Pourchez, Iolanda Albuquerque-Silva, Michèle Cottier, Anthony
Clotagatide, Laurent Vecellio, Marc Durand, Francis Dubois
To cite this version:
Jérémie Pourchez, Iolanda Albuquerque-Silva, Michèle Cottier, Anthony Clotagatide, Laurent Vecellio, et al.. Generation and characterization of radiolabelled nanosized carbonaceous aerosols for human inhalation studies. Journal of Aerosol Science, Elsevier, 2013, 55, pp.1-11. �10.1016/j.jaerosci.2012.07.011�. �hal-00734617�
Page 1
Generation and characterization of radiolabelled nanosized carbonaceous aerosols for human inhalation studies
Jérémie Pourcheza,b,c, Iolanda M. D. Albuquerque-Silvaa,b,c, Michèle Cottiera,c,d,e,f,
Anthony Clotagatidee, Laurent Vecelliog,h, Marc Duranda,c,i, Francis Duboisa,c,d,e,f
a
LINA, EA 4623,F-42023, Saint-Etienne, France
b
Ecole Nationale Supérieure des Mines de Saint-Etienne, Centre Ingénierie et
Santé, F-42023, Saint-Etienne, France
c
SFR IFRESIS, F-42023, Saint-Etienne, France
d
Université Jean Monnet, Faculté de Médecine, F-42023, Saint-Etienne, France
e
CHU de Saint-Etienne, F-42055, Saint-Priest en Jarez, France
f
Université de Lyon, F-42023, Saint-Etienne, France
g
DTF Aerodrug – Diffusion Technique Française, Tours, France
h
INSERM U1100-EA6305, Université François Rabelais, Tours, France
i
Centre Hospitalier Emile Roux, F-43012, Le Puy en Velay, France
Correspondence to: Jérémie POURCHEZ, Ecole Nationale Supérieure des Mines de
Saint-Etienne, Centre Ingénierie et Santé, 158 Cours Fauriel 42230, France.
Telephone / Fax number: + 33 4 77 42 01 80 / +33 4 77 49 96 94, mail:
Page 2
ABSTRACT
2
New insights on the output of a commercial Technegas generator were proposed in
3
order to optimize the generation of a radioactive nanosized aerosol for human
4
inhalation studies. Parameters influencing Technegas generated aerosols (i.e.
5
gaseous atmosphere, generation temperature and storage duration) were analyzed
6
by a combination of size-fractionation and gamma-scintigraphy detection to
7
determine the aerosol aerodynamic-related distributions. It was found that the total
8
radioactivity per mass and number concentrations of aerosols was mostly influenced
9
by the burn temperature, while the radiolabelling of particles was mostly driven by
10
their surface area. 99mTc labeled nanosized carbonaceous primary particles appear
11
mainly to result from nucleation/condensation of the supersaturated vapor during the
12
burning step, and then coalesce into larger particles due to coagulation processes
13
during the residence time in the expansion chamber. We showed that the burn
14
temperature and the aerosol residence time were the main parameters influencing
15
the particle size distribution. Under optimized operating conditions, the amount of
16
radiolabelled nanoparticles substantially increased since the radioactivity median
17
aerodynamic diameter was reduced by half (250 nm - GSD of 2.5) compared with the
18
standard operating conditions of the Technegas generator (450 nm - GSD of 3.4).
19 20
KEYWORDS: Technegas; ELPI; radiolabelled nanosized aerosols
21 22
Page 3
MAIN TEXT
23
1. Introduction
24
Radiolabelled aerosols are widely used to study airborne particle deposition patterns
25
in the lung as well as lung clearance (Möller et al., 2006; Sanchez-Crespo et al.,
26
2011; Carvalho et al., 2011). Among all the radiolabelled aerosols clinically used in
27
patients, one of the most convenient is the “Technegas technique” widely used to
28
perform lung ventilation scintigraphy as a diagnostic technique in nuclear medicine.
29
The aerosol produced is commonly known as Technegas, an ultrafine suspension of
30
carbon particles labeled with technetium (99mTc). Technegas preparation takes place
31
in a specially designed machine, called the Technegas generator, where a solution of
32
sodium pertechnetate is loaded into a graphite crucible and evaporated until dry.
33
Technegas is then generated by heating to 2550 °C in an atmosphere of pure argon.
34
The number size distribution of Technegas particles is mainly below 100 nm (Vita
35
Medical Ltd., 2000). Since more than 2 decades, this radioactive aerosol is regularly
36
used as a ventilation scintigraphy agent, and the device is approved for human
37
application without any toxicological issues (Jögi et al., 2010, Senden et al., 1997;
38
Lloyd et al., 1995; Burch et al., 1986). Due to the short half-life of 99mTc (6.02 h), the
39
radiation dose can be kept low (< 0.1 mSv) even though the resulting high activities
40
allow high quality gamma-camera imaging in nuclear medicine.
41
Under standard operating conditions, the Technegas generator produces airborne
42
particles with leaching rates >10% which are too high for clearance studies. Since
43
NaCl contained in the 99mTc-eluate also evaporates and condenses during the
44
burning step, the particles have hygroscopic properties and the radiolabel leaches
45
from them. Recently Moeller et al. (2006) proposed several modifications to the
46
operating conditions of the Technegas generator to avoid these drawbacks such as
Page 4
the use of NaCl free 99mTc-eluate. In addition the particles could be labeled by 111In
48
(Sanchez-Crespo et al., 2011) or 68GaCl3 (Borges et al., 2011) instead of 99mTc to
49
extend the investigation time of clearance studies from 1 day to a few weeks.
50
Although it is generally accepted that the Technegas generator produces a
51
smaller particle size than other conventional radiolabelled aerosols, few data are
52
available about its particle size characteristics. To the best of our knowledge no data
53
have yet been reported on the relationship between radioactivity aerodynamic
54
diameter (AMAD) although this parameter is crucial to assess deposition patterns.
55
Even the median diameter remains poorly defined in the range from about 200 to 400
56
nm (Borges et al. 2011, Lemb et al., 1993; Strong and Agnew, 1989; Möller et al.,
57
2006). In fact, clinical experiments in nuclear medicine indicate that radiolabelled
58
Technegas particles are likely to impact on obstructions within the respiratory tract,
59
which is a behavior typically attributed to micrometer sized aerosols (Jögi et al.,
60
2010).
61
The radiolabelling mechanism and radiolabelling efficiency of airborne particles
62
related to their aerodynamic size also remain poorly understood. Therefore, this
63
study aims at new insights on the output of a Technegas device generating 99mTc
64
labeled nanosized carbonaceous aerosols. The physical properties of the airborne
65
nanoparticles in term of radiolabelling efficiency, number, mass and surface area
66
concentrations are characterized by using a combination of size-fractionation and
67
gamma-scintigraphy detection. Based on the experimental methodology previously
68
developed by Moeller et al. (2006), we also propose a better understanding of the
69
effect of Technegas generator operating conditions on the characteristics of the
70
radiolabelled particle size distributions. Finally, we also describe optimal operating
71
conditions to generate radiolabelled carbonaceous nanoparticles.
Page 5
2. Material and methods
73
The generation of Technegas was first reported in 1986, as a simple process
74
consisting of evaporating Technetium (99mTc) containing eluate in a graphite crucible
75
at 2500°C (Burch et al., 1986). The Technegas generator is essentially a miniature
76
high temperature furnace (Figure 1). It uses a combination of graphite in an argon
77
atmosphere to chemically reduce the pertechnetate ion TcO4- contained in the 99mTc
78
sodium pertechnetate solution to metallic technetium (Tc), and then produce metallic
79
aerosol particles by vaporizing both carbon and technetium elements. The inert
80
atmosphere is critical to produce pure carbon or metallic aerosols (Evans et al.,
81
2003). The crucible is the source of graphite vapour which ultimately coats the
82
technetium metal. An AC electrical current passes through two conducting substrates
83
(electrodes and crucible) possessing relatively low vapour pressure. The metallic
84
aerosol forms first by nucleation/condensation of the vapour, followed by
85
agglomeration of airborne nanoparticles composed of hexagonal platelets of metallic
86
technetium (99mTc) closely encapsulated with a thin layer of graphitic carbon. During
87
Technegas production, particles are not equally radiolabelled. The rapid volatilization
88
of the species involved and the surface passivation of the resulting metallic aerosol
89
are major factors influencing particles formation and stabilization, which may proceed
90
differently according to particle size distribution (Senden et al., 1997).
91
In this work, the Technegas generator (Cyclomedica Pty Ltd, Australia) was
92
operated in its “maintenance mode”, which allows modifying its operating conditions.
93
A pyrometer was coupled to the generator in order to control burn temperature. For
94
aerosol production, a standard graphite crucible was previously humidified with 99%
95
ethanol in order to increase its wetability and then filled with a 200MBq 99mTc-sodium
96
pertechnetate solution placed in the Technegas generator chamber. The produced
Page 6
aerosol was subsequently analyzed by an electrical low pressure impactor (ELPI,
98
Dekati Ltd., Finland) and a gamma camera (Millenium, GE, USA), to determine the
99
particle size distribution both by weight, number, surface area and radioactivity. The
100
NaCl content in 99mTc-eluate was also evaluated with respect to its influence on the
101
final particle size distribution. All experiments were performed in triplicate and
102
statistically analyzed (unpaired t-test).
103 104
2.1 Aerosol generation parameters 105
Under standard clinical operating conditions, the aerosol production is initiated
106
through the “simmer” stage, which is characterized by a modification of the generator
107
chamber atmosphere by argon flushing and a slight heating of the crucible up to
108
80°C for a 6 minute duration (Vita Medical Ltd., 2000). Under these conditions, the
109
99m
Tc eluate is evaporated to dryness, providing an intimate contact between the
110
crucible and the species of 99mTc-sodium pertechnetate solution (Senden et al.,
111
1997). Subsequently, the “burn” stage begins in which the crucible is finally heated to
112
2550°C for 10 seconds (Vita Medical Ltd., 2000). This heating leads to technetium
113
and carbon evaporation with subsequent condensation and aerosol formation. It is
114
therefore reasonable to conclude that the major parameters influencing aerosol
115
generation are the burn temperature, the duration of the simmer and the burn stages.
116
Another important parameter is the residence time in the expansion chamber. During
117
clinical procedures, a delay (i.e. a residence time in the expansion chamber) occurs
118
between Technegas generation and its delivery to the patient. This delay is usually
119
on the order of 2 minutes. During the residence time in the expansion chamber,
120
particles are able to coagulate and agglomerate, with a significant impact on the
Page 7
subsequent size distribution of the radioactive aerosol delivery to the patient (Möller
122
et al., 2006).
123
The standard clinical parameters for Technegas production are prescribed as 6
124
minutes of simmering, followed by 10 s of burning at 2500°C followed by 2 minutes of
125
residence time. However, in order to reduce the consumption of the generator
126
electrodes, in this work the standard burn stage duration was reduced to 5 seconds
127
instead of 10. The proposed change of operating conditions of the Technegas
128
generator was based on a previous study from Möller et al. (2006). The analyses of
129
particle size distribution were performed by varying each generation parameter: (I)
130
simmer duration (6 – 15 min); (II) burn temperature (1900 – 2800°C); (III) burn
131
duration (2 – 15s) and (IV) aerosol residence time (0.5 – 10 min). The operating
132
conditions of the Technegas generator were summarized in Figure 2.
133 134
2.2 Particle size distributions 135
Aerosol size distributions were determined using the ELPI low pressure impactor.
136
The ELPI classifies by aerodynamic diameter, in 12 size fractions ranging from 10
137
µm to 7 nm (Virtanen et al., 2001; Marjamäki et al., 2000). The number concentration
138
was converted to mass and surface area concentrations assuming the graphite
139
crucible density (2.13 g.cm-3) for the particles. Differential distributions and
140
normalized cumulative distributions are shown in accordance with the European
141
standard EN 13544-1 for respiratory therapy equipment, which is widely employed for
142
pharmaceutical aerosols. The cumulative distributions were normalized, i.e. data
143
were expressed in % where 100% corresponds to total radioactivity (from
gamma-144
camera measurements) or total mass/number/surface area (from ELPI calculations)
145
deposited on all the 12 collection plates of the cascade impactor.
Page 8 2.3 Radioactivity measurements
147
A combination of ELPI size fractionation and gamma scintigraphy detection
148
was used to determine the aerodynamic radioactivity size distribution. For this
149
purpose, the aerosol was collected on cellulose substrates inserted on the collection
150
plates of the impactor. The radioactivity of airborne particles deposited on each
151
collection substrate was determined by gamma scintigraphy imaging during a 2
152
minutes acquisition time. The distribution of radioactivity is presented versus the ELPI
153
stage mid-point aerodynamic diameter.
154 155
2.4 Electron microscopy observations and chemical analysis 156
Field Emission Gun Scanning Electron Microscopy (FEG SEM, Jeol JSM
157
6500F) was used to analyze the Technegas particles deposited within the ELPI
158
stages. SEM observations coupled with image analysis also provided a mean
159
geometric particle diameter for each size class of the ELPI.
160
The sodium and chloride concentrations in the Tc-eluate were obtained by ion
161
chromatography with a Dionex apparatus composed of a GP50 pump, a CS12A
162
column for cation analysis, a AS11HC column for anions, a CD conductometric
163
detector and a UV-visible detector. The presence of NaCl in the airborne particles
164
was characterized using energy-dispersive X-ray spectroscopy (EDX) coupled with a
165
scanning electron microscope. The EDX analytical technique was used for the
166
elemental analysis of airborne particles (except carbon and technetium elemental
167
detection). The sodium, chloride and technetium content of airborne particles were
168
measured using X-ray photoelectron spectroscopy (XPS). XPS is a quantitative
169
spectroscopic technique for the elemental composition.
170 171
Page 9
3. Results
172
3.1 Technegas aerosol under standard operating conditions 173
A linear correlation was found between the geometric diameter of particles
174
calculated by image analysis from SEM images and the corresponding mid-point
175
aerodynamic diameter of the ELPI stage (Figure 3). Results show a particle
176
distribution composed of a predominantly carbonaceous nature for the ultrafines
177
particles (in the 30-300 nm size range) and the dominant NaCl content of the micron
178
sized particles (Figure 3). The sodium chloride content of numerous micrometer sized
179
particles was clearly put in evidence by EDX spectroscopy during SEM observations
180
and XPS analysis. On the ELPI stages corresponding to mid-point aerodynamic
181
diameters higher than1 µm, SEM images also show the presence of coagulated
182
carbonaceous particles (data not shown but similar to Figure 7), which precluded the
183
correct determination of their geometric diameter, leading to slight deviations from
184
ELPI measurements even if the overall correlation remains quite good.
185
The particle size distributions of the aerosol obtained under standard operating
186
conditions used in clinical routine are first presented in terms of number, surface
187
area, mass and radioactivity (Figure 4). Number distributions are dominated by
188
nanoparticles with aerodynamic diameters lower than 100 nm with a Count Median
189
Aerodynamic Diameter (CMAD) of 40 nm (GSD of 2.9). However, radioactivity
190
distributions indicate that radiolabelled particles are mostly distributed in the range
191
between 100 nm and 1 µm, providing an Activity Median Aerodynamic Diameter
192
(AMAD) of 450 nm (GSD of 3.4). Radioactivity distributions were found to be in good
193
accordance with surface area distributions, characterized by a Surface Median
194
Aerodynamic Diameter (SMAD) of 540 nm (GSD of 2.1). Finally, mass distributions
Page 10
showed particles exclusively distributed in the size range above 100 nm, leading to a
196
Mass Median Aerodynamic Diameter (MMAD) of 820 nm (GSD of 2.7) .
197
The combination of aerodynamic and radioactivity measurements provides new
198
insights into the radiolabelling process. A radiolabelling efficiency was defined as the
199
ratio between activity (in fact radioactivity, in Bq) and mass from particles deposited
200
on each ELPI stage. According to Figure 5, particle radiolabelling is most efficient in
201
the nanometer range and than decreases continuously with aerodynamic diameter.
202
The electric charge level of the freshly generated airborne Technegas particles
203
was also checked by ELPI (using the ELPI with the corona charger OFF) in order to
204
verify that the original electric charge of the particles does not affect the ELPI
205
detection based on current measurement. Results show that the aerosol particles are
206
weakly charged and that the charge distribution depends to the aerodynamic particle
207
size. Particles are positively charged (13 fC) for sizes from 28 to 262 nm, negatively
208
charged (-12 fC) in the range 262 nm to 1.6 µm, and finally neutral for sizes greater
209
than 1.6 µm. In this case, the corona charger produces a sufficient amount of positive
210
ions to first neutralize and then charge the particles normally up to 7500 fC, 500
211
times higher than the original electric charge of the particles. Furthermore, the use of
212
cellulose substrates for particles recovery on the ELPI stages has no significant
213
influence (p< 0.05) on the Technegas particle size distribution. Both methods
214
generate aerosol with an AMAD of 445 (GSD of 3.0) and 450 nm (GSD of 2.7)
215
respectively (Table 1). 216
217
3.2 Technegas aerosol characteristics under modified operating conditions 218
We now show that the modified operating conditions significantly influence the
219
particle size distribution (Figure 6). Results are also summarized as mean of AMAD
Page 11
and GSD in Table 2. An increased simmer increases the amount of nanoparticles
221
significantly. 15 minutes of simmering (instead of 6 min under standard clinical
222
operating conditions) increase the nanoparticle population by 10%, leading to a
223
reduction of the Technegas AMAD from 450 to 305 nm. Increasing the burn duration
224
from 2 to 10 seconds also reduces the AMAD from 500 to 370 nm. However,
225
increasing the burn duration beyond 10 seconds does not have a significant influence
226
on the aerosol AMAD.
227
The burn temperature of the crucible, and the aerosol residence time in the
228
expansion chamber, appear to be the main parameters affecting aerosol generation.
229
Therefore, either an increase of burn temperature or a decrease of residence time
230
leads to a substantial reduction of aerosol AMAD and an increased amount of
231
radiolabelled nanoparticles. Increasing the burn temperature from 1900°C to 2800°C
232
leads to a decrease of AMAD from 510 to 270 nm. A decrease of residence time from
233
10 minutes to 0.5 minutes gave a decrease of AMAD from 540 to 285 nm. SEM
234
observations showed that the morphology of aerosols particles was also highly
235
dependent on their residence time. Therefore, particle coagulation and agglomeration
236
were visibly reduced for small aerosol residence times (30 seconds) but manifestly
237
present for long residence times (10 minutes) (Figure 7).
238
Moreover, the total amount of aerosol radioactivity, i.e. the number of technetium
239
atoms fixed on carbonaceous particles, was also strongly influenced by the
240
generation parameters, especially by the burn temperature (Figure 8). Thus, a
241
reduction of temperature to 1900°C causes a significant reduction in total
242
radioactivity, up to 4 times lower than in standard clinical operating conditions.
243
Finally, the radiolabelled particle size was mostly affected by the burn
244
temperature. Thus, an optimization of the generation method is proposed based on
Page 12
adjustments of the burn temperature, in order to maximize the production of
246
radiolabelled nanoparticles. This optimized method of radiolabelled aerosol
247
production was performed by two consecutives burn stages, using both extremes of
248
burn temperature of the generator: 5 second burn at 1900°C followed by 5 second
249
burn at 2800°C. The optimized radiolabelled aerosol showed an aerodynamic particle
250
size distribution with an AMAD of 250 nm (GSD of 2.5), about 2 times smaller than
251
standard Technegas, but to a 15% increase of the radiolabelled nanoparticles (Figure
252
9).
253
Once the optimized conditions for Technegas production were determined, the
254
influence of the NaCl content on Tc-eluate was analyzed. Ionic chromatography
255
confirms the very low NaCl concentration (in the range 20-100 mg/L) of the NaCl free
256
Tc-eluate, by comparison with the NaCl concentration of 9 g/L for NaCl Tc eluate.
257
Results further prove that an initially NaCl-free eluate did not significantly modify the
258
particle size distribution (AMAD of 200 nm) (Figure 9).
259 260
Page 13
4. Discussion
261
In the present study, based on a methodology combining radioactivity
262
measurements and aerodynamic size fractionation, for the first time the Technegas
263
size distributions are expressed in terms of size-related radioactivity, characterized
264
by AMAD. Using ELPI based calculations, the aerosol was also characterized by its
265
CMAD, SMAD and MMAD. These calculations are based on positive ion active
266
surface areas measured by ELPI, and the masses of spheres with diameter equal to
267
the midpoint aerodynamic values (Da) of each stage. Active surface area is generally
268
defined as the surface of a particle that is involved in interactions with the
269
surrounding gas (Fuchs, 1963). Thus, the ELPI provides a real time size-selective
270
(aerodynamic diameter) active surface-area concentration. In this sense the surface
271
area measured by the ELPI is an active surface area quite relevant to describe
Tc-272
carbone interactions. The active surface area distribution appears to be the most
273
appropriate form to describe the radiolabelled particles distributions since a good
274
correlation is observed between surface area and radioactivity cumulative
275
distributions (Figure 4). This original data demonstrates that particle radiolabelling is
276
mostly proportional to their active surface area, rather than particle number or mass.
277
In other words, the quantity of technetium atoms fixed on the carbonaceous particles
278
is mainly dependent to their active surface area.
279
Further, the Technegas MMAD (820, GSD of 2.7) was found to be almost 20
280
times higher than its CMAD, which trivially indicates that Technegas nanoparticles,
281
although abundant in number, are not significant in mass. However, activity
282
measurements provide an AMAD (450 nm, GSD of 3.4) corresponding to the half of
283
Technegas MMAD, which can be explained by the fact that its nanoparticles,
284
although insignificant in mass, have a considerable radioactivity. The radiolabelling
Page 14
efficiency of Technegas particles, expressed by means of activity-to-mass ratio, also
286
indicates that particle radiolabelling was more efficient on the nanometric scale
287
(Figure 5). This result highlights the role played by particle surface area during
288
radiolabelling. In this sense, the higher active surface area to volume ratio of
289
nanoparticles (compared to micrometric particles) can easily explain the continuous
290
decrease of radioactivity to mass ratio with the increase of aerodynamic diameter.
291
The remarkable radiolabelling efficiency of nanoparticles can also be explained by
292
their mode of production. In previous work, Senden et al. (1997) observed that the
293
radioactivity only leaves the crucible at the melting point for technetium (2250 ±
294
50°C), which probably indicates that there is a passive mechanism of particle ejection
295
from the crucible (i.e. the evaporation of the metal). Once in the vapor phase,
296
technetium may condense as a metallic aerosol, being instantly passivated by
297
condensed carbon (Senden et al., 1997).
298
Our data support the assumption that the generation of Technegas nanoparticles
299
is driven by a mechanism quite similar to aerosol produced by spark discharge
300
generators. Technegas nanoparticle generation could be therefore explained by a
301
simultaneous ablation of technetium and graphite, caused by the striking of an
302
alternative current arc from the thermionic plasma inside the crucible (Vita Medical
303
Ltd., 2000). 99mTc labeled nanosized carbonaceous particles appear mainly to result
304
from nucleation/condensation during the burning step followed by coagulation
305
processes during the residence time in the expansion chamber. Nevertleless, these
306
mechanisms are still not entirely proven and require further investigations.
307
All the operating conditions of the Technegas generator (i.e. simmer, burn duration,
308
burn temperature and aerosol residence time) show an influence on the particle size
309
distribution (Figure 6). A decrease of aerosols AMAD was observed with increasing
Page 15
simmer and burn durations. These parameters apparently facilitate ablation and
311
condensation phenomena and thus contribute to the AMAD reduction. Although the
312
simmer and burn duration had some impact on the particle size distribution, stronger
313
modifications were observed by adjusting on the residence duration in the expansion
314
chamber and the burn temperature. Longer residence times obviously lead to
315
coagulation and a higher AMAD (Table 2, Figure 7). This result confirms the relative
316
instability of freshly radiolabelled nanoparticles over the timeshown in previous
317
studies (Llyod et al.,1995, Möller et al., 2006). A noticeable reduction of AMAD from
318
510 nm (GSD of 3.0) to 270 nm (GSD of 2.7) was observed for an increase of burn
319
temperature from1900°C to 2800°C. Furthermore, burn temperature was the
320
parameter which had the strongest influence on the total aerosol radioactivity (Figure
321
8). As the burn temperature plays a major role on the output of Technegas device, an
322
optimized method has been proposed which is based on a temperature of 1900°C
323
followed by 2800°C to reduce the AMAD (Figure 9).
324
Finally, we demonstrate that the absence of sodium chloride in the initial
325
pertechnetate eluate does not significantly modify the particle size distribution (AMAD
326
of 200 nm) compared to usual NaCl pertechnetate eluate (Figure 9). This result
327
suggests that NaCl crystals generated using NaCl Tc-eluate are poorly radiolabelled
328
compared to carbonaceous nanoparticles. Previous studies (Moller et al., 2006,
329
Wiebert et al., 2006a, 2006b) demonstrated that the removal of NaCl from 99m
Tc-330
sodium pertechnetate also yielded low leaching rates of radiolabel from particles of
331
below 4% within 24h, and also guaranteed non-hygroscopic aerosol properties. The
332
removal of NaCl from the Tc-eluate therefore seems to have several advantages.
333 334
Page 16
Conclusion
335
The particle size distribution of the Technegas generator has been characterized
336
from combined measurements of radioactivity (using a gamma camera) and
337
aerodynamic sizing (using ELPI). Under standard clinical operating conditions,
338
Technegas shows a radioactivity median aerodynamic diameter (AMAD) of 450 nm
339
(GSD of 3.4). The particle size distribution and the total radioactivity of the aerosol
340
are mostly influenced by the burn temperature. We proposed an optimized procedure
341
to produce radiolabelled nanoparticles using the commercial Technegas generator
342
consisting of two consecutive burns at 1900°C and 2800°C. Under optimized
343
conditions, the median diameter of Technegas can thereby be reduced by half (250
344
nm), together with a substantial increase of its radiolabelled nanoparticle population.
345
Aerosols containing a greater amount of radiolabelled nanoparticles may permit
346
better particle deposition within the respiratory tract. In this context an improvement
347
of lung ventilation scintigraphy in nuclear medicine is conceivable. These new
348
insights appear also valuable to assess deposition patterns of well-defined
349
nanoparticles within the respiratory tract, in the case of inhalation toxicology and drug
350
delivery by aerosol therapies. Finally, the proposed approach to optimize the
351
generation of radioactive nanosized aerosol using the technegas generator can be
352
coupled with other previous modifications such as a higher stable radiolabelling over
353
time by removing NaCl from the Tc-eluate, or the possibility of 111In/68GaCl3
354
labbelling, to enhance alveolar pattern deposition and provide potential clinical
355
improvements on inhalation studies.
356 357
Page 17
ACKNOWLEDGEMENTS
358
The authors would like to acknowledge the financial support of the Regional
359
French Association for Aid to Chronic Respiratory Failure Patients (ARAIR),
Saint-360
Etienne Métropole and the Conseil Général de la Loire, as well as the helpful
361
conversations and experimental support of the Cyclopharma Laboratoires (France).
362
The authors would like also to thank the editor for all corrections and helpful
363
comments which greatly contribute to this paper. Finally, special thanks to Laurent
364
Navarro (Ecole Nationale Supérieure des Mines de Saint-Etienne, Centre Ingénierie
365
et Santé, France) for his contribution to the image analysis and algorithm
366
development on SEM images.
367 368
Page 18
REFERENCES
369
Borges, J.B., Velikyan, I., Langström, B., Sörensen, J., Ulin, J., Maripuu, E.,
370
Sandström, M., Widström, C., Hedenstierna, G. (2011). Ventilation distribution
371
studies comparing Technegas and “Gallgas” using 68GaCl3 as the label. Journal of
372
Nuclear Medicine, 52, 206-209. 373
374
Burch, W.M., Sullivan, P.J., McLaren, C. (1986). Technegas – a new ventilation
375
agent for lung scanning. Nuclear Medicine Communications, 7, 865-871.
376 377
Carvalho, T.C., Peters, J.I., and Williams, R.O. (2011)Influence of particle size on
378
regional lung deposition – What evidence is there? International Journal of
379
Pharmaceutics, 406, 1-10. 380
381
Dekati Ltd. ELPI in pharmaceutical measurements. In: Dekati Ltd Application Note.
382
2007.
383 384
Evans, D.E., Harrison, R.M., Ayres J.G. (2003). The generation and characterization
385
of elemental carbon aerosols for human challenge studies. Journal of Aerosol
386
Science, 34, 1023-1041. 387
388
Fuchs, N. (1963) On the stationary charge distribution on aerosol particles in a
389
bipolar ionic atmosphere. Geofisica Pura e Applicata, 56, 185-193.
390 391
Page 19
Jögi, J., Jonson, B., Ekberg, M., Bajac, M. (2010). Ventilation-Perfusion SPECT with
392
99mTc-DTPA versus Technegas: A head-to-head study in obstructive and
393
nonobstructive disease. Journal of Nuclear Medicine, 51, 735-741
394 395
Lemb, M., Oei, T.H., Eifert, H., Günther, B. (1993). Technegas: a study of particle
396
structure, size and distribution. European Journal of Nuclear Medicine, 20, 576-579.
397 398
Lloyd, J.J., Shields, R.A., Taylor, C.J., Lawson, R.S., James, J.M., Testra, H.J.
399
(1995). Technegas and Pertechnegas particle size distribution. European Journal of
400
Nuclear Medicine, 22, 437-476 401
402
Marjamäki, M., Keskinen, J., Chen, D.R., Pui, D.Y.H. (2000). Performance evaluation
403
of the electrical low-pressure impactor (ELPI). Journal of Aerosol Science, 31,
249-404
261.
405 406
Möller, W., Felten, K., Seitz, J., Sommerer, K., Takenaka, S., Wiebert, P., Philipson,
407
K., Svartengren, M., Kreyling, W.G. (2006). A generator for the production of
408
radiolabelled ultrafine carbonaceous particles for deposition and clearance studies in
409
the respiratory tract. Journal of Aerosol Science, 37, 631-644.
410 411
Sanchez-Crespo, A., Klepczynska-Nyström, A., Lundin, A., Larsson, B.M.
412
Svartengren, M. (2011). Indium-labeledultrafine carbon particles; a novel aerosol for
413
pulmonary deposition and retention studies. Inhalation Toxicology, 23,121-128.
414 415
Page 20
Senden, T.J., Moock, K.H., Gerald, J.F., Burch, W.M., Browitt, R.J., Ling, C.D., and
416
Heath, G.A. (1997). The physical chemical nature of Technegas. Journal of Nuclear
417
Medicine, 38, 1327-1333. 418
419
Strong, J.C., Agnew, J.E. (1989). The particle size distribution of Technegas and its
420
influence on regional lung deposition. Nuclear Medicine Communications, 10,
425-421
430.
422 423
Virtanen, A., Marjamäki, M., Ristimäki, J., Keskinen, J. (2001). Fine particle losses in
424
electrical low-pressure impactor. Journal of Aerosol Science, 32, 389-401.
425 426
Vita Medical Ltd. Technegas Service Manual Document N°70305. 2000:P2-4.
427 428
Wiebert P., Sanchez-Crespo A., Falk R., Philipson K., Lundin A., Larsson S., et al.
429
(2006a). No significant translocation of inhaled 35-nm carbon particles to the
430
circulation in humans Inhalation Toxicology 18, 741–747.
431 432
Wiebert, P., Sanchez-Crespo, A., Seitz, J., Falk, R., Philipson, K., Kreyling, W. G.,
433
Moller, W., Sommerer, K., Larsson, S., and Svartengren, M. (2006b). Negligible
434
clearance of ultrafine particles retained in healthy and affected human lungs.
435
European Respiratory Journal, 28, 286-290. 436
437 438
Page 21
TABLES LEGENDS
440
TABLE 1. Influence of generator mode and ELPI collection substrates on aerosols
441
particle size distributions: radioactivity median aerodynamic diameters (AMAD) and
442
geometric standard deviation (GSD).
443
TABLE 2. Radioactivity median aerodynamic diameters (AMAD) and geometric
444
standard deviation (GSD) under standard clinical operating conditions, or under
445
modified and optimized operating conditions (modified generation parameters in
446
bold).
447
448
Page 22
FIGURES LEGENDS
450
FIGURE 1. Schematic diagram of the Technegas generator.
451
FIGURE 2. Operating conditions of the Technegas generator: description of analyzed
452
parameters.
453
FIGURE 3. EDX analysis coupled with SEM observation of ELPI stage showing
454
carbonaceous nanoparticles (A) and NaCl crystals (B). Linear correlation between
455
geometric diameter obtained by image analysis on SEM images and corresponding
456
mid-point aerodynamic diameter determined by ELPI.
457
FIGURE 4. Aerodynamic size distributions of aerosol generated under standard
458
clinical operating mode: differential distributions from ELPI calculations (top) and
459
cumulative distributions from combined ELPI and gamma-camera measurements
460
(bottom).FIGURE 5. Radiolabelling efficiency expressed as radioactivity per mass of
461
particle.
462
FIGURE 5. Radiolabelling efficiency expressed as activity per particle mass.
463
FIGURE 6. Operating parameters influencing Technegas aerodynamic particle size
464
distribution. Clinical operating conditions are used as a reference (distribution in black
465
bold line).
466
FIGURE 7. SEM images of particles deposited on ELPI stage corresponding to
mid-467
point aerodynamic diameter of 2.39 µm for residence times of (A) 30 seconds and (B)
468
10 minutes. Arrows indicate agglomerated particles.
469
FIGURE 8. Total radioactivity of evaluated radio-aerosols: influence of operating
470
parameters ( * : Values are not significantly different, p<0.05).
Page 23
FIGURE 9. Technegas aerodynamic particle size distribution: comparison between
472
standard clinical production, optimized production and optimized production using
473
NaCl free-eluate.
474
Page 1
FIGURE 1. Schematic diagram of the Technegas generator.
1
2
Page 2
FIGURE 2. Operating conditions of the Technegas generator in the maintenance
4
mode : description of analyzed parameters.
5 6 7 SIMMER STAGE Argon atmosphere Duration (6, 10 and 15 minutes) BURN STAGE Aerosol generation Temperature (1900, 2200, 2500 and 2800°C) Duration (2, 5, 10 and 15 seconds) RESIDENCE TIME Aerosol storage (0.5, 1, 2 and 10 minutes) AEROSOL DELIVERY
Page 3
FIGURE 3. EDX analysis coupled with SEM observation of ELPI stage showing
8
carbonaceous nanoparticles (A) and NaCl crystals (B). Linear correlation between
9
geometric diameter obtained by image analysis on SEM images and corresponding
10
mid-point aerodynamic diameter determined by ELPI.
11
12
13 14
Page 4
FIGURE 4. Aerodynamic size distributions of aerosol generated under standard
15
clinical operating mode: differential distributions from ELPI calculations (top) and
16
cumulative distributions from combined ELPI and gamma-camera measurements
17
(bottom).
18
19
Page 5
FIGURE 5. Radiolabelling efficiency expressed as activity per particle mass.
21
22
Page 6
FIGURE 6. Operating parameters influencing Technegas aerodynamic particle size
24
distribution. Clinical operating conditions are used as a reference (distribution in black
25
bold line).
26
27
Page 7 29
30 31
Page 8
FIGURE 7. SEM images of particles deposited on ELPI stage corresponding to
mid-33
point aerodynamic diameter of 2.39 µm for residence times of (A) 30 seconds and (B)
34
10 minutes. Arrows indicate agglomerated particles.
35
36 37
Page 9
FIGURE 8. Total radioactivity of evaluated radio-aerosols: influence of operating
38
parameters ( * : Values are not significantly different, p<0.05).
39
40
Page 10
FIGURE 9. Technegas aerodynamic particle size distribution: comparison between
42
standard clinical production, optimized production and optimized production using
43
NaCl free-eluate.
44
TABLE 1. Influence of ELPI collection substrates on aerosols particle size
distributions: radioactivity median aerodynamic diameters (AMAD) and geometric
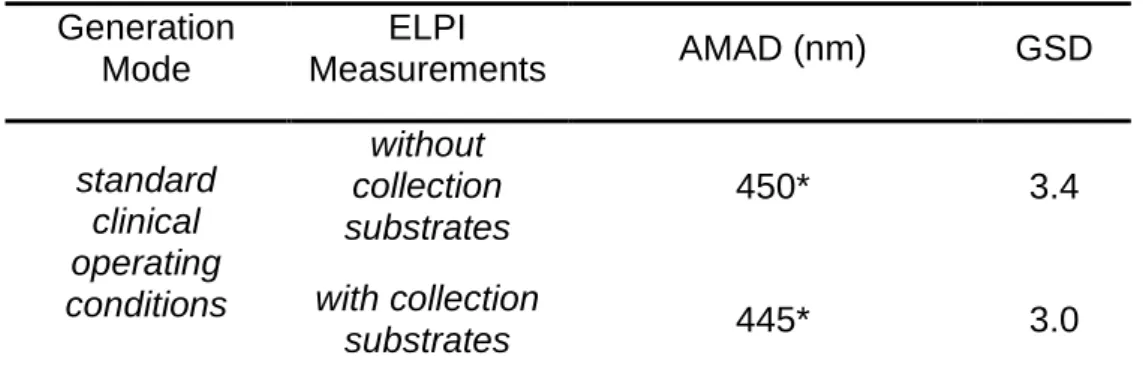
standard deviation (GSD). Generation Mode ELPI Measurements AMAD (nm) GSD standard clinical operating conditions without collection substrates 450* 3.4 with collection substrates 445* 3.0
TABLE 2. Radioactivity median aerodynamic diameters (AMAD) and geometric
standard deviation (GSD) under standard clinical operating conditions, or under
modified and optimized operating conditions (modified generation parameters in
bold).
Analyzed parameters
Generation parameters Particle size distribution
Simmer duration (min) Burn duration (s) Synthesis temperature (°C) Residence time (min) AMAD (nm) GSD Standard 6 5 2500 2 450 2.7 Simmer duration 10 5 2500 2 380* 2.1 15 5 2500 2 305 2.2 Burn duration 6 2 2500 2 500 3.2 6 10 2500 2 385* 2.5 6 15 2500 2 370 2.9 Synthesis temperature 6 5 1900 2 510 3.0 6 5 2200 2 420 2.5 6 5 2800 2 270 2.7 Residence time 6 5 2500 0.5 285 2.8 6 5 2500 1 380* 2.5 6 5 2500 10 540 2.6 Optimized 6 10 1900°C followed by 2800°C 2 250 2.5