Publisher’s version / Version de l'éditeur:
Proceedings of the ISPRS Commission V Mid-Term Symposium 'Close Range
Image Measurement Techniques', 38, 5, pp. 428-433, 2010-06-22
READ THESE TERMS AND CONDITIONS CAREFULLY BEFORE USING THIS WEBSITE. https://nrc-publications.canada.ca/eng/copyright
Vous avez des questions? Nous pouvons vous aider. Pour communiquer directement avec un auteur, consultez la
première page de la revue dans laquelle son article a été publié afin de trouver ses coordonnées. Si vous n’arrivez pas à les repérer, communiquez avec nous à [email protected].
Questions? Contact the NRC Publications Archive team at
[email protected]. If you wish to email the authors directly, please see the first page of the publication for their contact information.
NRC Publications Archive
Archives des publications du CNRC
This publication could be one of several versions: author’s original, accepted manuscript or the publisher’s version. / La version de cette publication peut être l’une des suivantes : la version prépublication de l’auteur, la version acceptée du manuscrit ou la version de l’éditeur.
Access and use of this website and the material on it are subject to the Terms and Conditions set forth at
A distance protocol for mid-range TLS in support of ASTM-E57
standards activities
Mak, Nikolai; Beraldin, J.-Angelo; Cournoyer, Luc; Picard, Michel
https://publications-cnrc.canada.ca/fra/droits
L’accès à ce site Web et l’utilisation de son contenu sont assujettis aux conditions présentées dans le site LISEZ CES CONDITIONS ATTENTIVEMENT AVANT D’UTILISER CE SITE WEB.
NRC Publications Record / Notice d'Archives des publications de CNRC:
https://nrc-publications.canada.ca/eng/view/object/?id=3c80d027-8eab-42bc-9114-dbc72c092c26
https://publications-cnrc.canada.ca/fra/voir/objet/?id=3c80d027-8eab-42bc-9114-dbc72c092c26
A DISTANCE PROTOCOL FOR MID-RANGE TLS IN SUPPORT OF
ASTM-E57 STANDARDS ACTIVITIES
Nikolai Mak, J.-Angelo Beraldin, Luc Cournoyer, Michel Picard
Institute for Information Technology (IIT), National Research Council Canada (NRC), Ottawa, ON, K1A 0R6, Canada
Commission V, WG V/1
KEY WORDS: 3D, distance, imaging system, LIDAR, method, metrology, uncertainty
ABSTRACT:
We present experimental results with uncertainty analysis method for a proposed distance measurement protocol for mid- range terrestrial laser scanners (TLS). Three-dimensional (3D) imaging systems evaluation is performed in the environmentally controlled laboratory at NRC-IIT with the use of specially designed reference test object (RTO), test procedures and mathematical methods. The procedure is based on the evaluation of point-to-point distance measurements. The distance measurements characterizing a system under test (SUT) are taken between comparative points of reference (CPOR) located on the RTO plane surfaces. Selected CPORs are the intersections of particular lines of measurements with estimated RTO plane surfaces. The virtual lines of measurement are determined by using a spherical RTO. Uncertainty analysis for fitted planes, virtual lines of measurements and CPORs is performed with our software utilities especially created for this purpose. Data on commercial products are provided for the sake of illustrating the proposed protocol.
1. Introduction
Active optical three-dimensional (3D) imaging sensors have become common instruments for dimensional metrology since they give a set of advantages to both industrial and research communities. 3D imaging systems are measuring instruments and the spatial coordinates they provide are only estimates of the surfaces being sampled. The measurements need to be completed by quantitative statement about their uncertainty in order to be meaningful. In particular, this statement is required when we need to judge the consistency of experiment/theory, of different measurement procedures, and of different laboratories (ISO/IEC 98-1:2009). Methods for medium and long-range scanners characterization were recently described by (Beraldin J.-A., 2009), (Bridges, 2009) and proposed to the ASTM (American Society for Testing and Materials) 3D imaging systems standards committee E57. Our aim is to further advance test methods for 3D imaging systems characterization. We describe an uncertainties analysis method and results for an already proposed distance measurement protocol (Beraldin J.-A., 2009). We also present a general discussion on the 3D imaging systems distance protocol approach including selection of RTO and test methods. The proposed method of geometrical uncertainties analysis is applicable to 3D imaging systems as ASTM committee E57 currently defines them.
2. Uncertainty Analysis and Propagation Method
As per (ISO/IEC 98-1:2009), a measurand needs to be defined. Here, the measurand is a point-to-point distance measured in the direction along which the 3D imaging system under test acquires
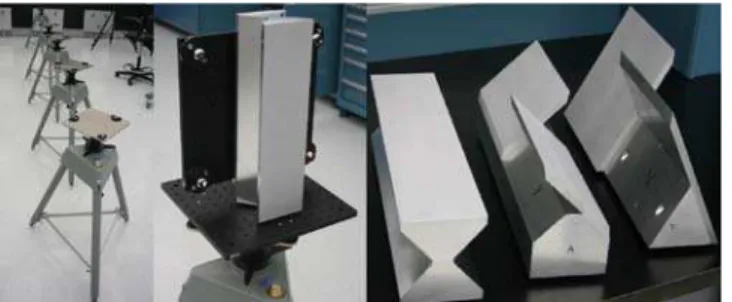
range data. The range measurements direction can also be defined as a vector passing through the center of the SUT or the center of the SUT reference frame. The distance measurements characterizing the SUT are taken between CPORs, which are defined as intersections of a particular line of measurements with RTO plane surfaces estimates at different locations through the test range. RTOs and laboratory test stages are presented in Figure 1.
Figure 1. Reference Test Objects and test stages
The RTO plane surface estimation is an optimally fitted plane to multiple measured points of the RTO surface. The line of measurements is defined by two points in space. These points are located at the beginning and at the end of the test range. A special fiducial target, i.e. sphere was measured and then estimated by fitting on the closest and then on the farthest test stages, see Figure 2. (Beraldin J.-A., 2009) presents detailed description of the test method, its procedural steps and related instrumentation.
Figure 2. Definition of the line of measurements
The proposed test method does not require a perfect alignment of RTOs with respect to each other and with the line of measurements, since CPORs are located exactly on the line of measurements by definition. The error ��� for a distance measured between the first and the (i + 1) stage, as depicted in Figure 3
,
and RTO plane with an angle index j is defined in Eq. (1).
��� =���� ��− ���� (1)
���� �� , ���� - the distance measurements from the SUT and the reference instrument correspondingly.
Figure 3. Distance measurements between stages.
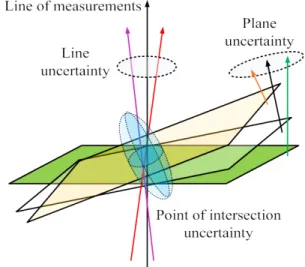
Data processing in this test method includes plane and sphere fitting, definition of lines of measurements and of CPORs. The main sources of uncertainties considered here are following: point measurements or raw data uncertainty, fitted planes uncertainty, fitted spheres uncertainty for shape and location, line of measurements uncertainty, and CPOR coordinates uncertainty ( see Fig. 4).
Figure 4. Diagram representation of Comparative Points of Reference (CPOR) uncertainty.
Uncertainties of point measurements for the reference instrument are taken from the reference instrument specification as well as from its calibration certificate. Reference instrument certification provides traceability of the measured values. Further uncertainty propagation is performed with the use of standard methods presented by (Forbes, 2006b), (Stirzaker & Grimmett, 2001), (ISO, 2008) combined with the knowledge of functions and methods used for data processing. The resulting uncertainty is a combined standard uncertainty. The uncertainty of fitted planes is presented by uncertainties of four plane coefficients. The reference line uncertainty comprises uncertainty of two points - spherical RTO centers from sphere fitting. The uncertainty of CPOR - an intersection of the fitted plane and the line of measurements, is defined by uncertainties of ten parameters: four plane coefficients and six coordinates of two points defining the line of measurements.
2.1 Raw Data Uncertainty
A 3D imaging system can be described as an instrument that measures spherical coordinates of a point or a set of points in 3D space. 3D images are produced by collecting multiple point measurements and combining them into a single picture - point cloud. The original raw data set obtained by the 3D imaging system is a 3N×1 vector ρ = [ρ1, ρ2, … ρN ]T, where ρi = (ri, θi, φi),
i = 1 ... N. Vector ρi components (ri, θi, φi) denotes, respectively,
radial distance, elevation (inclination), and azimuth. Same data set in the Cartesian coordinate frame is a 3N×1 vector τ = [τ1, τ2, …
τN]T, where τi = (xi, yi, zi), i = 1...N. Spherical and Cartesian
coordinates of points and coordinate frames are denoted according to ISO standard (ISO, 2009). Transformation between two coordinate systems is presented in Eq. (2)
� = � sin � cos � � = � sin � sin � � = � cos � (2) The two coordinate systems have the same origin. The spherical reference plane is the Cartesian x–y plane. The inclination angle θ is measured from the z direction, and the azimuth angles are measured from the Cartesian x-axis. The uncertainty of a single point measurement in spherical coordinates ��� is presented by Eq. (3) ��� =� ���(��) ���(��,��) ���(��,��) ���(��,��) ���(��) ���(��,��) ���(��,��) ���(��,��) ���(��) � (3) We assume that range and angular measurements are independent from each other. The uncertainty matrix �� for the raw data vector ρ in a general form is constructed as following:
�� =�
��1 ⋯ 0
⋮ ⋱ ⋮
0 ⋯ ����
(4)
We further suggest that measurements at different points in space are independent also, see Eq. (5).
������,��� = 0, ��� � ≠ � ������,��� = 0, ��� � ≠ �
������,��� = 0, ��� � ≠ � ������,��� = 0 ∀ �, �
������,��� = 0 ∀ �, � ������,��� = 0 ∀ �, � (5)
The Jacobian matrix for coordinate transformation and uncertainty propagation from spherical to Cartesian systems of a single point
ρi measurement is given in Eq. (6).
����� =�
sin��cos�� ��cos��cos�� −��sin��sin�� sin��sin�� ��cos��sin�� ��sin��cos��
cos�� −��cos�� 0
� (6) The Jacobian matrix ��� for the data vector ρ = [ ρ1, …, ρN]Τ is
given in Eq. (7) as a block diagonal matrix with �����, i = 1 ... N matrix on its diagonal.
��� = �
��1�1 ⋯ 0
⋮ ⋱ ⋮ 0 ⋯ �����
� (7) The uncertainty of point cloud in Cartesian coordinates from raw data uncertainties is calculated as presented in Eq. (8).
�� =��������� (8) Usually data collected in spherical coordinates are then converted into Cartesian coordinates for further processing. Many scanners naturally adopt spherical coordinate system as a primary operational reference frame based on the opto-mechanical design. If the raw data measurements are produced by a 3D imaging system such as a coordinate measuring machine in Cartesian coordinates, then there is no need to transform raw data uncertainty. A general expression for uncertainty of a single measurement in Cartesian coordinates τi is presented in matrix
form in Eq. (9). ��� =� ���(��) ���(��,��) ���(��,��) ���(��,��) ���(��) ���(��,��) ���(��,��) ���(��,��) ���(��) � (9) Assuming that measurements are independent from point to point in the data vector τ, we construct a block diagonal uncertainty matrix Eq. (10) similar to Eq. (7).
�� = �
��1 ⋯ 0
⋮ ⋱ ⋮ 0 ⋯ ����
(10)
2.2 Fitted plane parameters uncertainty
The RTO plane shape and location are reconstructed or obtained by optimal fitting of an infinite plane to the measured 3D data with associated uncertainties. A general equation for a plane in 3D space is presented in Eq. (11).
�� + �� + �� + � = 0 (11) Normalized general equation (11) has �2+�2+�2= 1. A
distance between the point τi = (xi, yi, zi) and the plane in Eq. (11)
with the parameter vector p = [p1, p2, p3, p4] T
= [A, B, C, D]T is given by Eq. (12).
��(��,�) = ���+���+���+� (12)
A solution method for infinite plane fitting to 3D data can be found in references (Aitken, 1935), (Feddema & Little, 1997), (Watson, 2002), (Weingarten, Gruener, & Siegwart, 2004), (Forbes, 2006a) ; however, selection of an optimal plane fitting methods was not a subject of our analysis. We performed uncertainty evaluation for a plane fitting method that approaches performance of the commercial software utilities used. A brief comparative analysis of plane fitting errors such as standard deviation and mean squared error allowed to suggest orthogonal distance regression (ODR) as a representative for the optimal fitting of a plane to the data. The ODR problem is to find estimations for the parameter vector p minimizing the value of the cost function �(�, �) in Eq. (13).
�(�, �) = ∑��=1�2�(��,�) (13)
The vector p is an optimal solution minimizing cost function in Eq. (13) if it satisfies Eq. (14) for function F(τ, p).
�(�, �) = ����
����
�
�(�, �) = 0 (14) Our task is to obtain uncertainty metric for the plane fitting ODR for a point cloud consisting of N 3D points. The system of N non-linear equations in Eq. (14) implicitly defines p as a function of τ. With the use of mathematical instruments for ODR problem presented by (Forbes, 2006b), the uncertainty matrix Up for
parameter vector p can be written as presented in Eq. (15). ��= �−1��� �����(�−1)� (15) where ����� = ���� ���� , ����� = � ��� ���� , ����� = � ��� ����
2.3 Line Coefficients and CPOR Uncertainties
A parametric form equation for a line R0 defined by two points
�� = [��,��,��]� and �� = [��,��,��]� in 3D space is
presented in Eq. (16).
�0=��+�(��− ��) (16)
The point of intersection �∗ for the line of measurements defined by Eq. (16) and the plane in Eq. (11) is given by Eq. (17)
The uncertainties of �∗ vector coordinates as a function �(�) of a ten-dimensional vector � = [��,��,��,��,��,��,�, �, �, �] are calculated according to expression in Eq. (18).
���
��� �
‖Σ‖ ������ (18) These uncertainties are combined into the final standard uncertainty for the distance measurements as recommended by (ISO, 2008).The term ‖Σ‖ is a covariance matrix for the ten-dimensional vector � constructed from knowledge of estimations for points ��, ��, plane parameters p and knowledge of their statistical relations.
3. Experimental Results
The experimental setup and procedural steps were described by (Beraldin J.-A., 2009). We repeated the experiment and performed the uncertainty analysis according to mathematics presented above in order to complete and advance the proposed test method. The 3D imaging systems' performance evaluation is performed in the environmentally controlled lab with the use of specially designed RTO, test procedures and mathematical methods. In our work, we used PolyworksTM from InnovMetric Software Inc., CAM2TM
software from FARO Technologies Inc. for fitting primitives to 3D data, and MathcadTM for uncertainty analysis. Faro Laser Tracker Model X, ADM option from FARO Technologies Inc. was used as a reference instrument. It is certified for compliance to maximum permissible error (MPE) of performance parameters according to ASME B89.4.19 standard (ASME, 2006). The reference measurements of RTO location, pose and surfaces are performed with the use of standard 1.5" FARO spherical mounted retro-reflector (SMR) and standard 7/8" SMRs. The 3D imaging SUT is a laser scanner Surphaser® model HS25X, MR configuration. It is a hemispherical time-of-flight phase shift laser scanner with 360°×270° field of view in horizontal and vertical direction respectively. The performance parameters for the SUT from the manufacturer’s specification as well as the FARO laser tracker specification are presented in reference (Beraldin J.-A., 2009).
The thermal expansion or contraction induced errors and related effects are neglected in our analysis as insignificant. Thermal variance of the optical path in the transverse direction is near zero. The laboratory temperature is maintained at constant level with 0.2ºC peak to peak variation. The optical path variance temperature in radial direction gives about 0.9 µm peak-to-peak error, which is treated as negligible for our analysis. For the simplicity of testing, a billiard ball was used as a spherical RTO. According to Billiard Congress of America (Billiards Congress of America, 2004), and World Pool-Billiard Association (WPA, 2001) equipment specifications, the diameter for a billiard ball may be of 2.25 in. (5.715 cm), ±0.005 in. (0.127 mm). The uncertainty for the points a and b coordinates in Eq. (18) comes
from: individual measurements of points on spheres with the use of SMR - sphericity of SMR and the laser tracker measurement errors, shape of RTO spheres from manufacturing, sphere fitting method used by the commercial software utility. A fitted sphere centroid uncertainty is estimated as an upper bound of feasible deviation. It is estimated to be not worse than uncertainty of a single point measurement with the use of an SMR and the laser tracker. The optical effects of translucent material ranging uncertainty as well as non-linear geometrical errors of optical measurements for a variable slope surface are not considered here. A worst-case estimation for the spherical RTO centroid location 1σ uncertainty at two ranges - 1.5m and 9m is 45µm and 63.5µm respectively. The experiment used image alignment procedure in order to compensate for some small but noticeable drift of the SUT measurements with time. Interpolation of 3D images was performed in PolyworksTM software in order to align 3D images taken by the SUT at different time instances and to mitigate influence of angular measurements error on the distance measurements.
RTO planes at 0º 40º 60º for stages Error ���, mm
Line N1 1 - 2 1.055 0.802 0.735 1 - 3 0.739 0.419 0.408 1 - 4 0.981 0.403 0.385 1 - 5 0.548 0.489 0.649 RTO planes at 0º -40º -60º Line N3 1 - 2 0.966 1.004 0.854 1 - 3 0.597 0.955 0.789 1 - 4 0.754 1.119 1.265 1 - 5 0.332 0.977 1.348 Table 1. Measured distance errors.
Distance measurements errors for RTO with a plane at 0º, ±40º and ±60º are presented in Table 1. The uncertainties for distance measurements from the reference instrument are presented in Table 2.
Distance between
stages 1 - 2 1 - 3 1 - 4 1 - 5 Plane Index / Angle Uncertainty, mm
1 0º 0.085 0.085 0.095 0.111 2 40º 0.1 0.101 0.114 0.132 3 -40º 0.099 0.1 0.112 0.131 4 60º 0.14 0.141 0.16 0.185 5 -60º 0.136 0.138 0.155 0.181 Table 2. Estimated uncertainties for the reference instrument.
The combined standard uncertainties (1σ) for distance measurements from the SUT are presented in Table 3.
Distance between stages 1 - 2 1 - 3 1 - 4 1 - 5 Plane Index / Angle Uncertainty, mm
1 0º 0.827 0.791 0.816 0.886 2 40º 0.941 0.897 0.931 1.011 3 -40º 0.943 0.914 0.956 1.017 4 60º 1.248 1.185 1.231 1.348 5 -60º 1.233 1.172 1.271 1.456 Table 3. Estimated uncertainties for the system under test.
An upper bound estimation of a linear interpolation error is taken as a worst-case estimation for the uncertainty introduced by the interpolation into the test method. Interpolation in PolyworksTM
was performed with the filter rejecting points with the local surface normal vector angles greater than 75º. One sigma uncertainty introduced by linear interpolation on 1mm grid for 1.125in radius of curvatures is 144µm.
We can see that the distance measurements uncertainties for the SUT being calculated as described above is an upper bound estimation for the errors of the experiment. We can conclude that the system specification is correctly given for the flat targets case.
4. Discussion
The proposed selection of CPORs allows for a reduction of procedural complexity. In particular, it reduces the amount of manual alignment operations required before the testing. Only coarse, alignment before testing is necessary since the method does not depend on the strict parallelism, levelling or orthogonality of RTO, lines of measurements and other components. The proposed method of uncertainty analysis can be used for any spatial arrangement of the test RTOs, SUT and the reference instrument. It is not limited by assumption regarding the nature of raw measurements uncertainty dependence and correlation. If the uncertainty matrices �� in Eq. (4) and �� in Eq. (10) have non-zero off diagonal elements, then proposed uncertainty analysis methods maintains its validity. Therefore, the assumption made for the analysis does not limit the generality of the proposed method.
Non-linear least squares minimization problem presented in Eq. (13) is usually solved by using Gauss - Newton algorithm. The uncertainty propagation method presented is valid for any least squares optimal plane fitting technique using Gauss - Newton algorithm. In fact Eq. (15) is applicable to any non-linear least squares fit of a model to data. When fitting primitives like planes and sphere with the use of some commercial software, it is very important to know the mathematical description of the optimal fitting procedures used in order to perform appropriate uncertainty propagation. It may be necessary to certify commercial software used for the testing procedures or to specify particular fitting
procedures as a part of the standard in order to assure correct uncertainty evaluation for the measurands.
It is envisioned that the reference test objects for ranging tests have to describe as complete as possible variety of parameters affecting performance of the 3D imaging SUT. Eventually the test method standard has to recommend a set of RTO objects or designs with defined parameters for the use with prescribed test procedures for various SUTs. The test methods proposed in (Beraldin J.-A., 2009) and (Bridges, 2009) use exact fixed angles: 00, ±400 and ±600 for RTO planes. There is no particular reason to prefer those angles. In a manner similar to the selection of test ranges, we propose to choose test angles from four angular intervals within the full interval [00, 900] instead of fixed angles. It
translates into the following intervals: 00 - 22.50, 22.50 – 450, 450 –
67.50, and 67.50 – 900. This reduces unnecessary complexity of accurate angular alignment of the RTO in the laboratory without reducing capabilities of the test setup. Since the 3D systems under test perform scanning of the RTOs, a finite time interval for measurements acquisition can introduce additional uncertainty due to local slope and range variation of the sampled surface. We also propose to consider the fastest scan direction as a parameter for tests in order to make sure that RTOs challenge the fastest direction of the scan. We also propose to consider a test parameter such as sufficient statistical power and minimal required sample size for SUT estimation in relation to the scan pattern, or sampling density and the dimensions of RTO as a function of range.
Our approach to definition of a test method and selection of RTO is guided by combination of such factors as uncertainty, complexity and universalism of the test method, related instrumentation and data processing. Therefore, it is proposed here to use these criteria when comparing test methods and setups. Test methods for a 3D imaging system characterization need to have correct knowledge of the uncertainty for the reference instrument, RTO and other instrumentation used during the testing, data processing methods and spatial arrangement in order to propagate properly uncertainties of the raw measurements to the final uncertainty of the measurand. Thus, not only traceability of the reference instrument measurements is required, but also correct knowledge and understanding of the methods and experimental setup.
5. Conclusions
This paper presents an uncertainty evaluation procedure augmenting proposed by (Beraldin J.-A., 2009) test method to a complete instrument for distance measurements characterization of 3D imaging systems. Key features of the test method and uncertainty analysis considered in this paper are following:
• Selection of the CPOR does not require strict alignment of targets. It is not necessary to establish relation between the reference frames of the SUT and the reference instrument.
• The proposed general approach to the uncertainty analysis allows accommodating a class of fitting methods and a class of reference test objects. The test method and uncertainty analysis maintains its integrity for any spatial arrangement of RTOs, SUT and the reference instrument. The uncertainty analysis method demonstrates consistent estimation of the real SUT distance measurements uncertainties.
• The formal mathematical algorithms are ready for implementation in any high level programming languages. The uncertainty analysis for the proposed method as it is presented can be implemented as a software utility for the purpose of standardization and for facilitating its usage by the industrial community.
• The proposed protocol assures adequate verification of distance measuring capability of the SUT for a representative set of RTOs. It is compatible with the oncoming standard from ASTM E57 for the distance measurements of 3D imaging system. NRC IIT has environmentally controlled laboratory as described by (Beraldin J.-A., 2009), complete hardware setup and algorithms for proposed distance measurements testing of 3D imaging systems and related uncertainty analysis.
6. References
References from Journals:
Forbes, A., 2006a. Surface fitting taking into account uncertainty structure in coordinate data. Measurement Science and
Technology , 17(3) ,pp. 553 - 558.
Forbes, A., 2006b. Uncertainty evaluation associated with fitting geometric surfaces to coordinate data. Metrologia , V. 43, pp. S282-S290.
Watson, G.A., 2002. On the Gauss–Newton method for l1 orthogonal distance regression. IMA Journal of Numerical
Analysis, 22(3),pp. 345 - 357.
References from Books:
Ayyub, B.M., and G.J. Klir., 2006. Uncertainty Modeling and
Analysis in Engineering and the Sciences. Chapman & Hall.
Billiards Congress of America., 2004. The official rules and
records book. Colrado Springs, CO.
Stirzaker, G., and D Grimmett., 2001. Probability and Random
Processes. Oxford University Press.
References from Other Literature:
Aitken, A. C., 1935. On Least Squares and Linear Combinations of Observations. Edinburgh: Proceedings of the Royal Society of Edinburgh, Vol. 55, pp. 42–48.
ASME. B 89.4.19., 2006 Performance evaluation of laser-based
spherical coordinate measurement systems. American Society of
Mechanical Engineers.
Beraldin, J.-A., Cournoyer L., Picard M., Blais F., 2009. Proposed procedure for a distance protocol in support of ASTM-E57 standards activities on 3D imaging. SPIE Elctronic Imaging
Science and Technology: Three-dimensional imaging metrology.
San Jose, California, USA: Society of Photo-Optical Instrumentation Engineers (SPIE).
Bridges, R., 2009. Ways to verify performance of 3D imaging instruments. Proceedings of the SPIE Electronic Imaging Science
and Technology. San Jose, California, USA: SPIE, pp.
72390R-72390R-13.
Feddema, J., and C Little., 1997. Rapid world modeling: Fitting range data to geometric primitives. Proceedings of IEEE
conference on robotics and automation. Albuquerque, NM: IEEE
Presspp.2807-2812.
ISO. ISO 80000-2:2009. Quantities and units -- Part 2:
Mathematical signs and symbols to be used in the natural sciences and technology. 2009.
—. "ISO/IEC 98-1:2009." Uncertainty of measurement - Part 1:
Introduction to the expression of uncertainty in measurement.
2009.
—. "ISO/IEC 98-3:2008." Uncertainty of measurement - Part 3:
Guide to the expression of uncertainty in measurement. 2008.
Weingarten, J., G. Gruener, and R. Siegwart., 2004. Probabilistic plane fitting in 3D and an application to robotic mapping.
Procedings of IEEE international conference on robotic and automation. IEEE Press, pp. 927 - 932.
References from websites:
American Society for Testing and Materials. 2010. http://www.astm.org (accessed March 17, 2010).
WPA. World pool-Billiard Association, WPA tournament table &
equipment specification. November 2001.
http://www.wpa-pool.com/index.asp?content=rules_spec (accessed March 17, 2010).