Practical Common Weight Maximin Approach For Technology Selection
17
0
0
Texte intégral
(2) M. Amini et al.. J. Fundam Appl Sci. 2014, 6(1), 31-47. 32. 1. INTRODUCTION Rapid advances in computers and engineering science have resulted in a high range of available advanced manufacturing technologies (AMTs) among which industrial robots, computer numerical control (CNC) machines, flexible manufacturing systems, automated material handling (AMH) systems can be listed. Despite the acquisition and the implementation of AMTs being very costly, manufacturers that compete in global markets seek to incorporate them into their manufacturing process due to their wide range of merits including increased flexibility, improved product quality, labor saving, fast production and delivery, etc. However, the large number of available AMTs and numerous AMT performance attributes that should be considered in the decision process, make the evaluation and selection of AMTs a very complex decision-making process, which requires the use of a robust decision methodology capable of evaluating several AMT candidates based on a number of attributes. Many justification methodologies for AMT selection necessitate the decision-maker to assign arbitrary importance weights to performance attributes. One problem with arbitrary weights is that they add subjectivity to the methodology. On the other hand, assigning weights is cumbersome since it is often quite difficult for the decision-maker to quantify their preferences on performance attributes. Furthermore, the task of assigning weights becomes more difficult as the number of performance attributes increases. Hence, a robust decision tool that does not require precise information on the importance of performance attributes from the decision-maker would facilitate the AMT evaluation process. The present paper proposes a multi-objective decision tool for industrial robot selection, which does not require subjective assessments of the decision-maker to prioritize performance attributes. For quality, productivity and safety reasons, the use of robots in industry has gained popularity in the past two decades. Robots can be programmed to keep a constant sped and a predetermined quality when performing a task repetitively. They can manage to work under conditions hazardous to human health such as excessive heat or noise, heavy load, toxic gases, etc. Therefore, manufacturers prefer to use robots in many industrial applications where repetitive, difficult or hazardous tasks need to be performed, such as assembly, machine loading, materials handling, spray painting and welding. However, the large number of existing robot options as well as the large number of attributes specifying robot performance for which industry-wide standards have not yet been determined result in a major impediment for potential robot users when deciding which robot to buy..
(3) M. Amini et al.. J. Fundam Appl Sci. 2014, 6(1), 31-47. 33. Many studies report that most widely considered performance attributes for industrial robots are load capacity, velocity, repeatability and accuracy. Repeatability and accuracy are the most easily confused attributes. Repeatability is a measure of the ability of the robot to return to the target point (the point where the robot is expected to go) and defined as the radius of the circle sufficiently large to include al points to which the robot actually goes on repeated trials. On the other hand, accuracy is a measure of closeness between the robot end effectors and the target point, and is defined as the distance between the target point and the centre of al points to which the robot goes on repeated trials. Manufacturers are more concerned with repeatability than accuracy since poor repeatability is more difficult to correct. A robot with the capability of affording heavy load at high speed and low repeatability and accuracy will contribute positively to the productivity and flexibility of the manufacturing process, which are of vital importance where rapid changes in customer needs require the introduction of new products into the market very frequently. When product design changes need to be made repeatedly, owning a high-performing robot will avoid replacement or modification. Several works that address the development of a robust decision tool enabling the potential robot user to select a high performing robot have been reported so far. A brief survey on these previous works is given in section 2. This paper contributes to the AMT selection literature by introducing a novel multi-objective decision methodology that can integrate multiple outputs such as various technical characteristics with a single input such as cost. The proposed methodology can be successfully applied, but is not limited to technology selection problems such as the determination of the best industrial robot, CNC machine or flexible manufacturing system from a feasible set of mutually exclusive alternatives. The paper is organized as follows. Section 2 provides a concise literature review on the existing decision tools for AMT evaluation. In section 3, a practical common weight MCDM methodology (Karsak & Ahiska, 2005) is presented. Section 4 presents the proposed Maximin methodology. The robustness and convenience of the proposed Maximin methodology are illustrated through a comparison with the method of Karsak and Ahiska (2005) for a technology selection problem in sections 5, 6. Finally, concluding remarks are provided in section 7.. 2. LITERATURE REVIEW Over the past several decades, manufacturers who have been faced with intense competition in the global marketplace, have invested in AMTs, such as group technology, flexible.
(4) M. Amini et al.. J. Fundam Appl Sci. 2014, 6(1), 31-47. 34. manufacturing systems, industrial robots, etc., which enable high quality and customization in a cost-effective manner. The increased concern and importance attached to AMTs by the manufacturers have consequently oriented the researchers to develop models and methodologies for evaluation and selection of AMTs. Proctor and Canada (1992), Son (1992) and, more recently, Raafat (2002) have provided comprehensive bibliographies on justification of AMTs. Meredith and Suresh (1986) have classified the justification methods for AMT evaluation into three groups: economic analysis techniques, analytical methods and strategic approaches. Miltenburg and Krinsky (1987) analyzed the application of traditional economic justification techniques such as net present worth, annual worth, internal rate of return, payback period to the evaluation of FMS alternatives. Statistical procedures, mathematical programming, multiattribute and multi-objective decision-making methods can be listed among analytical methods. Analytical methods may be either deterministic or non-deterministic. Deterministic analytical methods include scoring models, the analytic hierarchy process (AHP), outranking methods, goal programming, data envelopment analysis (DEA), etc., whereas stochastic methods, game theoretical methods, fuzzy MCDM methods and expert systems are examples for non-deterministic analytical methods. Strategic approaches consider only corporate objectives that are in general long-term intangible benefits. Therefore, their integrated use with economic or analytical methods would be more appropriate. A number of papers have focused on the use of MCDM techniques for AMT justification. Huang and Ghandforoush (1984) evaluated industrial robot vendors, and identified the best robot by assigning specific weights to those factors. Imany and Schlesinger (1989) ompared linear goal programming and ordinary least-squares methods via a robot selection problem where robots are evaluated based on cost and technical performance measures including load capacity, velocity and repeatability. Stam and Kuula (1991) developed a two-phase decision procedure that uses AHP and multi-objective mathematical programming for the problem of flexible manufacturing system (FMS) selection. Agrawal et al. (1991) employed TOPSIS for robot selection whereas Agrawal et al. (1992) applied TOPSIS for optimum gripper selection. Shang and Sueyoshi (1995) evaluated FMS alternatives using a decision framework that can integrate tangible and intangible benefits and financial factors. The proposed framework involved first the integrated use of AHP, simulation and an accounting procedure to determine the necessary outputs and inputs of FMS alternatives, and then, the application of DEA with restricted weights and cross-efficiency analysis to select the most efficient FMS. Khouja (1995) addressed the robot evaluation problem and proposed a two-phase.
(5) M. Amini et al.. J. Fundam Appl Sci. 2014, 6(1), 31-47. 35. methodology that consisted of first using DEA to identify the technically efficient robots from a list of feasible robots, and then, using multi-attribute utility theory to further discriminate among efficient robots and select the best alternative. Baker and Taluri (1997) addressed some limitations of the simple radial efficiency scores used in Khouja (1995) and suggested the use of cross-efficiency analysis for AMT selection. Sambasivarao and Deshmukh (1997) presented a decision support system that employed economic analysis, multi-attribute analysis including AHP, TOPSIS and linear additive utility model, and risk analysis. Parkan and Wu (1999) studied the robot selection problem using OCRA, TOPSIS and utility function model, and proposed to rank the robots based on the averages of the rankings obtained by these there decision tools. Sarkis and Taluri (1999) evaluated FMS alternatives based on pair-wise efficiency comparisons made through a decision model that integrated the DEA model suggested by Cook et al. (1996) with cross-efficiency analysis. Parkan and Wu (2000) applied OCRA, AHP and DEA separately to an advanced automatic process evaluation problem and compared the results obtained by OCRA with those obtained by the other two methods to find out their similarities and differences. Braglia and Gabbrieli (2000) proposed the use of a known mathematical method based on dimensional analysis theory for selection of the best robot when conflicting performance attributes are to be considered. In addition, several studies contribute to the non-deterministic MCDM literature on evaluation, justification and selection of AMTs. Chang and Tsou (1993) formulated a chanceconstraints linear programming model for economic evaluation of FMSs. Liang and Wang (1993) proposed a robot selection procedure using the concepts of fuzzy set theory. Perego and Rangone (1998) analyzed and compared fuzzy set theory-based multi-attribute decisionmaking techniques for AMT justification. Karsak (1998) proposed a two-phase robot selection procedure that integrated DEA with a fuzzy robot selection algorithm, which enabled the decision-maker to fully rank robot alternatives. Khouja and Kumar (1999) proposed a methodology for robot selection, which integrated technical considerations with real options theory. Karsak and Tolga (2001) presented a fuzzy multi-criteria decisionmaking approach for evaluating AMT investments, which integrated both economic and strategic selection criteria using a decision algorithm based on a fuzzy number ranking method. Despite many fuzzy MCDM methods involve the use of a fuzzy number ranking method to handle imprecision and vagueness existing in decision problems, fuzzy number ranking methods is criticized for not producing consistent outcomes. Furthermore, there is no.
(6) M. Amini et al.. J. Fundam Appl Sci. 2014, 6(1), 31-47. 36. consensus on the best fuzzy number ranking method. Karsak (2002) has recently developed a distance-based fuzzy MCDM approach for evaluating FMS alternatives that eliminates the need for using a fuzzy number ranking method. Recently, AMT justification problems that involve the consideration of a single input and multiple outputs have been addressed by several authors. Braglia and Petroni (1999) presented a robot evaluation problem that considered cost as the single input and engineering attributes as the outputs, and they proposed the use of DEA with restricted multiplier weights for identification of the optimal robot. They have also discussed the merits and drawbacks of using weight restriction constraints compared with those of cross-efficiency analysis. Taluri and Yoon (2000) proposed a cone-ratio DEA approach for AMT justification, which made use of weight restriction constraints to incorporate a priori information on the priorities of factors, and illustrated the proposed model via a robot selection problem. A similar decision problem has recently been addressed by Sun (2002). Akin to studies by Braglia and Petroni (1999) and Taluri and Yoon (2000), Sun (2002) selected cost as the single input criterion and technical specifications as output criteria to evaluate relative efficiency of CNC lathes. The present paper proposes a robust practical common weight MOLP methodology for evaluating AMTs based on a single input and multiple outputs. The proposed methodology possesses two advantages compared with DEA-based approaches proposed in the literature for the similar problem. First, the proposed approach evaluates al alternatives by common weights for performance attributes overcoming the unrealistic weighting scheme common to DEA resulting from the fact that each DMU selects its own factor weights to lie on the efficient frontier. Second, it identifies the best AMT by requiring fewer computations compared with DEA-based approaches. One other similarity between the proposed methodology and DEA-based approaches is that they do not demand a priori importance weights from the decision-maker for performance attributes under consideration, and thus, they can be named as objective decision techniques.. 3. Proposed MCDM model by Karsak and Ahiska Data envelopment analysis is a mathematical programming-based decision-making technique, which has been widely used to treat decision problems that necessitate the consideration of multiple outputs and multiple inputs to evaluate the relative efficiency of DMUs. While considering multiple inputs in efficiency analysis, DEA makes an implicit assumption that any input can act as a substitute for any other because it uses weighted combination of all the.
(7) M. Amini et al.. J. Fundam Appl Sci. 2014, 6(1), 31-47. 37. inputs (Tofalis1997). This critical assumption does not hold for cases where the inputs are not substitutes for each other. Tofalis (1997) states that considering one input at a time eliminates the problem of extreme or unrealistic weights on the inputs since they are not weighted at all. When multiple exact outputs and a single input are to be considered in the evaluation process, the conventional DEA formulation takes the following form: max. E. 0. y wx r. . r. r0. 0. subject to s. y wx , r. r 1. rj. 1,. (1). j 1, 2,..., n. j. r. r 1, 2,..., s. w. Where E0 is the efficiency of the evaluated DMU, r is the weight assigned to output r, w is the weight assigned to the single input, rj is the amount of output r produced by DMUj, X j is the amount of the single input consumed by DMUj, and is a small positive scalar. Formulation (1) is non-linear; however, it is possible to convert it into a linear program through a straightforward variable alternation. Replacing the term r with ur , for r , yields w the following linear formulation: s. max. E0 . u y x r. r 1. r0. 0. (2). subject to s. u y 1, x u , r 1. r. rj. j 1, 2,..., n. j. r. r 1, 2,..., s. Formulation (2), being a special case of the DEA model, possesses the characteristics of DEA and thus it suffers from al of its limitations. First, in order to determine the relative efficiencies of al DMUs, formulation (2) has to be formulated and solved n times, where n is the number of DMUs to be evaluated. Therefore, DMUs are not evaluated by common performance attribute weights, which may not lead to desirable consequences, since company management will typically wish to evaluate al units on a common weights basis. Second, DEA assumes that DMUs That receive the efficiency scoreof1 are called ‘efficient’ and they are said to lie on the efficient frontier while the DMUs that receive a score les than 1 are called ‘inefficient’. In short, DMUs are classified in a dichotomous way as efficient ones and.
(8) M. Amini et al.. J. Fundam Appl Sci. 2014, 6(1), 31-47. 38. inefficient ones. Further, as al efficient DMUs receive the same efficiency score of 1, formulation (2) does not enable further discrimination among them. Possessing poor discriminating power, the DEA model represented by formulation (2) is not an appropriate decision tool for the cases where the decision-maker has to determine the best DMU. Moreover, for each DMU, formulation (2) provides the flexibility to choose the weights in its own favor, i.e. in a way to maximize its own efficiency score. Allowing such weight flexibility may result in identifying a DMU to be efficient by giving an extremely high weight to criteria with respect to which it has shown an extremely good performance and an extremely small weight to those with respect to which it has shown a bad performance. Such an extreme weighting is unrealistic and causes the DEA model to have a poor discriminating power. To avoid unrealistic weight distribution and overcome the poor discriminating power of DEA, several approaches to restrict weights, which in general impose bounds or other constraints on weights, have been proposed (also Dyson and Thanasoulis 1988, Alen et al. 1997). The just cited approaches modify the existing technical efficiency oriented DEA models by including into the model weight restrictions that are formulated based on value judgment, which reduce the degree of objectiveness of DEA. Karsak and Ahiska introduced an approach that differs from those approaches in that it does not necessitate a priori subjective assessments of the decision-maker on factor weights for further prioritization of DMUs. The proposed approach employs efficiency measures that are not specific to a particular DMU, but common to all DMUs. Using the proposed efficiency measures, formulation (2) is transformed into a common weight MCDM model with an improved discriminating power. Proposed efficiency measures are a function of the deviation from efficiency. Let d j be defined as the deviation of the efficiency of DMUj, E j , from the ideal efficiency of 1 (i.e. d j 1 E j ). As minimizing d 0 , the deviation from efficiency for DMU 0 , is equivalent to. maximizing its efficiency, E0 , an equivalent of formulation (2) can be written as follows: min. d. subject. 0. to s. u y x r 1. r. rj. (3) d j 1,. j 1,2,..., n. j. u d. r j. ,. r 1,2,..., s. 0,. j 1,2,..., n. The objective functions of formulations (2) and (3) are specific to a particular DMU. Therefore, to determine the efficiencies of al n DMUs, we need to formulate n models, each aiming to minimize the deviation from efficiency for a particular DMU. Furthermore, these.
(9) M. Amini et al.. J. Fundam Appl Sci. 2014, 6(1), 31-47. 39. models considering the technical efficiency measure give the evaluated DMU the maximum possible freedom in choosing the performance attribute weights, which reduces the discriminating power of the model. Minimax efficiency measure can be briefly defined as the minimization of the maximum deviation from efficiency among al DMUs. Further discrimination among DMUs can be allowed by replacing the objective function of formulation (3) with the Minimax efficiency measure, which yields the following MCDM model, namely the Minimax efficiency model. min. M. subject. to M d j,. j 1,2,..., n. (4). s. u y x r 1. r. rj. d j 1,. j 1,2,..., n. j. u d. r j. ,. r 1,2,..., s. 0,. j 1,2,..., n. Where M is the maximum deviation from efficiency and M d j are the constraints that are added to the model to assure that M max j d j . Minimax efficiency measure has a higher discriminating power than the classical efficiency measure, since it considers the favor of al DMUs simultaneously, which restricts the freedom of a particular DMU to choose the factor weights in its own favor. Furthermore, as the Minimax efficiency measure is an objective function not specific to a particular DMU but common to all DMUs, it does not necessitate solving n formulations to determine efficiencies of al DMUs. The efficiencies for al DMUs can be computed by a single formulation. When formulation (4) is solved, the efficiencies for al DMUs is determined by calculating 1 d j , for j = 1, 2, ..., n. This one-step efficiency computation enables the evaluation of the relative efficiency of all DMUs based on common performance attribute weights, which contrasts with DEA models where each DMU is evaluated by different weights. 4. MAXIMIN APPROACH Consider the following multi-objective problem. max. f. ( x ),. 1. f. 2. ( x ),...,. f. k. . ( x). (5). subject to. x X, . n X x R . g i ( x ) 0, . i 1, 2,..., m .
(10) M. Amini et al.. J. Fundam Appl Sci. 2014, 6(1), 31-47. 40. Where X is the region of solutions. For solving this MODM, we can use Maximin approach that assumes the optimal solution of the following problem is efficient for the above MODM problem.. . m a x m in su b je c t to. f. 1. ( x ),. f. 2. ( x ), ...,. f. k. ( x) . (6). x X . By defining variable z, we have: max Z subject to Z. f f. j * j. ( x). (7). j 1, 2,..., k. ( x). x X Z 0. In model (7). f. * j. are used for normalizing objective functions.. 5. PRACTICAL COMMON WEIGHT MAXIMIN APPROACH FOR TECHNOLOGY SELECTION Consider the following MOLP.. max. s s s u u r y r1 u r y r 2 r y rm r 1 , r 1 ,..., r 1 x2 xn x1 . subject to s. u y x u , r 1. r. rj. 1,. j 1,2,..., n. j. r. r 1,2,..., s. We can solve the above formulation by using (7). That is. (8).
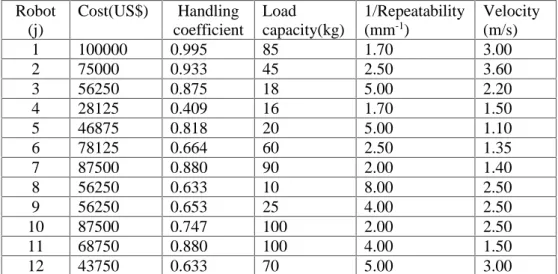
(11) M. Amini et al.. J. Fundam Appl Sci. 2014, 6(1), 31-47 max. 41. Z. subject to s. u y Z x r. r 1. rj. j 1,2,..., n. ,. (9). j. s. u y x u , r 1. r. rj. 1,. j 1,2,..., n. j. r 1,2,..., s. r. Z 0 s. y are of efficiency type, then there is no need to normalization. By Because all of u x r 1. r. rj. j. *. solving formulation (9), u r are calculated that are a CSW and we can calculate efficiency of all DMUs. Theorem: If DMU j is efficient at formulation (9) then necessarily would be efficient by model CCR. For complete ranking of DMUs, we have A as follow: A j DMU j is efficient by formulatin (9). Now, we have max Z subject to s. u y Z x r. r 1. rj. ,. j A. j. (10). s. u y x u , r 1. r. rj. 1,. j A. j. r. r 1,2,..., s. Z 0. 6. EXAMPLE PROBLEM In this section, the proposed Maximin methodology that may be applied to a wide range of technology selection problems is used for robot selection, and its discriminating power is illustrated through a previously reported industrial robot selection problem (Karsak & Ahiska, 2005). The robustness of the methodology proposed in this paper is tested via comparing the ranking obtained by the proposed methodology with that obtained by Karsak and Ahiska. The robot selection problem addressed in Karsak & ahiska (2005) involves the evaluation of relative efficiency of 12 robots with respect to four engineering attributes including ‘handling coefficient’, ‘load capacity’, ‘repeatability’ and ‘velocity’, which are considered as outputs,.
(12) M. Amini et al.. J. Fundam Appl Sci. 2014, 6(1), 31-47. 42. and ‘cost’, which is considered as the single input. Since lower values of repeatability indicate better performance, the reciprocal values of repeatability are used in efficiency computation of robots. Input and output data regarding the robots are given in table 1. Formulations (3) and (4) for 0.00001 are used to calculate DEA efficiency scores and Minimax efficiency scores and the new algorithm (Maximin approach) of robots, which are given in the second, third and fourth columns of table 2, respectively. To test the robustness of the proposed Maximin methodology, the scores obtained are compared with Minimax efficiency scores in third column of table 2. To conclude whether there is a positive relationship between the sets of rankings of the two approaches (Minimax and Maximin efficiency scores), Spearman’s rank correlation test is conducted. Table 1. Input and output data for 12 industrial robots Robot (j) 1 2 3 4 5 6 7 8 9 10 11 12. Cost(US$) 100000 75000 56250 28125 46875 78125 87500 56250 56250 87500 68750 43750. Handling coefficient 0.995 0.933 0.875 0.409 0.818 0.664 0.880 0.633 0.653 0.747 0.880 0.633. Load capacity(kg) 85 45 18 16 20 60 90 10 25 100 100 70. 1/Repeatability (mm-1) 1.70 2.50 5.00 1.70 5.00 2.50 2.00 8.00 4.00 2.00 4.00 5.00. Table 2. Efficiencies of robots for 0.00001 Robot(j). 1 2 3 4 5 6 7 8 9 10 11 12 average. DEA efficiency scores 0.653(11) 0.821(7) 0.954(4) 0.950(5) 1.000(1) 0.563(12) 0.683(10) 1.000(1) 0.765(8) 0.714(9) 0.909(6) 1.000(1). 0.834. Minimax efficiency scores 0.653(9) 0.753(6) 0.883(4) 0.862(5) 1.000(1) 0.563(12) 0.683(8) 0.631(10) 0.687(7) 0.617(11) 0.890(3) 1.000(1). 0.768. u1 0.537476 , u2 0.135941 , u3 0.000010 , u4 0.000010. Maximin efficiency scores 0.653(9) 0.754(6) 0.884(4) 0.863(5) 1.000(1) 0.564(12) 0.683(8) 0.632(10) 0.688(7) 0.617(11) 0.889(3) 0.999(2) 0.768. Velocity (m/s) 3.00 3.60 2.20 1.50 1.10 1.35 1.40 2.50 2.50 2.50 1.50 3.00.
(13) M. Amini et al.. J. Fundam Appl Sci. 2014, 6(1), 31-47. 43. We can also use correlation to obtain Spearman’s ρ (rank correlation coefficient). Like the Pearson product moment correlation coefficient, Spearman’s ρ is a measure of the relationship between two variables. However, Spearman’s ρ is calculated on ranked data. For calculating spearman’s we can use the below formulation that d i is the difference between ranks for the same observation (DMU). And n is the number of DMUs. n. rs 1. d. 2 i. i1. (11). n(n2 1). Moreover, we can compute the Pearson’s correlation on the columns of ranked data. The result of this formulation is too close to the exact Spearman’s . In this formulation xi , yi are the ranks for the same DMUi. And i=1, 2, 3, …, n. n. r . x y i 1. n. x i 1. 2 i. i. nx 2 .. i. nxy n. y i 1. 2 i. ny 2. (12). Spearman’s rank correlation is 0.98 and means that there is a positive relationship between the sets of rankings of the two approaches (Minimax and Maximin efficiency scores). Because the number of efficient DMUs on a common weight basis is reduced so discriminating power of our approach is higher than previous approaches and because Spearman’s rank correlation between the ranks obtained from our approach and Minimax approach is high therefore robustness of our approach is justified.. 7. CONCLUSIONS This paper introduces a new efficiency measure with an improved discriminating power that can be successfully applied for AMT evaluation based on multiple exact outputs and a single exact input. The proposed efficiency measurement technique uses a multi-objective linear programming method. Both the Minimax efficiency measure by Karsak & ahiska (2005) and the proposed efficiency measure (Maximin appoach), being common to all DMUs, enable the computation of efficiency scores of all DMUs on a common weight basis. Using the proposed efficiency measure, a practical common weight MOLP methodology is developed and illustrated through a robot selection problem. The convenience and robustness of the proposed methodology are tested via a comparison with Minimax analysis, which is.
(14) M. Amini et al.. J. Fundam Appl Sci. 2014, 6(1), 31-47. 44. proposed by Karsak and Ahiska (2005). The comparison reveals that both analyses evaluate the same robot as the best one. Furthermore, the rankings obtained by the proposed methodology and Minimax analysis are shown to be positively correlated. The merits of the proposed framework compared with DEA-based approaches that have previously been used for technology selection can be listed as follows. First, this methodology allows the computation of the efficiency scores of all DMUs by a single formulation, i.e. all DMUs are evaluated by common performance attribute weights. Second, it identifies the best alternative by using fewer formulations compared with DEA-based approaches. Further, its practical formulation structure enables its results to be more easily adopted by management who may not poses advanced mathematical programming skills. On the other hand, one similarity between the proposed methodology and DEA-based approaches is that they are both objective decision tools since they do not demand a priori importance weights from the decision-maker for performance attributes. In short, the proposed methodology can be considered as a sound as well as practical alternative decision aid that can be used for justification and selection problems accounting for multiple exact outputs and a single input that can be applied in a wide range of AMT’s selection activities. For further study, useful extensions of the proposed methodology can be developed, which enables the decision-maker to consider imprecise output data denoted by fuzzy numbers.. 8. REFERENCES [1] Agrawal, V.P., Kohli, V. and Gupta, S. (1991) ‘Computer aided robot selection: The multiple attribute decision-making approach’, Int. J. Prod. Res., Vol. 29, No. 8, pp. 1629–164. [2] Agrawal, V.P., Verma, A. and Agarwal, S. (1992) ‘Computer-aided evaluation and selection of optimum grippers’, Int. J. Prod. Res., Vol. 30, No. 11, pp. 2713–2732. [3] Alen, R., Athanasopoulos, A., Dyson, R.G. and Thanasoulis, E. (1997) ‘Weight restrictions and value judgements in data envelopment analysis: Evolution, development and future directions’, An. Oper. Res., Vol. 73, pp. 13–34. [4] Baker, R.C. and Taluri, S. (1997) ‘A closer look at the use of data envelopment analysis for technology selection’, Comput. Ind. Eng., Vol. 32, No. 1, pp. 101–108. [5] Booth, D.E., Khouja, M. and Hu, M. (1992) ‘A robust multivariate statistical procedure for evaluation and selection of industrial robots’, Int. J. Oper. Prod. Manag., Vol. 12, No. 2, pp. 15– 24. [6] Braglia, M. and Gabbrieli, R. (2000) ‘Dimensional analysis for investment selection in industrial robots’, Int. J. Prod. Res., Vol. 38, No. 18, pp. 4843–4848..
(15) M. Amini et al.. J. Fundam Appl Sci. 2014, 6(1), 31-47. 45. [7] Braglia, M. and Petroni, A. (1999) ‘Evaluating and selecting investments in industrial robots’, Int. J. Prod. Res., Vol. 37, No. 18, pp. 4157–4178. [8] Chang, D.S. and Tsou, C.S. (1993) ‘A chance-constraints linear programming model on the economic evaluation of flexible manufacturing systems’, Prod. Plan. Contr., Vol. 4, No. 2, pp. 159–165. [9] Charnes, A., Cooper, W.W. and Rhodes, E. (1978) ‘Measuring the efficiency of decision-making units’, Eur. J. Oper. Res., Vol. 2, pp. 429–44. [10]. Cook, W.D., Kres, M. and Seiford, L.M. (1996) ‘Data envelopment analysis in the presence. of both quantitative and qualitative factors’, J. Oper. Res. Soc., Vol. 47, No. 7, pp. 945–953. [11]. Doyle, J. and Gren, R. (1994) ‘Efficiency and cros-efficiency in DEA: Derivations, meanings. and uses’, J. Oper. Res. Soc., Vol. 45, No. 5, pp. 567–578. [12]. Dyson, R.G. and Thanasoulis, E. (1988) ‘Reducing weight flexibility in data envelopment. analysis’, J. Oper. Res. Soc., Vol. 39, No. 6, pp. 563–576. [13]. Ghandforoush, P., Huang, P.Y. and Taylor, B.W. (1985) ‘A multi-criteria decision model for. the selection of a computerized manufacturing control system’, Int. J. Prod. Res., Vol. 23, No. 1, pp. 117–128. [14]. Huang, P.Y. and Ghandforoush, P. (1984) ‘Procedures given for evaluating, selecting robots’,. Ind. Eng., Vol. 16, pp. 4–48. [15]. Imany, M.M. and Schlesinger, R.J. (1989) ‘Decision models for robot selection: A. comparison of Ordinary least squares and linear goal programming methods’, Dec.Sci., Vol. 20, No. 1, pp. 40–53. [16]. Karsak, E.E. (1988) ‘A two-phase robot selection procedure’, Prod. Plan. Contr., Vol. 9, No.. 7, pp. 675–684. [17]. Karsak, E.E. (1999) ‘A DEA-based robot selection procedure incorporating fuzzy criteria. values’, In Proceedings of the IEEE International Conference on Systems, Man, and Cybernetics, Tokyo, Japan, Vol.1, pp. 1073–1078. [18]. Karsak, E.E. (2002) ‘Distance-based fuzzy MCDM approach for evaluating flexible. manufacturing system alternatives’, Int. J. Prod. Res., Vol. 40, No. 13, pp. 3167–3181. [19]. Karsak, E.E. and Tolga, E.. (2001) ‘Fuzzy multi-criteria decision-making procedure for. evaluating advanced manufacturing system investments’, Int. J. Prod. Econ., Vol. 201, 69, No. 1, pp. 49–64. [20]. Karsak, E.E. and ahiska, s.s. (2005) ‘Practical common weight multi-criteria decision-making. approach with an improved discriminating power for technology selection’, Int. J. Prod. Res., Vol. 43, No. 8, pp. 1537-1554. [21]. Khouja, M. (1995) ‘The use of data envelopment analysis for technology selection’, Comput.. Ind. Eng., Vol. 28, No. 1, pp. 123–132..
(16) M. Amini et al. [22]. J. Fundam Appl Sci. 2014, 6(1), 31-47. 46. Khouja, M. and Ofodile, O.F. (1994) ‘The industrial robots selection problem: Literature. review and directions for future research’, IE Trans., Vol. 26,No. 4, pp. 50–61. [23]. Khouja, M.J. and Kumar, R.L. (1999) ‘An options view of robot performance parameters in a. dynamic environment’, Int. J. Prod. Res., Vol. 37, No. 6, pp. 1243–1257. [24]. Liang, G.S. and Wang, M.J.J. (1993) ‘A fuzzy multi-criteria decision-making approach for. robot selection’, Robot. Comput. Integr. Manuf., Vol. 10, No. 4, pp. 267–274. [25]. McClave, J.T. and Benson, P.G. (1988) ‘Statistics for Business and Economics’, (Delen, San. Francisco). [26]. Meredith, J.R. and Suresh, N.C. (1986) ‘Justifcation techniques for advanced manufacturing. technologies’, Int. J. Prod. Res., Vol. 24, No. 5, pp. 1043–1057. [27]. Miltenburg, G.J. and Krinsky, I. (1987) ‘Evaluating flexible manufacturing systems’, IE. Trans., Vol. 19, No. 2, pp. 22–233. [28]. Narasimhan,R.S. and Vickery,K. (1988) ‘An experimental evaluation of articulation of. preferences in multiple criterion decision-making’, Dec. Sci., Vol. 19, No. 4, pp. 880–88. [29]. Parkan, C. and Wu, M.L. (1999) ‘Decision-making and performance measurement models. with applications to robot selection’, Comput. Ind. Eng., Vol. 36, No. 3, pp. 503–523. [30]. Parkan, C. and Wu, M.L. (2000) ‘Comparison of three modern multi-criteria decision-making. tools’, Int. J. Sys. Sci., Vol. 31, No. 4, pp. 497–517. [31]. Perego, A. and Rangone, A. (1998) ‘A reference framework for the application of MADM. fuzzy techniques to selecting AMTS’, Int. J. Prod. Res., Vol. 36, No. 2, pp. 437–458. [32]. Proctor, M.D. and Canada, J.R. (1992) ‘Past and present methods of manufacturing. investment evaluation: A review of the empirical and theoretical literature’, Eng. Economist, Vol. 38, No. 1, pp. 45–58. [33]. Raafat, F. (2002) ‘A comprehensive bibliography on justification of advanced manufacturing. systems’, Int. J. Prod. Econ., Vol. 79, No. 3, pp. 197–208. [34]. Sambasivarao, K.V. and Deshmukh, S.G. (1997) ‘A decision support system for selection and. justifcation of advanced manufacturing technologies’, Prod. Plan. Contr., Vol. 8, No. 3, pp. 270– 284. [35]. Sarkis, J. and Taluri, S. (1999) ‘A decision model for evaluation of flexible manufacturing. systemsin the presence of both cardinal and ordinal factors’, Int. J. . Res., Vol. 37, No. 13, pp. 2927–2938. [36]. Sexton, T.R., Silkman, R.H. and Hogan, A.J. (1986) ‘Data envelopment analysis: Critique. andextensions. In Measuring Efficiency: An Assessment of Data Envelopment Analysis’, edited by R.H. Silkman, pp. 73–104, (Josey-Bas, San Francisco). [37]. Shang, J. and Sueyoshi, T. (1995) ‘A unified framework for the selection of a flexible. manufacturing system’, Eur. J. Oper. Res., Vol. 85, No. 2, pp. 297–315..
(17) M. Amini et al.. [38]. J. Fundam Appl Sci. 2014, 6(1), 31-47. 47. Son, Y.K. (1992) ‘A comprehensive bibliography on justification of advanced manufacturing. technologies’, Eng. Economist, Vol. 38, No. 1, pp. 59–71. [39]. Stam, A. and Kula, M. (1991) ‘Selecting a flexible manufacturing system using multiple. criteria analysis’, Int. J. Prod. Res., Vol. 29, No. 4, pp. 803–820. [40]. Sulivan, W.G. (1986) ‘Models IEs can use to include strategic, non-monetary factors in. automation decisions’, Ind. Eng., Vol. 42, pp. 42–50. [41]. Sun, S. (2002) ‘Assessing computer numerical control machines using data envelopment. analysis’, Int. J. Prod. Res., Vol. 40, No. 9, pp. 201–2039. [42]. Talluri, S.and Yoon, K.P. (2000) ‘A cone-ratio DEA approach for AMT justification’, Int. J.. Prod. Econ., Vol. 66, No. 2, pp. 19–129. [43]. Tofalis, C. (1997) ‘Input efficiency profiling: an application to airlines’, Comput. Oper. Res.,. Vol. 24, No. 3, pp. 253–258.. How to cite this article: Alinezhad A. Amini M. Practical common weight Maximin approach for technology selection. J Fundam Appl Sci. 2014, 6(1), 31-47.
(18)
Figure
Documents relatifs
En visant des lieux-cibles, les acteurs de l’urbicide détruisent le vivre ensemble en produisant une géographie de la peur qui perdure par-delà le temps des combats
In comparison, model results (averaged over 5 days) of surface temperature in March of the last simulation year (Figs. 12 and 13) now show much larger differences between the
Ponctuelle pour les monuments avec couleur indiquant suite aux mesures leur situation par rapport à la zone inondable (maintenues, retirées, ajoutées ou hors zone inondable).
Si l’on peut distinguer des étoiles individuelles dans un amas ou une galaxie éloignés, on peut chercher des céphéides, mesurer leur période et leur luminosité apparente,
An enhancement of φ meson production is observed in the Au-going direction, while suppression is seen in the d-going direction, and no modification is observed at midrapidity
The total fraction of signal events coming from B 0 me- son decays is determined using inclusive MC simulations in which the only requirement at the generator level is the presence
Industry Policy Resolution of 1948) and toward a new conception of co-existence, that is, private and public enterprise existing side-by- side in the same
En déduire que pour toute application linéaire ψ de R n−1 [X] dans R, il existe un unique n-uplet (β1 ,. Montrer qu’il existe un unique n-uplet
