HAL Id: hal-01270247
https://hal.archives-ouvertes.fr/hal-01270247
Submitted on 6 Feb 2016
HAL is a multi-disciplinary open access
archive for the deposit and dissemination of
sci-entific research documents, whether they are
pub-lished or not. The documents may come from
teaching and research institutions in France or
abroad, or from public or private research centers.
L’archive ouverte pluridisciplinaire HAL, est
destinée au dépôt et à la diffusion de documents
scientifiques de niveau recherche, publiés ou non,
émanant des établissements d’enseignement et de
recherche français ou étrangers, des laboratoires
publics ou privés.
Automatic heart rate detection from FBG sensors using
sensor fusion and enhanced empirical mode
decomposition
Ibrahim Sadek, Jit Biswas, Victor Foo Siang Fook Victor, Mounir Mokhtari
To cite this version:
Ibrahim Sadek, Jit Biswas, Victor Foo Siang Fook Victor, Mounir Mokhtari. Automatic heart rate
detection from FBG sensors using sensor fusion and enhanced empirical mode decomposition. Signal
Processing and Information Technology (ISSPIT), Dec 2015, Abu Dhabi, United Arab Emirates.
�10.1109/ISSPIT.2015.7394358�. �hal-01270247�
Automatic Heart Rate Detection From FBG Sensors Using Sensor Fusion
and Enhanced Empirical Mode Decomposition
Ibrahim Sadek
a,b,c, Jit Biswas
c, Victor Foo Siang Fook
c, and Mounir Mokhtari
a,ba
Institut Mines T´el´ecom, France
b
Image & Pervasive Access Lab (IPAL), CNRS UMI 2955, Singapore
c
Institute for Infocomm Research (I
2R), Agency for Science, Technology and Research (A
*STAR), Singapore
{stuis, biswas, sffoo}@i2r.a-star.edu.sg, [email protected]
Abstract—Cardiovascular diseases are the world’s top leading causes of death. Real time monitoring of patients who have cardiovascular abnormalities can provide comprehensive and preventative health care. We investigate the role of the complete ensemble empirical mode decomposition with adaptive noise (CEEMDAN) and sensor fusion for automatic heart rate detection from a mat with embedded Fiber Bragg Grating (FBG) sensor arrays. The fusion process is performed in the time domain by averaging the readings of the sensors for each sensor array. Subsequently, the CEEMDAN is applied to obtain the interbeat intervals. Experiments are performed with 10 human subjects (males and females) lying on two different positions on a bed for a period of 20 minutes. The overall system performance is assessed against the reference ECG signals. The average and standard deviation of the mean relative absolute error are 0.049, 0.019 and 0.047, 0.038 for fused and best sensors respectively. Sensor fusion together with CEEMDAN proved to be robust against motion artifacts caused by body movements.
I. INTRODUCTION
As published by the World Health Organization, cardio-vascular diseases (CVDs) were the top leading reasons of death all around the world during the past decade. In 2012, approximately 17.5 million people died by reason of CVDs accounting for 31% of all worldwide deaths [1]. Continuous monitoring of patients affected by CVDs at home can provide early diagnosis and prophylaxis [2]. One possible way to measure, the mechanical vibration of heart activities in a noninvasive and unobtrusive manner is the ballistocardiogram. In principle, ballistocardiogram (BCG) is a technique that measures the mechanical vibrations arising from the recoil of the body, caused by the ventricular ejection of blood from the heart into the arterial tree along with each heartbeat [3]. The most common approach to assess cardiac and respiratory signals simultaneously, is the polysomnogram (PSG). Usually, the PSG systems include, but not limited to electrocardio-gram (ECG), electroencephaloelectrocardio-gram (EEG), electrooculoelectrocardio-gram (EOG), electromyogram (EMG), respiratory effort, airflow, and oxygen saturation (SpO2) [4]. Although these systems pro-vide accurate and recurrent measurements, they are bulky and expensive to be available as home based systems. Fortunately, over the last several years, the introduction of inexpensive and easily implemented BCG devices at home is becoming feasible and viable [5]. Recently, a number of approaches have been evolved including chairs or beds equipped with piezoelectric sensors, force plates, and weighing scales [6]. Nearly all of
these sensors, yield a single channel BCG signal representing the entire forces affecting the whole surface or a large part of it [7]. Alternatively, BCG signal acquisition performance can be improved thanks to the redundancy afforded by multichannel BCG sensors. For example, Fiber Bragg Grating (FBG) sensor combines several sensors on a single optical fiber, thereby increasing the probability of acquiring BCG signals at different locations [8]. Raw BCG signals are normally very noisy and non-stationary for many reasons such as body movements, respiratory efforts, and the properties of the equipment itself. Therefore, interbeat interval or heart rate estimation is a very challenging task [9].
The objective of this research paper is to calculate the heart rate from multichannel Fiber Bragg Grating sensor arrays using complete ensemble empirical mode decomposition with adaptive noise (CEEMDAN) and sensor fusion.
II. RELATEDWORK
In the literature, most approaches use a preprocessing step to separate respiratory component from BCG component using standard time domain filtering methods [10]. However, in [11] respiration information is employed to enhance the detection of the BCG signal. In general, sensor fusion from multichannel BCG sensors has been used in different ways. In [7] four channel optical sensor array is used, where BCG signals are fused before (A/D) conversion. The authors compute the heart rate by analyzing the periodicity of the signal using an adaptive moving window. In [12] measurements from multiple pressure sensitive contacting electrodes are averaged in the frequency domain using a sliding Fourier transform. In [13] multichannel pressure sensing emfit foil is introduced. Afterward, data from different sensors is averaged in the frequency domain, and then FFT is applied for short time windows. In [14] Bayesian fusion is utilized to estimate the heart rate by means of capacitive ECG sensors with an integrated optical sensor. In [8] data from multiple FBG sensors are summed up in the cepstral domain, where signals are fused by computing the maximum value of each time lag between all sensors to be fused. On the other hand, the conventional empirical mode decomposition (EMD) along with two modulation based approaches are used in [15] to surpass generated noise when a single channel emfit sensor is placed in the backrest of a moving wheelchair. Although the EMD approach helps to remove generated noise in the
BCG signal, it has two limitations i.e., end effects and mode mixing. Ensemble EMD (EEMD) is used in [16] to eliminate generated noise as well as to solve the mode mixing problem. Nevertheless, the EEMD still does not completely solve the mode mixing problem and requires high computational time. We propose to use the CEEMDAN as a noise removal tool since it provides a complete reconstruction of the signal and lowers the required computational time.
III. METHODOLOGY A. BCG Signal Acquisition
The BCG signal is acquired using FBG sensor mat as previously discussed in [8]. However, in our case, the sensor mat consists in four FBG sensor arrays or channels (six sensors each one) instead of three. The 4th channel was a noisy channel, so it was neglected in the previous work. In our work we want to study if it is possible to extract the heart rate from this noisy channel. The four sensor arrays are connected to FBG sensor interrogator through four optical channels. Subsequently, BCG signals are sampled with a sampling frequency of 250 Hz, and then they are sent to a personal computer for heart rate measurement. Ten subjects participated in this experiment (males and females with ages ranging from 20 to 50 years). The FBG sensor mat is placed over a bed, under a thin bed sheet, where the locations of the arrays are under the head, under the chest, under chest and abdomen, and under hips respectively. The experiment is divided into two phases such as 10 minutes of a supine lying position and 10 minutes of a sideways lying position.
B. CEEMDAN
The EMD [17] is an adaptive method, which can be used to break down a nonlinear and a non-stationary signal as an amalgamation of amplitude and frequency modulated func-tions named intrinsic mode funcfunc-tions (IMFs) without leaving the time domain. IMF should fulfill two conditions: (1) in the entire dataset, the number of extrema and the number of zero crossings must be equal or vary at most by one; (2) at any time instant, the mean value of the upper and lower envelope is zero. Even though EMD proved to be applicable in several areas of research, such as biomedical signal processing, it encounters some limitations as follows: first, end effects that destroy the IMFs at its endpoints. Second, mode mixing, which causes very similar oscillations to exist in different modes. In order to solve these problems a new approach is introduced: the EEMD [18], the basic idea is to carry out the EMD over an ensemble of the signal besides white Gaussian noise (WGN). Adding WGN overcomes the mode mixing problem by processing the entire time frequency space to make use of the dyadic filter bank behavior of the EMD. Nonetheless, different number of modes may be generated. Instead, the CEEMDAN can provide precise reconstruction of the original signal in addition to reducing the computational complexity [19]. It further solves the boundary problems by mirrorizing extrema close to the edges [20]. Given a target signal x, assume w(l)is a WGN of zero mean and unit variance i.e., with N(0, 1), ε is the noise
standard deviation, and Ek(.) is an operator responsible for
getting the kth mode of a given signal by EMD. The algorithm for obtaining a kth mode by EMD can be explained as follows [17]:
1) Initialize k = 0 and detect all local extrema (i.e., all local maxima and local minima) of r0= x.
2) Obtain the maximum and minimum envelopes of the local extrema (emax, emin) by means of cubic spline
interpolation.
3) Compute the mean of the maximum and minimum envelopes m = (emax+ emin)/2.
4) Extract the IMF candidate dck+1= rk− m.
5) Repeat steps 1 − 4 on dck+1until it can be identified as
IMF.
6) Iterate on the final residual rk until some predefined
stopping criteria are fulfilled.
Following the EMD algorithm, the CEEMDAN can be illus-trated in following steps:
1) Each x(l)= x + ε
0w(l) is decomposed similar to EMD
for l = 1, ..., L to obtain its first mode ( edc1):
e dc1= 1 L L X l=1 dc(l)1 = dc1. (1)
2) For k = 1, compute the first residue (r1):
r1= x − edc1. (2)
3) Decompose r1+ ε1E1(wl), l = 1, ..., L until its first
EMD mode, and then define the second mode:
e dc2= 1 L L X l=1 E1(r1+ ε1E1(wl)). (3)
4) For k = 2, ..., K, compute the kth residue:
rk= r(k−1)− edck. (4)
5) Decompose realizations rk + εkEk(wl), l = 1, ..., L
until their first mode by EMD, and then determine the (k + 1)th mode: e dck+1= 1 L N X n=1 E1(rk+ εkEk(wl)). (5)
6) Go to step 4 for next k
Steps 4 − 6 are repeated until the obtained residue cannot be decomposed anymore by EMD (it contains less than three local extrema). Thus, the final residue fulfills:
rk= x − K X k=1 e dck. (6)
Where K is the total number of decomposition modes. As a result, the target signal can be represented as:
x = K X k=1 e dck+ rk. (7)
C. Heart Rate Calculation
For the 20 minutes recording, the heart rate is estimated using a moving window of a size 60 seconds/15,000 samples for both BCG and ECG signals. The heart rate from the ECG
is treated as a reference to analyze the performance of the proposed algorithm. Recall that four FBG sensor arrays or channels are employed, where each sensor array combines six sensors, the overall system design for a single channel is shown in Fig. 1. The main steps of the proposed approach can be summarized as follows:
1) For a particular channel, measurements from the six sensors are fused by averaging their values in the time domain. Assume {D1, ..., D6} denote the sensed data of
the six sensors. Thus, the BCG signal is computed such as x = 16P6
i=1Di.
2) The BCG signal is extracted using a Butterworth high-pass filter (5th order with a cutoff frequency of 0.2 Hz) followed by a Butterworth low-pass filter (10th order
with a cutoff frequency of 30 Hz) as shown in Fig. 2. 3) The BCG signal is decomposed using CEEMDAN as
shown in Fig. 3.
4) The 9th component is selected for heart rate estimation,
since each local maximum is assumed to represent a cardiac cycle.
5) Steps 1 − 4 are repeated for the other three channels.
Fig. 1 Overall system flowchart for a single channel.
IV. RESULTS ANDDISCUSSION
The proposed approach is assessed according to a noise standard deviation of 0.2, a number of realizations of 100, and a maximum number of iterations of 30. These parameters are referred to as Nstd, NR, and MaxIter, which should be tuned carefully as they have a strong impact on the detection performance as well as the processing time. The heart rate is computed for both ECG and BCG in beat per minute. The average and the standard deviation of the mean relative absolute error (MRAE) are computed for the 10 subjects over the 20 minutes recording. The MRAE is the sum of absolute errors with respect to the sum of measured data and it is computed as follows: M RAE = Pn i=1|Mi− Ri| Pn i=1Mi . (8)
Where M , R, and n denote measured data, reference data, and number of data. Fig. 4 presents a fused BCG signal from the
Fig. 2 BCG signal from a male subject and its corresponding ECG signal (10 sec), red downward-pointing triangles represent heart beats in both signals.
Fig. 3 BCG signal and its decomposition results. The 9thcomponent shows a match for the cardiac cycle.
3rdchannel of the 2ndsubject along with its 9th decomposition
component, we can notice that the local maxima of the 9th
decomposition component agree with the periodicity of the J-peaks of the fused BCG signal. In order to evaluate how the sensor fusion process influences the detection performance, for each channel we compute the error metrics for each individual sensor then the best sensor is selected (lowest error). Subsequently, these error metrics are compared with the error metrics of the fused sensors. Table I shows the average and standard deviation of the errors for the fused sensors, whereas Table II shows the average and standard deviation of the errors for the best sensor with respect to each channel.
Fig. 4 Fused BCG signal and its 9th decomposition component (3rd channel, 2ndsubject).
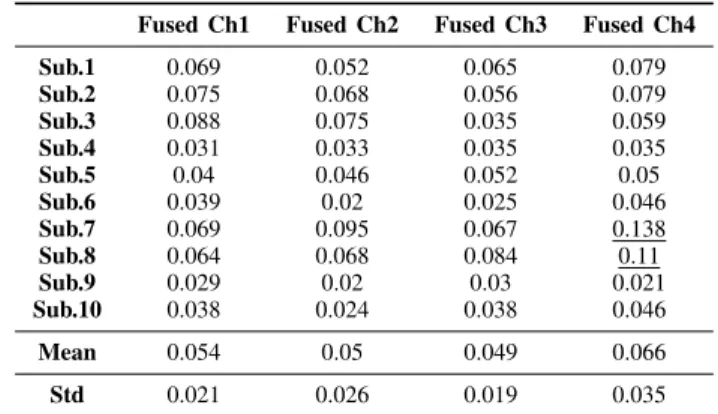
Table. I The average and standard deviation of the MRAE for the 10 subjects (Fused Sensors/Channel).
Fused Ch1 Fused Ch2 Fused Ch3 Fused Ch4 Sub.1 0.069 0.052 0.065 0.079 Sub.2 0.075 0.068 0.056 0.079 Sub.3 0.088 0.075 0.035 0.059 Sub.4 0.031 0.033 0.035 0.035 Sub.5 0.04 0.046 0.052 0.05 Sub.6 0.039 0.02 0.025 0.046 Sub.7 0.069 0.095 0.067 0.138 Sub.8 0.064 0.068 0.084 0.11 Sub.9 0.029 0.02 0.03 0.021 Sub.10 0.038 0.024 0.038 0.046 Mean 0.054 0.05 0.049 0.066 Std 0.021 0.026 0.019 0.035
Table. II The average and standard deviation of the MRAE for the 10 subjects (Best Sensor/Channel).
Best Ch1 Best Ch2 Best Ch3 Best Ch4 Sub.1 0.087 0.068 0.077 0.093 Sub.2 0.033 0.029 0.025 0.029 Sub.3 0.016 0.035 0.021 0.047 Sub.4 0.024 0.024 0.024 0.023 Sub.5 0.044 0.043 0.037 0.039 Sub.6 0.039 0.015 0.013 0.023 Sub.7 0.122 0.141 0.122 0.135 Sub.8 0.086 0.098 0.098 0.115 Sub.9 0.018 0.027 0.031 0.031 Sub.10 0.026 0.018 0.019 0.028 Mean 0.0498 0.05 0.047 0.056 Std 0.035 0.04 0.038 0.041
The best heart rate readings are obtained from the 3rd
channel (sensor array is placed under the chest and abdomen), where the average and standard deviation of the error are 0.049, 0.019 and 0.047, 0.038 for fused and best sensors respectively. The average of the error for fused sensors (0.049) is quite close to best sensor average error (0.047). Furthermore, the standard deviation of the error for fused sensors (0.019) is less than the best sensor standard deviation error (0.038). On the contrary, the highest errors resulted from the 4th channel are such as 0.066, 0.035 and 0.056, 0.041 for fused and best sensors accordingly as shown in Fig. 5. This indicates
that CEEMDAN together with sensor fusion can effectively enhance the overall performance of the heart rate detection system by reducing the effect of generated noise produced because of body movements. Moreover, for the fused sensors, it can be noticed that all MRAE values are less than 0.1 except for subjects 7 and 8 in the 4th channel. However, for the best
sensors, MRAE values of subject 7 are greater than 0.1 in all channels, and only in the 4thchannel for subject 8 as indicated by underline in Table I and Table II. Although it was difficult to extract the interbeat intervals of the BCG signal from the 4th channel (because of body movements), the CEEMDAN is able to detect most of the intervals as shown in Fig. 6.
Fig. 5 Box plot of the average and standard deviation of errors for fused and best sensors.
Fig. 6 Fused BCG signal and its corresponding ECG (4thchannel, 2nd subject). ECG is shown in 1st row, while BCG signal and detected peaks are shown in 2ndrow.
V. CONCLUSION
In this research work, an automatic method is introduced to detect heart rate from FBG sensors using CEEMDAN and sensor fusion. The proposed method proved to be powerful against motion artifacts induced due to body movements. The average and standard deviation of the mean relative absolute error are computed for fused and best sensors per each channel respectively. The third sensor array placed under the chest and abdomen provides us with the best heart rate readings for all subjects. Although CEEMDAN is faster than EEMD, a bit more time was required for large samples. In the future,
different combinations of decomposition components might be involved to get more details about the BCG morphology.
VI. ACKNOWLEDGMENT
The authors would like to thank all individuals for their roles in data collection.
REFERENCES
[1] World Health Organization (WHO), “Cardiovascular diseases (CVDs), Fact sheet N°317,” January 2015. [Online]. Available: http://www.who.int/mediacentre/factsheets/fs317/en/
[2] A. Wiens and O. Inan, “A novel system identification technique for im-proved wearable hemodynamics assessment,” Biomedical Engineering, IEEE Transactions on, vol. 62, no. 5, pp. 1345–1354, May 2015. [3] A. Akhbardeh, B. Kaminska, and K. Tavakolian, “Bseg++: A modified
blind segmentation method for ballistocardiogram cycle extraction,” in Engineering in Medicine and Biology Society, 2007. EMBS 2007. 29th Annual International Conference of the IEEE, Aug 2007, pp. 1896–1899. [4] J. Matheson, R. Singh, and A. Packard, “Polysomnography and sleep disorders,” in The Clinical Neurophysiology Primer, A. Blum and S. Rutkove, Eds. Humana Press, 2007, pp. 393–445.
[5] S. Tan-a ram and C. Thanawattano, “Procedure to identify sleep apnea events from statistical features,” in Biomedical Engineering and Infor-matics (BMEI), 2010 3rd International Conference on, vol. 3, Oct 2010, pp. 996–1001.
[6] O. Inan, G. Kovacs, and L. Giovangrandi, “Evaluating the lower-body electromyogram signal acquired from the feet as a noise reference for standing ballistocardiogram measurements,” Information Technology in Biomedicine, IEEE Transactions on, vol. 14, no. 5, pp. 1188–1196, Sept 2010.
[7] C. Bruser, A. Kerekes, S. Winter, and S. Leonhardt, “Multi-channel optical sensor-array for measuring ballistocardiograms and respiratory activity in bed,” in Engineering in Medicine and Biology Society (EMBC), 2012 Annual International Conference of the IEEE, Aug 2012, pp. 5042–5045.
[8] Y. Zhu, V. Fook, E. Jianzhong, J. Maniyeri, C. Guan, H. Zhang, E. Jiliang, and J. Biswas, “Heart rate estimation from fbg sensors using cepstrum analysis and sensor fusion,” in Engineering in Medicine and Biology Society (EMBC), 2014 36th Annual International Conference of the IEEE, Aug 2014, pp. 5365–5368.
[9] J. Jin, X. Wang, S. Li, and Y. Wu, “A novel heart rate detection algo-rithm in ballistocardiogram based on wavelet transform,” in Knowledge Discovery and Data Mining, 2009. WKDD 2009. Second International Workshop on, Jan 2009, pp. 76–79.
[10] C. Bruser, K. Stadlthanner, A. Brauers, and S. Leonhardt, “Applying machine learning to detect individual heart beats in ballistocardiograms,” in Engineering in Medicine and Biology Society (EMBC), 2010 Annual International Conference of the IEEE, Aug 2010, pp. 1926–1929. [11] K. Tavakolian, B. Kaminska, A. Vaseghi, and H. Kennedy-Symonds,
“Respiration analysis of the sternal ballistocardiograph signal,” in Com-puters in Cardiology, 2008, Sept 2008, pp. 401–404.
[12] J. Kortelainen, M. Van Gils, and J. Parkka, “Multichannel bed pressure sensor for sleep monitoring,” in Computing in Cardiology (CinC), 2012, Sept 2012, pp. 313–316.
[13] J. Kortelainen and J. Virkkala, “Fft averaging of multichannel bcg signals from bed mattress sensor to improve estimation of heart beat interval,” in Engineering in Medicine and Biology Society, 2007. EMBS 2007. 29th Annual International Conference of the IEEE, Aug 2007, pp. 6685–6688. [14] T. Wartzek, C. Bruser, M. Walter, and S. Leonhardt, “Robust sensor fusion of unobtrusively measured heart rate,” Biomedical and Health Informatics, IEEE Journal of, vol. 18, no. 2, pp. 654–660, March 2014. [15] E. Pinheiro, O. Postolache, and P. Girao, “Online heart rate estimation in unstable ballistocardiographic records,” in Engineering in Medicine and Biology Society (EMBC), 2010 Annual International Conference of the IEEE, Aug 2010, pp. 939–942.
[16] X. Cao, H. Guo, and J. Tang, “Heart rate extraction of ballistocardiogram based on hilbert-huang transformation,” in World Congress on Medical Physics and Biomedical Engineering May 26-31, 2012, Beijing, China, ser. IFMBE Proceedings, M. Long, Ed. Springer Berlin Heidelberg, 2013, vol. 39, pp. 619–622.
[17] N. E. Huang, Z. Shen, S. R. Long, M. C. Wu, H. H. Shih, Q. Zheng, N.-C. Yen, N.-C. N.-C. Tung, and H. H. Liu, “The empirical mode decomposition and the hilbert spectrum for nonlinear and non-stationary time series analysis,” Proceedings of the Royal Society of London A: Mathematical, Physical and Engineering Sciences, vol. 454, no. 1971, pp. 903–995, 1998.
[18] Z. WU and N. E. HUANG, “Ensemble empirical mode decomposition: A noise-assisted data analysis method,” Advances in Adaptive Data Analysis, vol. 01, no. 01, pp. 1–41, 2009.
[19] M. Torres, M. Colominas, G. Schlotthauer, and P. Flandrin, “A complete ensemble empirical mode decomposition with adaptive noise,” in Acous-tics, Speech and Signal Processing (ICASSP), 2011 IEEE International Conference on, May 2011, pp. 4144–4147.
[20] G. Rilling, P. Flandrin, and P. Gonc¸alves, “On empirical mode decompo-sition and its algorithms,” in Proceedings of IEEE-EURASIP Workshop on Nonlinear Signal and Image Processing NSIP-03, Grado (Italy), June 2003.