Development of Specifications and Performance Criteria
for Surface Preparation
Based on Issues Related to Bond Strength
CRC Cooperative project
Report prepared
by
B. Bissonnette (Laval University, Canada)
L. Courard (University of Liège, Belgium)
A. Garbacz (Warsaw University of Technology, Poland)
B. Robertson (Bureau of Reclamation, U.S.A.)
A.M. Vaysburd (Vaycon Consulting, U.S.A.)
K.F. von Fay (Bureau of Reclamation, U.S.A.)
Executive summary
Table of contents
Executive summary ... i
Table of contents ... ii
List of figures ... iii
Section 1 – Introduction ... 1
1.1 Background Bond in Repair / Overlay Composite Systems ... 4
1.2 Objective and Scope ... 8
List of figures
Figure 1-1: Schematics of mechanical shear and tensile bond between substrate
and repair, resulting from interlock mechanisms ... 5
Figure 1-2: Weak zone between substrate and repair system ... 6
Figure 1-3: Idealized model of a surface repair system ... 7
Section 1 – General introduction
1.1 Background
The aim of concrete repair or overlay1 is to prolong the service life of the
deteriorated/distressed structure or its element, to restore the load-carrying capacity and the stiffness or to strengthen the structure or its member. Consequently, monolitic action in the produced composite repair system is critical. A prerequisite for monolitic action is sufficient lasting bond between existing substrate and the new-cast repair/overlay material.
The long-term performance of concrete repairs and overlays can be to a large degree linked to their resistance to debonding and cracking.
The mechanisms of cracking and debonding are complex and mainly depend on material characteristics, environmental influences and degree of restraint. The most important repair/overlay material characteristics with respect to the bond are tensile strength and extensibility properties of the viscoelastic repair materials and volume changes caused by shrinkage. Development and magnitude of interface bond strength and most importantly bond durability further greatly depend on substrate surface preparation and workmanship during repair/overlay application.
The mechanisms and characteristics of bond between existing concrete and repair materials with respect to various factors and influences have been the object of a many studies in the
recent years. The number of ongoing research projects in the field, the current state of knowledge, the codes of practice, and especially in-situ repair performances, however show that many questions still remain unresolved. As a result, guidelines and project specifications for the design and implementation of repairs are often deficient in scope, performance criteria and detailing.
The scope of existing guidance and specifications concerning concrete repair bond issues is presently limited. Existing standards and specifications can basically be divided in design specifications for concrete repairs and structural design procedures for load-bearing concrete overlays.
This is mainly due to the need of further understanding of factors and conditions affecting bond strength and durability as affected by concrete surface preparation for repair/overlay [1]. A number of research projects have been documented in the literature, discussing aspects of bond properties and characteristics in terms of material properties, concrete substrate surface texture and condition, curing procedures, as well as some environmental factors of influence. However, despite the relatively large pool of theoretical knowledge, the practical issues related to surface preparation of existing concrete for repair in order to systematically achieve a lasting interfacial coexistence in a composite repair system are still inadequately addressed; unfortunately, as a result, repair and overlay debonding is still quite often observed.
The need for more practical design and application recommendations has widely been recognized by designers, materials specialists and contractors [2, 3].
whether a repair project is a success or a failure and whether a repaired structure meets the design objectives [4].
The durability, in this context, may be defined as the lasting interfacial coexistence of two composite materials combined in a composite system. Although most of the specified requirements and engineers’ considerations tend to focus on the achievement of the prescribed initial bond strength, it must be noted that this parameter can be only considered as a necessary condition, but certainly not a sufficient one. The most critical aspect is the durability of the bond, which is governed to a large extent by the service conditions of the repaired structure.
The concrete substrates are different, one from the other, in age, quality and service exposure: from the relatively new concrete to the most deteriorated one, exposed to various temperatures, relative humidity, chemically aggressive interior (inside the concrete substrate) and exterior environments, electrochemical status and mechanical loads.
At the time this project was undertaken, published data and information allowed for the following characterization of the concrete substrate to be repaired/overlaid:
• it is physically and chemically very complex;
• such complexity is also very variable from case to case;
• the complexity has to be considered on the basis of scale, which is relevant and dependent on the particular situation;
• practical answers and guidance/performance criteria at the present time, as well as the problem of achieving optimum bond in the repair/overlay composite systems, depend more upon broad judgment and experience than detailed knowledge.
An in-depth literature survey on concrete repair bond issues carried out at the onset of this project have revealed that many critical details and parameters are still little known. Research is
enable the identification and field assessment of dependable performance criteria (QA & QC) for practical repair applications.
1.2 Bond in repair and overlay composite systems
The characteristics of adhesion or “bond” can be studied from two opposite perspectives. On the one hand, it can be addressed based upon the conditions and nature of the contact between two materials, taking into account different bond mechanisms. On the other hand, it can be appraised through a quantitative measurement of the magnitude of adhesion, usually expressed in terms of stress or energy required to separate the two materials. In practice, available information on repair adhesion commonly refers to the equivalent average tensile stress required to separate the concrete substrate and the repair material [5].
The term “adhesion” describes the condition in the boundary layer between two bonded materials with a common interface. Adhesion mechanisms can be divided basically into thermo-dynamic mechanisms, chemical bonding and mechanical interlocking.
Mechanical adhesion in repaired concrete members relies on the penetration and hardening of the repair material inside the open cavities and asperities at the surface of the concrete substrate and the physical anchorage resulting therefrom. Capillary absorption plays an important role in the anchorage effect, as it draws cement paste (or any other binding system being used) into small cavities of the substrate. The extent of this effect is dependent on the moisture condition of the substrate (mainly the surface moisture) and the viscosity of the repair product.
It is important to note that mechanical adhesion in tension differs significantly from that in shear: for instance, a high interface roughness may improve shear bond strength, whereas tensile mechanical bond strength primarily depends on vertical anchorage in pores and voids (Figure 1-1).
Figure 1-1: Schematics of mechanical shear and tensile bond between substrate and repair, resulting from interlock mechanisms [6]
The above is important for the correct choice of bond strength test methods and for appraising the relationship between the measured shear and pull-off (tensile) bond strengths. Usually, differential volume changes resulting from drying shrinkage or temperature gradients cause both shear and tensile stresses at the interface. In structural design, tensile stresses perpendicular to the interface are rare. By contrast, interface shear stresses occur frequently in composite systems such as repairs and overlays. Standards, specifications and established practice in concrete repair field define bond strength commonly in relation to tensile strength (pull-off bond test) alone which, according to the above considerations, may be insufficient. Still today, the pull-off test is the only method commonly applied in the testing of bond strength on real structures.
the cementitious matrix in the bulk concrete. According to them, its formation is deeply by the “wall effect”, which leads to the presence of a weak layer within the resulting transition zone (Figure 1-2: Weak zone between substrate and repair system [7]
). Many will argue that the presence and extent of such a weak zone is dependent on the surface preparation performed prior to repair.
Figure 1-2: Weak zone between substrate and repair system [7]
Emmons and Vaysburd [8] presented an idealized model of a surface repair as a three-phase composite system, consisting of the existing concrete, the repair material and a transition zone between them (Figure 1-3). The authors stated that the characteristics of the transition zone are a function of the properties of the substrate (adherent), the properties of the repair material (adhesive) and the substrate surface preparation. Environmental factors, such as temperature or moisture, also play an important role on the properties of the interface region and on interfacial bond development.
A possible macroscopic characterization of the quality or degree of adhesion is obtained by the introduction of a transition zone along the geometrical interface between the adhesive and adherent phases. The thickness of the transition zone is the sum of the lengths in the adherent and the adhesive, where interactive forces of any nature change the mechanical nature of the original continuum [9]. This explains why the authors are referring to the so-called “interphase
zone” [10].
Figure 1-3: Idealized model of a surface repair system [8]
Adherence between a repair layer and the existing concrete is a case of adhesion between two solids, as a result of setting and hardening of an initially semi-liquid substance (repair material mixture) poured on a solid substrate (existing concrete).
The following factors exert primary influence the development of the transition zone and the resulting bond durability:
• physical and chemical properties of the concrete substrate; • characteristics and condition of the prepared surface; • physical and chemical properties of the repair material; • environmental conditions (notably moisture and temperature).
The repair material and concrete substrate, similar to a variety of glued connections, can be considered as a contact connection where the constitutive binder in the repair material acts as the glue. In this case, the bond strength can be considered to be the result of mechanical interlocking, specific adhesion, and cohesion.
Mechanical anchorage of the repair develops within the roughness and the porosity of the substrate surface. When estimating the effect of the existing substrate, not only its roughness, but also the size and form of protrusions must be taken into account. In the case of extended and gentle unevenness, an increase of the bond strength only comes essentially with an increase in the effective contact area. The specified properties of the repair material (e.g. consistency, method of compaction, etc.) may have a considerable influence on mechanical anchorage and adhesion. The bond strength developing between existing concrete and a repair layer also depends to a great extent on cohesion of the repair material, which itself is determined by the actual strength of the constitutive binder, its mineralogical components and the conditions prevailing during the period of curing.
Adhesion and cohesion are closely interconnected in the overall formation process of the contact zone. It is assumed that ultimately, adhesion is the most important aspect in the overall bond strength make up.
1.3 Objective and scope
Of critical importance to the long term useful performance of the composite repair/overlay system is the existing concrete surface preparation prior to application of the repair material. Proper surface conditioning is essential for the durability of the repaired structure. The repair
material is often blamed for “not sticking”, but the source of the trouble usually stems from inadequate surface preparation.
Therefore, the primary objective of this research study is to identify the fundamental factors and characteristics of concrete substrates prepared for repair/overlay and to develop guideline specifications for surface preparation of existing concrete. The research activities include both laboratory and field testing and evaluation.
The scope of the study include the following:
• to evaluate existing methods for assessment of the roughness parameters of a prepared surface;
• to establish correlations between shear bond strength, pull-off tensile strength, and surface roughness;
• to estimate the effect of load eccentricity in a tensile pull-off test on the bond strength; • to develop a field test to evaluate the optimum moisture conditioning of the particular
concrete substrate;
• to evaluate the effect of concrete carbonation on bond strength;
• to develop performance criteria and guide specifications for surface preparation.
As limitations, even if the scope of the title of the project “Development of Specifications and
Performance Criteria for Surface Preparation Based on Issues Related to Bond Strength”
suggests a wide scope, not all relevant aspects are being dealt with in the research program. In particular, the investigation is limited to normal weight concrete substrates and ordinary cement-based repair/overlay materials (resin-cement-based and lightweight concrete substrates and repair materials are beyond the scope of investigation).
of the substrate surface, its mechanical integrity, its absorptivity and moisture content, its porosity characteristics that will dictate the contact angle with the binding phase, chemical and mineralogical make up of the existing concrete, condition of the substrate and exposure conditions.
The experimental plan is divided into the following six tasks:
• Task 1 : Evaluate existing techniques for characterisation of concrete surface roughness parameters.
• Task 2 : Establish relationships between tensile bond, shear bond and surface roughness parameters.
• Task 3 : Evaluate the effect of load eccentricity in a tensile pull-off test on bond strength results.
• Task 4 : Develop a field test to evaluate the optimum moisture conditioning of the particular concrete substrate.
• Task 5 : Evaluate the effect of carbonated concrete substrate on bond strength.
• Task 6 : Develop performance criteria for achieving adequate bond in composite repair systems and guide specifications for concrete surface preparation prior to repair based on the results of the study.
In those tasks the following surface treatment techniques are investigated: • jackhammering;
• sandblasting; • scarifying; • shotblasting; • water jetting.
Supported by experimental test results and theoretical background, this research aims at a better understanding of strength and long-term performance of repairs and bonded overlays. Experimental procedures and test parameters were chosen based on the literature review and the related experience gained by the investigators (research, design and practice).
1.4 References
1. Courard, L., Garbacz, A. (2006) Failure of concrete repair: how to avoid it?, Proceedings of
the 2nd International Symposium on Advances in Concrete through Science and Engineering
(Ed. J. Marchand, B. Bissonnette, R. Gagné, M. Jolin, F. Paradis), Quebec, Canada,
167-191.
2. Vaysburd, A.M., Emmons P.H., Mailvaganam, N.P., McDonald, J.E., Bissonnette, B. (2004), Concrete Repair Technology – A revised approach is needed, Concrete International, 1: 59-65.
3. Granju, J.-L. (2004) 193-RLS RILEM TC Bonded Cement-based Material overlays for the Repair, the Lining or the Strengthening of Slabs or Pavements, State-of-the-Art Report, France, 114 p.
4. Vaysburd A.M., Sabnis, G.M., Emmons, P.H., McDonald, J.E. (2001) Interfacial Bond and Surface Preparation in Concrete Repair, Indian Concrete Journal, 15: 27-33.
5. Courard, L. (1999) How to analyse thermodynamic properties of solids and liquids in relation with adhesion?, Proceedings of the 2nd International RILEM Symposium ISAP’ 99, 9-19. 6. Beushausen H.D. (2005) Long-term Performance of Bonded Concrete Overlays Subjected to
Differential Shrinkage, Ph.D. Thesis, University of Cape Town, South Africa, 265 pp.
7. Pigeon, M., Saucier, F. (1992) Durability of repaired Concrete Structures, Proceedings of
International Symposium on Advances in Concrete Technology, Athens, 741-773.
8. Emmons, P.H., Vaysburd, A.M. (1993) Factors Affecting Durability of Concrete Repair,
Proceedings of Fifth International conference on Structural Faults and Repair – 93,
Edinburgh, UK, 253-267.
9. Cardon, A.H., Hiel, C.C. (1986) Durability Analysis of Adhesive Joints, RILEM Symposium
10. Courard, L., Darimont, A. (1998) Appetency and adhesion: analysis of the kinetics of contact between concrete and repairing mortars, RILEM International Conference, Interfacial
Transition Zone in Cementitious Composites (Eds. A. Katz, A. Bentur, M. Alexander and G.
Table of contents
Table of contents ... i
List of tables ... iii
List of figures ... iv
Section 2 – Evaluation of existing techniques for the characterization
of concrete surface roughness (CRC Proposal Task 1) ... 1
2.1 Introduction ... 1
2.2 Concrete surface profile (CSP) ... 4
2.3 Sand patch test ... 5
2.4 Mechanical profilometry ... 6
2.5 Laser profilometry ... 8
2.6 Interferometric surfometry ... 10
2.7 Profile description ... 11
2.8 Profile description with advanced methods ... 16
2.9 Experimental comparison and analysis of the techniques ... 17
2.9.1 Concrete substrates and surface treatments ... 17
2.9.2 Evaluation of concrete surface texture with sand patch test ... 19
2.9.3 Mechanical vs. laser profilometry ... 23
2.9.4 Surface roughness characterization with the microscopic observation method ... 27
2.9.5 Concrete surface texture evaluated with mechanical and interferometric methods ... 30
2.10 Conclusions ... 35 2.11 References ... 37 2.12 Standards and test methods ... 40
List of tables
Table 2-1: Comparison of various methods of concrete surface geometry characterization ... 3
Table 2-2: Concrete surface treatment methods and corresponding CSP’s ... 4
Table 2-3: Vertical amplitude parameters of surface profile as per EN ISO 4287 ... 7
Table 2-4: Horizontal amplitude parameters of surface profile as per EN ISO 4287 ... 8
Table 2-5: Surface profile make up ... 14
Table 2-6: Abbott curve parameters ... 15
Table 2-7: Composition and compressive strength of tested concrete substrates ... 19
Table 2-8: Results of the sand patch test for the various surface treatment techniques ... 20
Table 2-9: SEM observations of concrete surfaces after various treatments ... 21
Table 2-10: The examples for concrete surface roughness representation with mechanical (left) and laser (right) profilometry ... 24
Table 2-11: Stereological parameters evaluated with the microscopic method for various types of surface preparation ... 28
Table 2-12: Surface preparation of specimens tested through interferometric and mechanical profilometry ... 31
Table 2-13: Surface profile characteristics determined through mechanical profilometry – waviness (W), roughness (R) and Abbot parameters (C) ... 32
Table 2-14: Surface profile characteristics determined through interferometric profilometry – overall shape (F), meso-waviness (M) and Abbot parameters (C) ... 34
List of figures
Figure 2-1: Measurement of surface macrotexture with the sand patch test procedure ... 5
Figure 2-2: Mechanical profilometer developed at the University of Liège – a) scheme of the
measuring device; b) stylus used in concrete surface roughness evaluation; c) influence of the stylus geometry on the recorded profile ... 7
Figure 2-3: Examples of 3D representation with surfometry, waviness and roughness profiles
after different surface treatments, as determined through mechanical
profilometry (University of Liège) ... 9
Figure 2-4: Laser profilometry with optical displacement meter – a) experimental setup; b) 3D
representation of a shotblasted concrete substrate (Warsaw University of
Technology) ... 10
Figure 2-5: Examples of 3D representation of specimen surfaces obtained by laser
profilometry after waviness and roughness filtering ... 12
Figure 2-6: Optomorphological profilometry – a) principle of measurement; b) relationship
between form and level line; c) testing equipment; d) example of 3D
representation of concrete surface (University of Liège) ... 13
Figure 2-7: Laser profilometry – a) schematic representation of the laser profiling testing
device; b) line laser; c) laser image of a concrete surface ... 13
Figure 2-8: Effect of scale on profile decomposition ... 14
Figure 2-9: The Abbott curve and its interpretation ... 15
Figure 2-10: Illustration of a) sampling for microscopic observation; and b) surface geometry
characterization with laser and mechanical profilometry ... 18
Figure 2-11: a) Significance of the RS and RL parameters; b) evaluation of the RS value using
grid of cycloids ... 18
Figure 2-12: Influence of the sand volume used in the sand patch test ... 23
Figure 2-13: Waviness parameters a) Wt and b) Wa; microroughness parameters c) Rt
and d) Ra; as determined through laser and mechanical profilometry ... 25
Figure 2-14: Relationships between waviness parameters a) Wa, b) Wt and Wv and c) Abbott
parameters, determined through laser (∆) and mechanical (•) profilometry; d) relationship of Was and Wap vs. SRI ... 27
Figure 2-15: Relationships a) RS vs. SRI and b) RS vs. arithmetic mean deviation of waviness
Figure 2-17: 3D representation of surfaces and corresponding roughness and waviness
Àprofiles for three different types of treatment ... 33
Figure 2-18: Use of an interferometric measuring device for concrete surface
characterization ... 34
Figure 2-19: ICRI CSP evaluation (Guideline No. 310.2R–2013) – a) photographs of the nine
replicates ordered from 1 to 9; b) characterization of the CSP replicates
Section 2 – Evaluation of existing techniques for the characterization
of concrete surface roughness
(CRC Proposal Task 1)
This section of the report is related to Task 1 of the project, which is devoted to the evaluation of existing techniques for the characterization of concrete surface roughness. For the most part, the research operations have been performed in the laboratories of the Department of Building Materials Engineering (DBME) at the Warsaw University of Technology (Poland), GeMMe Building Materials in the ArGEnCo Department at the University of Liège (Belgium), and Laval University, Quebec (Canada).
2.1 Introduction
The roughness of the substrate is one of the parameters often considered to affect adhesion strength between repair material and existing concrete.
Nevertheless, this has been controversial for a number of years: some reported bond test results have shown that surface roughness exerts only a minor influence on the tensile bond. For instance, in the tests performed by Silfwerbrand [1], adhesion to rough, water-jetted surfaces was compared with bond to smooth sandblasted surfaces. It was concluded that there could be a roughness “threshold value” beyond which further improvement of the substrate roughness would not enhance bond strength. According to these test results, the “threshold value” ought to be close to the surface roughness of typical sandblasted surfaces. However, it remains the opinion of many specialists in the industry that a rougher surface is beneficial to bond strength. Given that roughness depends directly on the surface preparation method, the investigations
presented here are intended to shed new light on the subject and ultimately resolve the controversy.
According to American National Standards Institute (ANSI) [2], the methods for measuring roughness and surface texture can be classified into three types: contacting methods, taper sectioning and optical (non-contacting) methods. Taper sectioning is used in metallurgy and involves cutting across a surface at a low angle α to physically amplify asperity heights by ctg α [3]. Among the contacting methods there are stylus-type profilometers, tactile tests, measurement of kinetic friction, measurement of static friction, rolling ball measurements, and measurement of the compliance of a metal sphere with a rough surface. Optical (non-contacting) methods include laser profilometry, interferometry and optical reflecting instruments. Light microscopy and scanning electron microscopy may be counted in this group of methods.
A state-of-the-art review on roughness quantification methods for concrete surfaces was recently presented by P. Santos et al. [4] (Table 2-1).
A variety of approaches have been used over the years to characterize the surface roughness of concrete: evaluation of the proportion of the surface occupied by aggregates, measurement of the maximum roughness amplitude, adhesion tests, calculation of surface parameters based on image analysis or on microscopy observations, etc. However, many of these methods are unable to provide a sufficiently detailed representation of the actual surface profile for the calculation of morphological and statistical parameters and are not user-friendly under field conditions. In order to achieve a reliable quantitative analysis of superficial concrete morphology after surface preparation, different profilometry and surfometry techniques can be used [4–10]. The data obtained through such techniques makes it possible to conduct a real
the total superficial profile [11] and from the filtered waviness (low frequency/macroroughness) and roughness (high frequency/microroughness) profiles [12]. Some of these parameters, e.g., the arithmetic mean profile and the flatness coefficient, are particularly effective, both for the shape of valleys and peaks, as well as for their amplitude and frequency [13].
Table 2-1: Comparison of various methods of concrete surface geometry characterization [4] Roughness quantification method Quantitative evaluation
Non-destructive Cost Portable
Work intensive
Contact with the surface
Concrete surface profile (CSP) No Yes Low Yes No No
Sand patch test Yes Yes Low Yes No Yes
Outflow meter Yes Yes Low Yes No Yes
Mechanical stylus Yes No Moderate No Yes Yes
Circular track meter Yes Yes Moderate Yes No No
Digital surface roughness meter Yes Yes Moderate Yes No No
Microscopy Yes No High No Yes No
Ultrasonic method No Yes Moderate Yes No No
Slit-island method Yes No Low No Yes Yes
Roughness gradient method Yes No Low No Yes Yes
Photogrammetric method Yes Yes Moderate Yes Yes No
Shadow profilometry Yes Yes Low Yes Yes Yes
Air leakage method No Yes Low Yes No Yes
PDI method Yes No Low No Yes Yes
2D LRA method Yes Yes Moderate Yes No No
3D laser scanning method Yes Yes High Yes No No
The selected characterization techniques were compared for effectiveness, accuracy, consistency and field applicability. The following techniques were analyzed on a comparative basis:
• Concrete surface profile (CSP), in accordance with ICRI Guideline No. 310.2R-2013. • Sand patch test, in accordance with ASTM E965 (similar to EN 13036-1:2010) and
• Mechanical profilometry, in which a high-precision extensometer is moved over the entire. surface to obtain a 3D map (with x, y and z coordinates) from which morphological parameters are computed.
• Laser technique, in which the superficial elevation (distance from the laser beam source to the object) of each point is calculated on the basis of the laser beam transit time. • Interferometric profilometry, based on observation and analysis of the shadow produced
by the superficial roughness of the surface (moiré fringe pattern principle).
The aim of this task is to identify the most suitable techniques for both laboratory and field use, as well as the most relevant quantitative roughness characteristics [14].
2.2 Concrete surface profile (CSP)
The visual observation of surface roughness is the simplest evaluation method, but it is rather subjective. The systematic approach for visual surface qualification was proposed by ICRI
(ACI 562 Repair Code). The reference replicates that make up the CSP (
Table 2-2)
represent
concrete surfaces after typical surface treatments commonly used in the field: details are given in the ICRI Guideline No. 03732. The range of evaluation is, however, limited to gentle surface treatments.Table 2-2: Concrete surface treatment methods and corresponding CSP’s
Profile reference replicates Surface preparation methods CSP
Detergent scrubbing 1
Low-pressure water cleaning 1
Acid etching 1–3
Grinding 1–3
Abrasive blasting (sand) 2–5
Steel shotblasting 3–8 Scarifying 4–9 Needle scaling 5–8 Water jetting 6–9 Scabbling 7–9 Flame blasting 8–9
2.3 Sand patch test
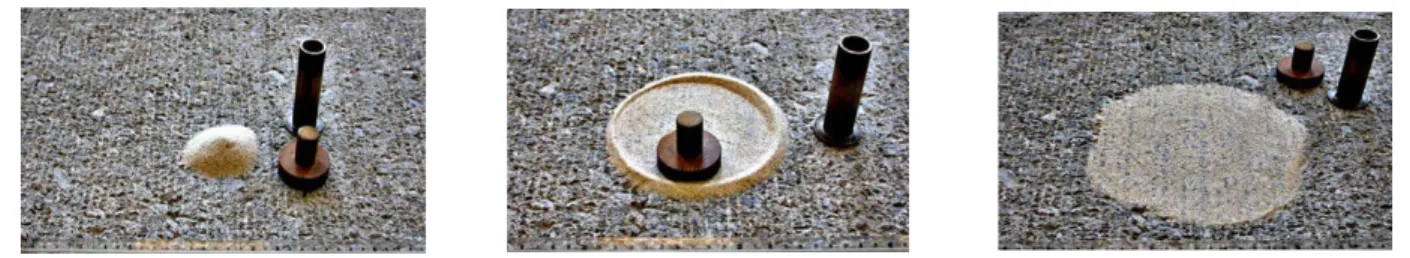
The sand patch tests described in ASTM E965 (very similar to EN 13036-1:2002) is one of the most commonly used methods for examining the macrotexture depth of concrete surfaces, mainly for road and airfield pavements. This method consists in careful application of a specific volume and grading of particles (glass spheres or sand) onto a surface and subsequent measurement of the total area covered (Figure 2-1).
Figure 2-1: Measurement of surface macrotexture with the sand patch test procedure
The surface roughness is characterized by the mean texture depth (MTD), calculated in accordance with Equation 2-1:
]
[
2
4
mm
D
V
MTD
π
=
(2-1)where: V = volume of granular material [mm3]
D = diameter of circle covered by granular material [mm]
A similar method for evaluating surface roughness is proposed in the European standard EN 1766:2000 in the case of concrete substrate preparation prior to repair. Silica sand with a 100/50 µm grading size is recommended for evaluation. The surface roughness index (SRI) is calculated in accordance with Equation 2-2:
1272
2 ⋅
=
D
V
SRI
(2-2)where the symbols are the same as in Equation 1-1; V = 25 mL is recommended.
The advantages of the sand patch method are its speed, non-destructive character and applicability in situ; a disadvantage is that the surface has to be protected from wind and rain. The main limitations are the range of validity (from 0.25–5 mm only) and the fact that it can be used only on horizontal surfaces.
2.4 Mechanical profilometry
In this method, deviations of the surface geometry are detected by a sensor (stylus) that moves along the surface [3, 4]. The gauge turns vertical deflections of the stylus position into electrical signals which are recorded by the computer, thus creating a surface profile (Figure 2-1a). It is possible to regulate the distance between measurement points for better precision [4]. The geometry (round or conical) and size (radius) of the extremity of the stylus are of prime significance for the profile to record: some profiles characterized by small wavelengths will not detected if the diamond cone radius is too large (Figure 2-2b, c).
Roughness measurements usually yield images of the profile. To analyze the influence of the treatment on the surface, it is necessary to mathematically and statistically quantify the shape of the surface by means of several parameters (Table 2-3 and Table 2-4). Another approach is surfometry, a surface metrology of the profile rendered in 3D: in this case, the profilometer is used to obtain several profiles in parallel. The results are analyzed in two orthogonal directions (x,y) to generate a 3D representation of the surface (Figure 2-3). This method yields a
a)
b)
c)
Figure 2-2: Mechanical profilometer developed at the University of Liège – a) scheme of the measuring device; b) stylus used in concrete surface roughness evaluation; c) influence of the stylus geometry on the recorded profile
Table 2-3: Vertical amplitude parameters of surface profile as per EN ISO 4287
Symbol Parameters Definition
mx Mean value and line
Line whose height (mean value) is determined by minimal sum square deviation of the profile defined as follows:
∑
=
min
y
2(
x
)
X
Xp height Maximum peak Distance between the highest point of the profile and the mean line
Xm depth Minimum valley Distance between the lowest point of the profile and the mean line
Xt Maximum height
Maximum distance between the lowest and the highest point of the profile and its equal:
)
max(
p m tX
X
X
=
+
Xa Xa' Arithmetic mean deviationMean departure of the profile from the reference mean line as follows:
∫
=
l ay
x
dx
l
X
0(
)
1
, approximated by∑
= ≈ n i i a y n X 1 1 'Xq deviation Root mean square
Statistical nature parameter defined in the limits of the cut-off length as follows:
∫
=
l qy
x
dx
l
X
0 2(
)
1
Xp Xt Xa stylus type real profile profile registeredlocal mean line
evaluation length sampling length
Table 2-4: Horizontal amplitude parameters of surface profile as per EN ISO 4287
Symbol Parameters Definition
Sk
Skewness of surface height distribution
A measure of asymmetry of profile deviations about the mean line,
as follows:
∑
= = n i i q k Y n R S 1 3 3 1 1Sm Mean period of profile roughness
Mean value of mean line consecutively including a peak and a valley Smi, as follows:
∑
= = n i mi m S n S 1 1np Bearing length Sum of partial lengths nparallel to the mean one for a given cutting level i corresponding to the profile cut by a line
tp Bearing length ratio Ratio between bearing length and cut-off length, expressed as a percentage: t p = np/l.
l
Sm1 Sm2 Sm3 Smi mean line
maximum line cutting level mean line minimum line n1 n2 ni
2.5 Laser profilometry
The laser profilometry method essentially consists in laser travel measurement with an optical displacement sensor [10], as shown in Figure 2-4. The most recently developed laser profilometers are fast and accurate and allow the measurement of surface topography down to the sub-micrometer level over an area of 500 × 500 mm, in both 3D and 2D outputs. The technique is based on the principle of optical triangulation and requires a light source (commonly a diode laser), imaging optics and a photodetector. A diode laser is used for generating a collimated beam of light, which is then projected onto a target surface. A lens is focused on the spot of the laser light reflected onto a photodetector, which generates a signal that is proportional to the spot’s position on the detector. As the target surface height changes (z), the image spot may shift due to the parallax. The sensor scans in two directions (x,y) to generate a 3D image of the surface of the element being characterized. Examples of concrete surface
3D representation with surfometry
Waviness profile Roughness profile a) Without treatment (NT)
b) Grinding (GR)
c) Sandblasting (SB)
d) Shotblasting 35s (SHB35)
e) Mechanical milling (MM)
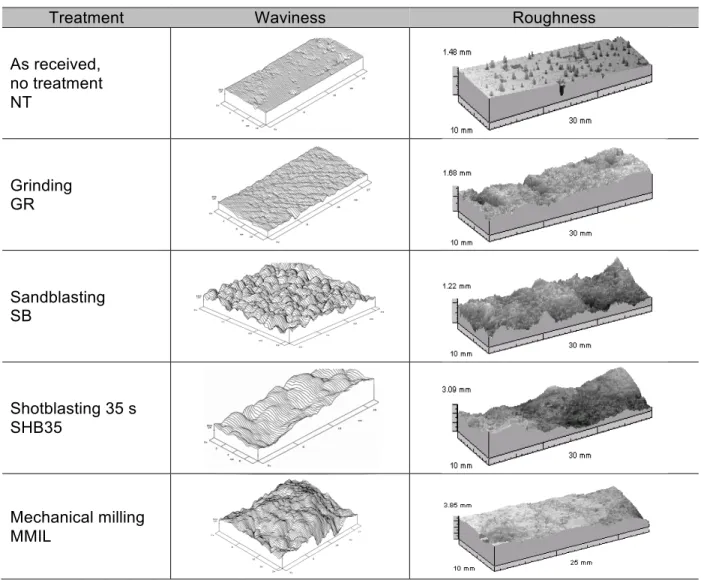
Figure 2-3: Examples of 3D representation with surfometry, waviness and roughness profiles after different surface treatments, as determined through mechanical profilometry (University of Liège)
The first applications of commercial laser profilometry were used to characterize surface geometry for tribology [11]. The technique has also been used to characterize concrete surfaces [8-11].
The recently developed circular track meter (CTM), in which a CCD laser displacement sensor is used, belongs to the same group of profilometers. Eight individual segments are
direction. The CCD is mounted on an arm which is driven by a DC motor and rotates at 80 mm above the surface with a 142 mm radius. The data are segmented into eight 111.5 mm arcs of 128 samples each. The profile characterization data generated with CTM are the average profile depth and the root mean square (RMS). More details can be found in the ASTM E2157-01 standard.
a)
b)
Figure 2-4: Laser profilometry with optical displacement meter – a) experimental setup; b) 3D representation of a shotblasted concrete substrate
(Warsaw University of Technology)
2.6 Interferometric surfometry
The various types of profilometers described before are mainly used in laboratory conditions. Recent studies have been devoted to the development and experimentation of optical devices (Figure 2-6a) which can be used in the field for civil engineering applications [6, 7, 14, 16]. Systems based on the moiré projection technique are exhibiting very interesting potential for that purpose. The moiré phenomenon appears when two networks of light rays, made of equidistant lines (alternately opaque and transparent) are superimposed. The technique of surface profile
pattern projected on a non-plane surface (Figure 2-6b). The moiré fringes are similar to level lines representing the height variations of the object’s surface. When a network of parallel fringes is projected onto a plane surface, it will not be deformed, but when projected onto an unspecified shape, this same network will be deformed. The main principle of the test is to compare two images with different moiré networks. The first image is the reference: it corresponds to the network of non-deformed parallel fringes. The second image contains the projected network deformed with respect to the non-plane shape. An algorithm analyzes the image and compares the grid of calibration and the deformed grid.
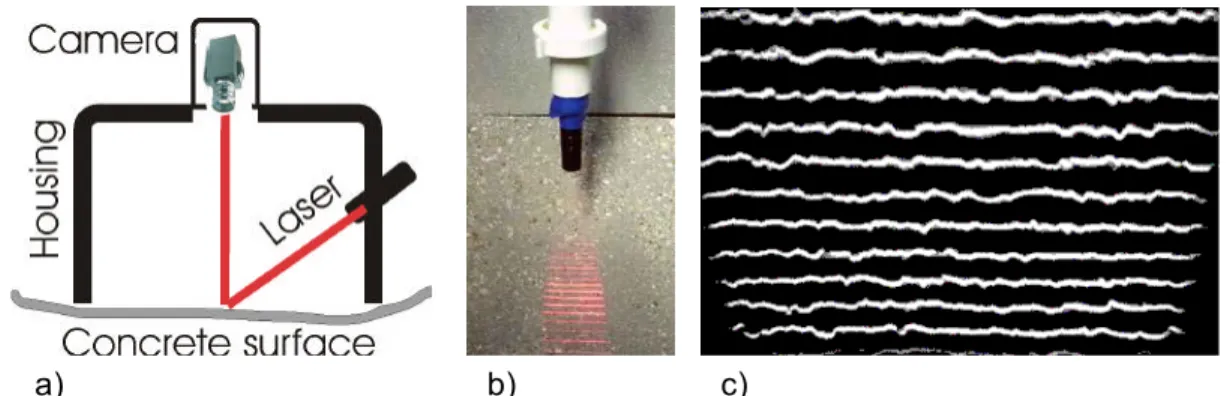
Maerz et al. [8] developed a portable concrete roughness testing device consisting of an optical laser-based imaging system that operates in accordance with the principles of the Schmaltz microscope and the shadow profilometry method. It uses a laser profiling line (“laser striping”) that produces a non-Gaussian (i.e., uniform) distribution of light intensity along the line. The investigated concrete surface is illuminated with thin slits of red laser light at an angle of 45° while the observations are performed at 90° (Figure 2-1). A high-resolution (tiny) board CCD camera with a 7.5 mm lens is fixed vertically on the protection housing.
2.7 Profile description
After treatment, concrete surfaces present fractal topography. As with any fractal object, it is possible to break up this surface or this profile into a series of sub-profiles. Each sub-profile can be differentiated in terms of wavelength: there are, however, no limits or precise criteria involved in validating the choice of decomposition method (Figure 2-8). It is also possible to filter the results mathematically [5]. Since the two surfometry methods (mechanical and interferometry) have different resolution levels, it is possible to obtain complementary scales of topography. The
(Table 2-5: Surface profile) [4]. With the interferometry method at a resolution of 0.200-µm, it is possible to obtain two higher scales named meso-waviness (M) and shape (F). In mechanical profilometry, filtering is often carried out through the use of stylus with different diameters.
Treatment Waviness Roughness
As received, no treatment NT Grinding GR Sandblasting SB Shot-blasting 35s SHB35 Hand milling HMIL Mechanical milling MMIL
Figure 2-5: Examples of 3D representation of specimen surfaces obtained by laser profilometry after waviness and roughness filtering
a) b)
c) d)
Figure 2-6: Optomorphological profilometry – a) principle of measurement; b) relationship between form and level line; c) testing equipment; d) example of 3D representation of concrete surface (University of Liège)
a) b) c)
Figure 2-7: Laser profilometry – a) schematic representation of the laser profiling testing device; b) line laser; c) laser image of a concrete surface
Figure 2-8: Effect of scale on profile decomposition
Table 2-5: Surface profile make up
Roughness
High frequencies gap between grooves (amplitude) Rm is 5–100 times the depth Rt
Rm Rt roughness: Rm = (5...100)·Rt Waviness Mean frequencies amplitude Wm is 100–1000 times the depth of holes Wt
waviness: Wm = (100...1000)·Wt
Wm
Wt
In accordance with EN ISO 4287, the total (primary) profile, the waviness and roughness profiles can be characterized by several vertical (Table 2-3) and horizontal (Table 2-4) amplitude parameters. Surface parameters are determined on the basis of the mean line as a reference line: this reference is usually defined in such a way that, in the limits of the profile length, the sum of the squared values of the altitudes of the profile measured versus this reference line is
Using horizontal profile parameters, the Abbott curve, also referred to as the bearing curve [4], can be determined. This provides information about the surface profile: a gradual decrease in the curve suggests a surface with few holes, while a more steeply decreasing curve is characteristic of a surface with a lot of holes. Important parameters for analyzing the distribution of holes and peaks, as well as the shape of the profile can be graphically calculated from the Abbott curve (Table 2-6). These parameters are crucial when it comes to evaluating of the quantity of slurry, mortar, etc., needed for the interface area between the concrete substrate and the new layer (Figure 2-9).
Table 2-6: Abbott curve parameters
Symbol Parameters Definition
CR Relative height of the peaks Gives an idea of significance of the volume of very high peaks above the reference line
CF Depth of the profile Excluding high peaks and deep holes gives information on surface flatness; a lower value of C F indicates great surface flatness
CL Relative depth of the holes Gives an idea of the significance of the volume of voids under the reference line
topo graph y height [ µ m] 40% 20% 60% 80% n1 n2 n3 n4 n5 Σn30% 0% 0% 100% 0% 100%
fulfilled profile progresive rise highly cracked profile stepl rise
C F C R C L 100% !
2.8 Profile description with advanced methods
Concrete surface geometry can be characterized using a scientific approach called quantitative fractography, which is based on image analysis [15, 17]. This approach is well developed in the case of metals and ceramics in comparison with the situation prevailing for concrete-like composites [15–18]. However, geometrical and stereological parameters are also of significant importance in concrete-like composites [19–23]. Besides the profile parameters determined as per EN ISO 4287, three additional stereological parameters could be considered for characterization of concrete surfaces after surface treatment [15, 20]: the profile (linear) roughness ratio RL, the surface roughness ratio RS, and the fractal dimension D. The first two parameters are obtained with the following equations:
RL = L/LO (2-3)
where: L = length of the profile line
LO = projected length of the profile line
RS = S/SO (2-4)
where: S = true fracture surface area
SO = apparent projected area
The fractal dimension D was introduced in materials science by Mandelbrot as a characteristic allowing to define the irregularity of an object boundaries [22]. The basic requirement for the fractal boundary is that some structural feature(s) or unit(s) is (are) sequentially repeated at different levels. This implies that, from a statistical point of view, similar morphology can be observed in a wide fracture surface magnification range: a measure of this self-similarity is a fractal dimension.
These stereological parameters can either be determined from the image of the profile recorded on the specimen cross-section or the profile obtained by profilometry. The geometry of the fracture surface of concrete-like composites is related to the scale of observation. This implies that the self-similarity of the fracture surface may not extend over all magnification ranges.
Due to the inherent technical difficulties in evaluating RS, examination of cross-section profiles is frequently opted for, and the profile roughness ratio RL is calculated using Equation 2-3. Determination of RL from the profile image is easy with automated profilometry and image analysis (Figure 2-11a). Recent developments in stereological methods allow to estimate RS from fracture profile studies without simplifying assumptions concerning the relationship between
RL and RS. The surface roughness ratio RS can be effectively evaluated using a vertical sectioning method [15]. In this method, an arbitrary axis is chosen, and the specimen is saw cut parallel to this axis (Figure 2-10). It has been shown that sections sampled on three saw cut planes forming an angle of 120° around the axis are sufficient to characterize the surface profile and evaluate satisfactorily RS [24]. Wojnar [17] proposed a procedure to evaluate RS which consists in counting the intersection points of the fracture profile with a so-called grid of cycloids (Figure 2-11b). The cycloids allow to relate the fracture area directly to the fracture profile, and the estimation of RS is independent of the magnification.
2.9 Experimental comparison and analysis of the techniques
2.9.1 Concrete substrates and surface treatments
Warsaw University of Technology. The series of experiments may be divided into three groups covering altogether a wide range of concrete strength values and types of surface preparation. The basic mixture design characteristics and average compressive strengths of the tested concretes are summarized in Table 2-7.
a) b)
Figure 2-10: Illustration of a) sampling for microscopic observation; and b) surface geometry characterization with laser and mechanical profilometry
a) b)
Figure 2-11: a) Significance of the RS and RL parameters; b) evaluation of the RS value using grid of cycloids
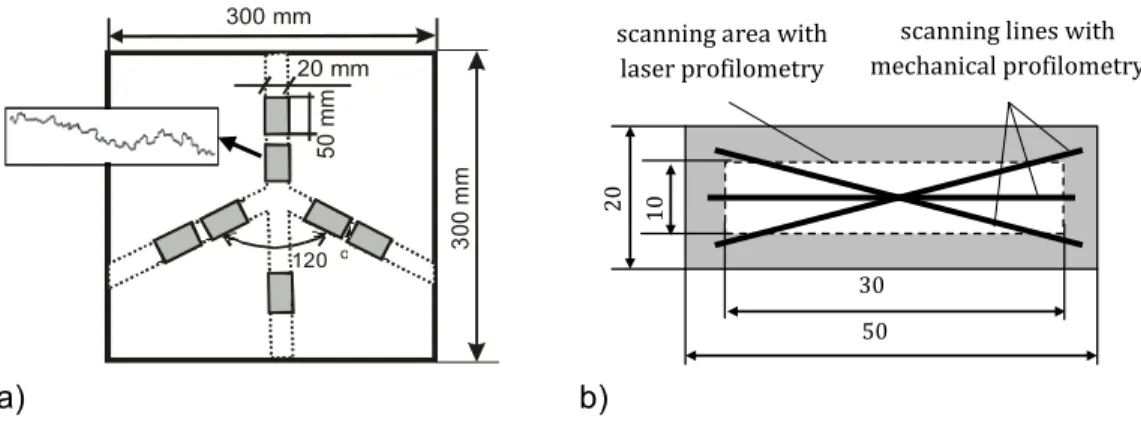
120 o 300 mm 3 00 m m 20 mm 50 m m 10 20 30 50
scanning area with laser profilometry
scanning lines with mechanical profilometry a) b) me as ur eme nt re ct an gle RS = 2Nh/m
N - total number of the profile intersections h - measurement rectangle height
m - total number of cycloids in measurement rectangle.
R
S = S/SO RL = L/LO
Table 2-7: Composition and compressive strength of tested concrete substrates
Constituent / comp. strength
Group A Group B Group C
C20A C25B C35B C50B C30C C40C C45C
Cement CEM I 32.5 R CEM I 32.5 R CEM I 52.5 N
Sand River sand
(0/2) River sand (0/2) S-RRWSC-7 (0/2) Aggregate Gravel 2/8 Gravel 2/8, 8/16 Crushed limestone 2/8, 8/14, 14/20 W/C 0.60 0.54 0.42 0.31 0.72 0.59 0.50 Plasticizer no yes no fc 28-d (MPa) n/a 31.5 45.7 62.1 35.0 41.3 48.8
For each series of concrete slabs, four different surface preparation methods were used. In order to yield differences in profile roughness and the level of microcracking in the near-to-surface layer, the following near-to-surface treatment methods were selected in each group:
• Group A: Grinding (GR), sandblasting (SB), shotblasting (SHB20, SHB35 and SHB45, with treatment times of 20, 35, and 45 seconds, respectively), hand milling (HMIL) and mechanical milling (MMIL); untreated concrete samples (NT) were also tested as a control;
• Group B: Polishing (PL), dry sandblasting (SB-D), jack hammering (JH) and water jetting at 250 MPa pressure (HD);
• Group C: Gentle surface preparation methods were used to obtain profiles of similar amplitude and low-level microcracking: brushing (NT), wet sandblasting (SB-W), scarifying (SC) and water jetting at 12 MPa pressure (LC).
2.9.2 Evaluation of concrete surface texture with sand patch test
European standards EN 1766:2000 and EN 13036-2010 state that the validity of this measurement ranges from 0.25 to 5.0 mm. The results for the three groups are presented in Table 2-8.
The results for Group A clearly show the significant effect of treatment aggressiveness on surface roughness of the concrete substrate [27]. The SEM images and qualitative descriptions
strength of the substrate concrete increases. Besides, the results for the polished slabs C40-P and C50-P are beyond the range of validity of the SPT, while the results for slabs C30-P and C40-HD (water jetting) fall just within. The surface obtained with water jetting is also very irregular, and the results are characterized by high coefficients of variation. Overall, water jetting yielded the roughest profiles, followed by scabbling, sandblasting and polishing. In Group C, it can be noticed that the test specimen surfaces exhibit smaller differences in profile roughness, essentially because treatments were overall less aggressive than in the two other groups.
Table 2-9. The roughest surface treatments are shotblasting and sandblasting. Aggressiveness of the treatment strongly influences the quality of the near-to surface layer, as it governs the extent of induced microcracking [28].
Table 2-8: Results of the sand patch test for the various surface treatment techniques Group A
ID Surface treatment (mm) SRI ID Surface treatment (mm) SRI C20-NT No treatment 0.55 C20-SHB35 Shotblasting 35 s 1.59 C20-GR Grinding 0.72 C20-SHB45 Shotblasting 45 s 1.85 C20-SB Sandblasting 1.40 C20-HMIL Hand milling 0.79 C20-SHB20 Shotblasting 20 s 1.01 C20-MMIL Mechanical milling 1.05
Group B Group C
ID Surface treatment SRI
(mm) ID Surface treatment SRI (mm) C30-PL Grinding 0.25 C25-LC Water jetting 12 MPa 0.37 C40-PL 0.20 C35-LC 0.39 C45-PL 0.14 C50-LC 0.16 C30-SB-D Dry sandblasting 0.29 C25-BR Brushing 0.39 C40-SB-D 0.28 C35-BR 0.39 C45-SB-D 0.31 C50-BR 0.41 C30-SCA Scabbling 0.89 C25-SB-W Wet sandblasting 0.50 C40-SCA 0.89 C35-SB-W 0.61 C45-SCA 0.80 C50-SB-W 0.41 C30-HD Water jetting 250 MPa 2.22 C25-SC Scarifying 0.66 C40-HD 5.00 C35-SC 0.88 C45-HD 3.20 C50-SC 0.50
In general, it is found that a given treatment induces lower roughness as the strength of the substrate concrete increases. Besides, the results for the polished slabs C40-P and C50-P are beyond the range of validity of the SPT, while the results for slabs C30-P and C40-HD (water jetting) fall just within. The surface obtained with water jetting is also very irregular, and the results are characterized by high coefficients of variation. Overall, water jetting yielded the roughest profiles, followed by scabbling, sandblasting and polishing. In Group C, it can be noticed that the test specimen surfaces exhibit smaller differences in profile roughness, essentially because treatments were overall less aggressive than in the two other groups.
Example of surface view SEM:
magnification 25× (left) and 500× (right) Description Grinding
Surface without sharp edges with few and
non-uniformly located valleys at the surface; narrow cracks observed at higher magnifications.
Sandblasting
Surface similar to that after grinding; shallow
irregularities of surface (peak-to-valley height did not exceed 1 mm); sharp edges of aggregate particles and microcracks observed at higher magnifications, very often forming non-uniform networks.
Shotblasting
Highest roughness of surface increasing with the treatment time; high irregularities of surface (peak-to-valley height increased locally to 7 mm for 45
seconds); formation of a dense network of microcracks and cracks, often along aggregate particles, as well as presence of deteriorated or removed particles were observed with increased treatment time.
Milling
Surfaces after milling similar and close to the concrete surface after shotblasting; very high irregularity of the surface, but lower than that after shotblasting; at higher magnifications deep and wide cracks, signs of particle removal and loosed concrete fragments were observed.
Further, the repeatability of the sand patch test and the effect of the volume of sand were analyzed. The tests were performed on four specimens of each concrete mixture from Group C. Comparison of the SRI values yielded when using 10 and 25 mL of sand, respectively, shows a very strong correlation (r = 0.95). However, the SRI values determined with a volume of sand of 25 mL were systematically 6% higher (Figure 2-12).
Figure 2-12: Influence of the sand volume used in the sand patch test
2.9.3 Mechanical vs. laser profilometry
A comparative study of surface roughness characterization with laser and mechanical profilometers was conducted using concrete specimens from the Group A series. Sampling was performed in accordance with the aforementioned vertical sectioning method (Figure 2-10). In the case of mechanical profilometry, the surface was scanned along three lines with a length of 30–40 mm; for laser profilometry, an area of 10 × 30 mm was scanned along parallel lines with a distance of 50 µm between the subsequent lines [12, 14]. Examples of surface roughness profiles are presented in Table 2-10.
The recorded profile was first transformed to remove the effect of the profile orientation (“shape” filtering) [6]. The total profile obtained was then filtered and decomposed into low and high frequencies to separate parameters of waviness and roughness, respectively. The filter used to separate waviness from the total profile was selected to be 0.8 mm for both methods. The total height of the profile Xt, the arithmetic mean of the deviations of the profile from the mean line Xa, and the maximum depth of valleys Xv, were selected for the surface geometry characterization for all levels of filtering [6], i.e., for the total (X = P), waviness (X = W) and
text, indexes p and s denote parameters measured by mechanical and laser profilometry respectively.
Table 2-10: The examples for concrete surface roughness representation with mechanical (left) and laser (right) profilometry
Treatment Waviness Roughness
As received, no treatment NT Grinding GR Sandblasting SB Shotblasting 35 s SHB35 Mechanical milling MMIL
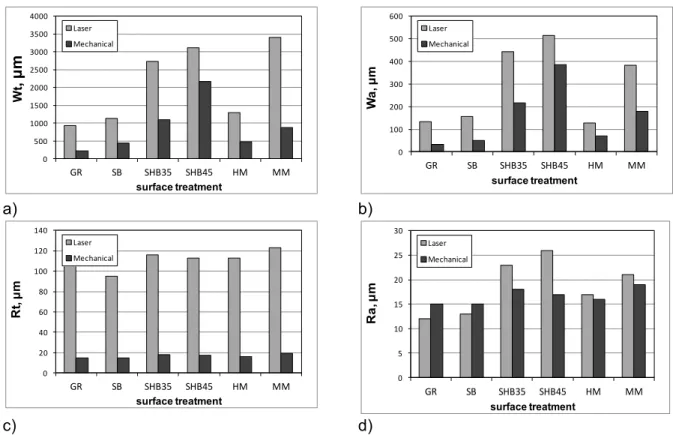
The results of surface geometry characterization with the four methods can be summarized as illustrated in Figure 2-13. The geometrical parameters determined for the microscopic level (profile amplitude parameters) generally indicate that the highest roughness was obtained for shotblasting after 45 seconds and the lowest for grinding (Figure 2-13). With respect to
5% for mechanical profilometry and by 9% for laser profilometry. This confirms that the overall shape of the profile has been preserved through the waviness filtering process.
a) b)
c) d)
Figure 2-13: Waviness parameters a) Wt and b) Wa; microroughness parameters c) Rt and
d) Ra; as determined through laser and mechanical profilometry
The mean roughness values are relatively close to each other, irrespective of the treatment type and the profilometry method being used (Rap = 17 ±2 and Ras = 19 ±7). However, with the same filtering technique, the total height of the roughness profile determined through laser profilometry was 2.8–5.5 times higher than that obtained with mechanical profilometry. Hence, roughness parameters cannot strictly be used as surface quality indicators after treatment (Figure 2-13c, d). 0 500 1000 1500 2000 2500 3000 3500 4000 GR SB SHB35 SHB45 HM MM Wt , µ m surface treatment Laser Mechanical 0 100 200 300 400 500 600 GR SB SHB35 SHB45 HM MM W a, µ m surface treatment Laser Mechanical 0 20 40 60 80 100 120 140 GR SB SHB35 SHB45 HM MM Rt , µ m surface treatment Laser Mechanical 0 5 10 15 20 25 30 GR SB SHB35 SHB45 HM MM Ra , µ m surface treatment Laser Mechanical
Both the total height and the mean value of the waviness profile measured with laser profilometry are of the order of 1.3 to 4.3 times higher than those calculated through the mechanical method and 7 times higher in terms of Abbott parameters.
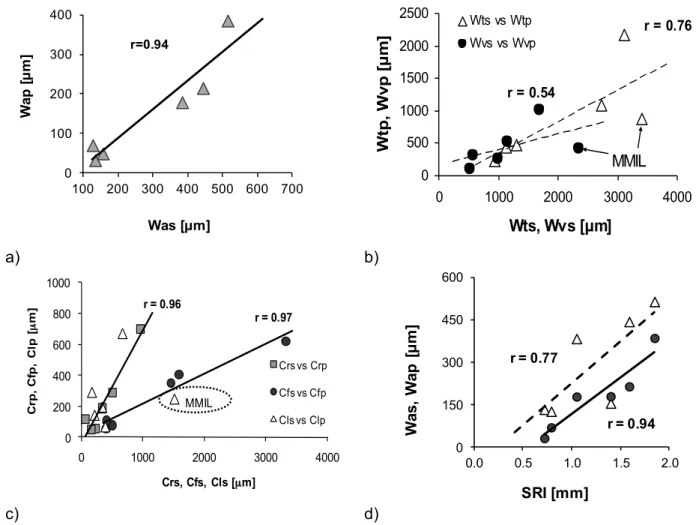
The relationships between parameters determined with laser and mechanical profilometry show different levels of statistical significance. Nevertheless, the results indicate that the surface profile characteristics determined with both methods are comparable, irrespective of the observation level. This observation is confirmed by the high correlation coefficient (r > 0.94) of the relationship between the corresponding mean values of waviness profile Wa (Figure 2-14a), and Abbott parameters CR and CF (Figure 2-14c). A higher scatter in the results for both profilometry methods was observed for other amplitude parameters. Lower statistical significance (Figure 2-14b) was obtained for the total heights of the waviness profile (Wts vs. Wtp) and the maximum depth of the valleys (Wvs vs. Wvp) as well as the relative depth of holes, CL (Figure 2-14c). This could be because of differences in the surface area scanned with laser and mechanical profilometry. However, Figure 2-14b and c indicate that the low correlation is due to the low values of amplitude parameters obtained though mechanical profilometry for the surface obtained with mechanical milling. This surface was too irregular and a significant number of deep and wide cracks (In general, it is found that a given treatment induces lower roughness as the strength of the substrate concrete increases. Besides, the results for the polished slabs C40-P and C50-P are beyond the range of validity of the SPT, while the results for slabs C30-P and C40-HD (water jetting) fall just within. The surface obtained with water jetting is also very irregular, and the results are characterized by high coefficients of variation. Overall, water jetting yielded the roughest profiles, followed by scabbling, sandblasting and polishing. In Group C, it can be noticed that the test specimen surfaces exhibit smaller differences in profile roughness, essentially because treatments were overall less aggressive than in the two other groups.
Table 2-9), which are better detected by the laser profilometer than by the stylus.
The relationship between Wa and SRI exhibits relatively high correlation coefficients (r), with values of 0.77 and 0.94 for laser and mechanical profilometry, respectively (Figure 2-14d). This confirms that SRI provides a satisfactory estimate of the mean deviation of a concrete surface profile and that it can be used for field evaluation of surface roughness.
a) b)
c) d)
Figure 2-14: Relationships between waviness parameters a) Wa, b) Wt and Wv and c)
Abbott parameters, determined through laser (∆) and mechanical (•) profilometry; d)
relationship of Was and Wap vs. SRI
r=0.94 0 100 200 300 400 100 200 300 400 500 600 700 Wa p [ µ m ] Was [µm] r = 0.76 r = 0.54 0 500 1000 1500 2000 2500 0 1000 2000 3000 4000 Wts, Wvs [µm] W tp , W v p [ µ m ] Wts vs WtpWvs vs Wvp MMIL r = 0.96 r = 0.97 0 200 400 600 800 1000 0 1000 2000 3000 4000 C rp, C fp , C lp [ µ m] Crs, Cfs, Cls [µm] Crs vs Crp Cfs vs Cfp Cls vs Clp MMIL r = 0.77 r = 0.94 0 150 300 450 600 0.0 0.5 1.0 1.5 2.0 Wa s, Wa p [ µ m ] SRI [mm]
Microscopic observations were performed on 20 × 50 mm samples that were sawn from 300 × 300 mm Group A test specimens (Figure 2-10a). The geometric length of the profile was 350 mm for each substrate type. The values of the stereological parameters RL and RS were calculated using the computer program Profile 1.1 [24] for the profile images recorded with a light microscope at 10× magnification. The fractal dimension Db was calculated with the same program using the box-counting method [25]. The results are summarized in Table 2-11: Stereological parameters evaluated with the microscopic method for various types of surface preparation. It can be seen that among the different types of surface preparation investigated, hand milling resulted in the highest profile variability. Besides, the values of Db are not found vary significantly from one method to the other and are comparable to those reported elsewhere for a wide range of concrete surfaces (Db = 1.03–1.25) [20–22, 26, 27]. Unfortunately, it means that the fractal dimension is not sensitive enough for evaluating concrete surface profile characteristics in a discriminating fashion.
Table 2-11: Stereological parameters evaluated with the microscopic method for various types of surface preparation
Surface preparation Statistical parameter Stereological parameters RL RS Db Mean (mm) 1.477 1.739 1.089 NT STD (mm) 0.077 0.116 0.038 CV (%) 0.052 0.067 0.035 Mean (mm) 1.451 1.703 1.110 GR STD (mm) 0.082 0.125 0.071 CV (%) 0.057 0.073 0.064 Mean (mm) 1.554 1.837 1.139 SB STD (mm) 0.127 0.262 0.041 CV (%) 0.082 0.142 0.036 Mean (mm) 1.563 1.870 1.104 SHB20 STD (mm) 0.116 0.171 0.035 CV (%) 0.074 0.091 0.032 Mean (mm) 1.578 1.892 1.084 SHB45 STD (mm) 0.180 0.262 0.038 CV (%) 0.114 0.138 0.035 Mean (mm) 1.475 1.682 1.085 HMIL STD (mm) 0.099 0.345 0.043 CV (%) 0.067 0.205 0.040 Mean (mm) 1.503 1.779 1.094 MMIL STD (mm) 0.099 0.148 0.042 CV (%) 0.066 0.083 0.039
(all data in the table represents the average results for three specimens)
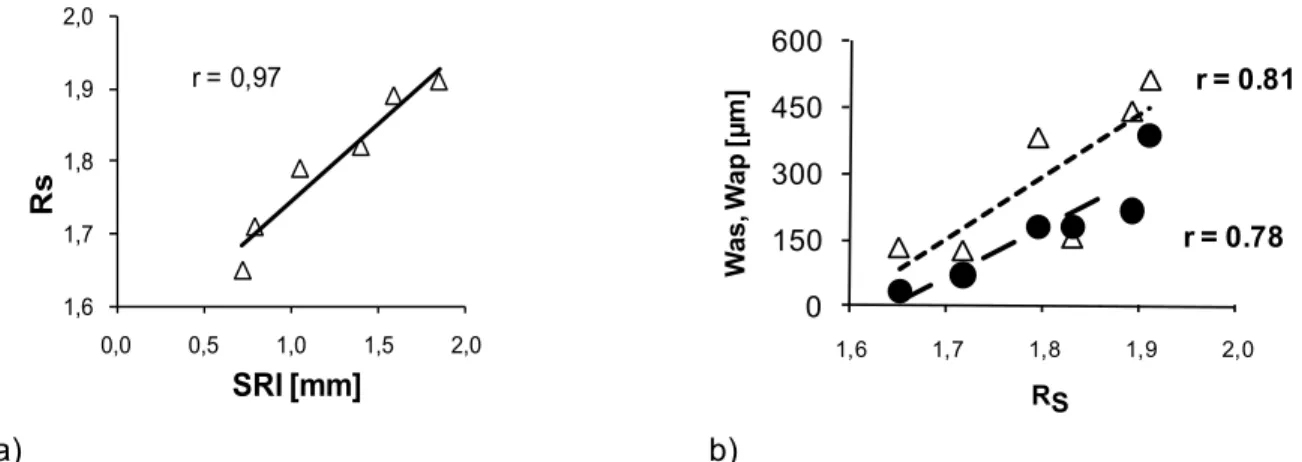
The analysis of the relationship between Rs and other parameters of profile characterization showed that Rs correlates strongly with SRI (high correlation coefficient r = 0.97; Figure 2-15a). The relationships between Rs and Was and Wap exhibit a weaker correlation (r ~ 0.8; Figure 2-15b).
a) b)
Figure 2-15: Relationships a) RS vs. SRI and b) RS vs. arithmetic mean deviation of
waviness profile, as determined through laser (Was) and mechanical (Wap) profilometry
2.9.5 Concrete surface texture evaluated with mechanical and interferometric methods
In a test comparison between mechanical and interferometric surface characterization approaches, three types of surface preparation techniques were investigated (Table 2-12): scarifying, high pressure water jetting (18,000 psi pressure and 6 gal./h water flow) and polishing. The latter was carried out using two abrasive rotating plates until the surface became smooth to the touch.
Figure 2-16 shows photographs of the respective profiles obtained with the surface preparation techniques investigated. A careful visual examination of all prepared surfaces leads to the following observations with respect to their macroscopic and visible effects:
• polishing produces a very smooth surface with brightness close to that of a mirror; • the high-pressure water jetting technique induces a particular texture characterized by
large waves mostly parallel to the water flow;
• scarifying generally induces some oriented macroroughness (grooved surface); in this study it was, however, intentionally eliminated by the operator by means of successive transverse and perpendicular operations.
r = 0,97 1,6 1,7 1,8 1,9 2,0 0,0 0,5 1,0 1,5 2,0 Rs SRI [mm] r = 0.81 r = 0.78 0 150 300 450 600 1,6 1,7 1,8 1,9 2,0 Wa s, Wa p [µ m ] RS
![Table 2-1: Comparison of various methods of concrete surface geometry characterization [4] Roughness quantification method Quantitative evaluation](https://thumb-eu.123doks.com/thumbv2/123doknet/6673727.182929/24.918.107.811.361.785/comparison-concrete-geometry-characterization-roughness-quantification-quantitative-evaluation.webp)