Using Single-Case Designs in Practical Settings: Is Within-Subject Replication Always Necessary?
Marc J. Lanovaz
Université de Montréal and Centre de recherche du CHU Sainte-Justine Stéphanie Turgeon
Université de Montréal Patrick Cardinal
École de Technologie Supérieure Tara L. Wheatley
Halton Catholic District School Board
Author Note
This research project was supported in part by a salary award (#30827) and a grant (#32612) from the Fonds de Recherche du Québec – Santé as well as a grant from the Canadian Institutes of Health Research (#136895) to the first author.
Correspondence concerning this article should be addressed to Marc J. Lanovaz, École de Psychoéducation, Université de Montréal, C.P. 6128, succursale Centre-Ville, Montreal, QC, Canada, H3C 3J7.
This is a post-peer-review, pre-copyedit version of an article published in Perspectives on Behavior Science. The final authenticated version is available online at:
Abstract
Behavior analysts have widely adopted and embraced within-subject replication through the use of reversal and multielement designs. However, the withdrawal of treatment, which is central to these designs, may not be desirable, feasible, or even ethical in practical settings. To examine this issue, we extracted 501 ABAB graphs from theses and dissertations to examine to what extent we would have reached correct or incorrect conclusions if we had based our analysis on the initial AB component only. In our first experiment, we examined the proportion of datasets for which the results of the first AB component matched the results of the subsequent phase reversals. In our second experiment, we calculated three effect size estimates for the same datasets to examine whether these measures could predict the relevance of conducting a within-subject replication. Our analyses indicated that the initial effects were successfully replicated at least once in approximately 85% of cases and that effect size may predict the probability of within-subject replication. Overall, our results support the rather controversial proposition that it may be possible to set threshold values of effect size above which conducting a replication could be considered unnecessary. That said, more research is needed to confirm and examine the generalizability of these results prior to recommending changes in practice.
Using Single-Case Designs in Practical Settings: Is Within-Subject Replication Always Necessary?
Within-subject replication has been central to the development of the science of behavior analysis since its inception with nonhuman organisms (Skinner, 1938/1991). Applied behavior analysts have widely adopted and embraced within-subject replication through the use of reversal and multielement designs to examine the effects of treatments in a wide variety of populations (Shadish & Sullivan, 2011). One of the main characteristic of the reversal and multielement designs is the repeated introduction and withdrawal of an independent variable to demonstrate experimental control.
The professionalization of behavior analysis over the past 30 years with the formation of credentialing organizations such as the Behavior Analyst Certification Board ® (see Johnston, Carr, & Mellichamp, 2017; Shook, 2005) has given rise to a generation of practitioners whose behaviors are controlled by a different set of contingencies than those governing the design and conduct of experiments. Specifically, the withdrawal of treatment, which is central to reversal and multielement designs, may not be desirable, feasible, or even ethical in practical settings. The most obvious example is related to the withdrawal of treatments that are designed to reduce behavior that may produce irremediable harm to the individual or others even if they occur only once (e.g., severe self-injury, unsafe gun use, risky sexual practices). That said, a behavior does not need to be dangerous to prevent the implementation of withdrawal in practical settings. For example, a parent or a teacher may simply refuse to stop implementing a treatment once they observe desirable changes in a child’s behavior. Behaviors that produce irreversible changes are also unconducive to designs involving withdrawal.
Another barrier encountered in practice is the cost, in terms of time and effort, associated with conducting additional baseline observation sessions. Imagine that the withdrawal of a treatment requires five additional observation sessions (Kratochwill et al., 2010; Horner et al., 2005). In some parts of Canada, publicly-funded agencies provide services to thousands of individuals with developmental disabilities and have extensive waiting lists (Ombudsman
Ontario, 2016; Québec Ombudsman, 2012). Assume that one of these agencies provides services to exactly 1,000 individuals and conducts five withdrawal sessions of 2 hr with each person, which requires the effort of one staff member. Not implementing withdrawal could therefore save 10,000 hr of work (not to mention additional session needed to reinstate the treatment), which would allow the agency to take on more clients and reduce waiting times for families in need. Cost issues also arise with families receiving privately- or insurance-funded services. Some families may be unable to afford the withdrawal phase or their insurance may only cover a limited number of sessions. From a practical standpoint, these concerns raise an important
question: Is within-subject replication always necessary in practical settings for the demonstrated effects to be believable?
The AB design is a quasi-experimental alternative to experimental designs that does not require the withdrawal of treatment. One issue with using the AB design is that the lack of replication increases the probability of reaching spurious conclusions about the effectiveness of treatment (i.e., Type 1 errors). The magnitude of this problem is, however, open to debate. Using Monte Carlo simulations, researchers have shown that the probability of a Type 1 error is low (i.e., < 0.05) when AB data are examined via visual analysis employing structured criteria (Fisher, Kelley, & Lomas, 2003; Krueger, Rapp, Ott, Lood, & Novotny, 2013; Novotny et al., 2014). One potential limitation of using simulated data is that the error may not correctly mimic
patterns observed with human participants. To address this issue, Lanovaz, Huxley, and Dufour (2017) recently replicated the study conducted by Fisher et al. (2003) using nonsimulated data. Similarly, they concluded that error rate remained low when the treatment phase contained at least five data points.
An interesting possibility is raised by evidence suggesting that AB designs lead to incorrect conclusions about the existence of an effect only infrequently: Perhaps the
withdrawal/replication strategy is not always necessary. In the present investigation, we tested this proposition by examining the actuarial extent to which effects observed in an initial AB component of actual clinical cases are replicated in subsequent phase reversals (from B1 to A2 and A2 to B2). Given the possibility that data from an initial AB component are an imperfect predictor of subsequent AB results, we also examined whether the effect size produced in the first AB component could predict the reliability of replication in subsequent components.
General Method
To examine the probability of replication of the effects observed in the initial AB component of ABAB designs, we extracted ABAB graphic datasets from theses and
dissertations, and then compared the outcome (i.e., clear change or no clear change) across phase changes within each dataset using structured criteria. Following the initial analysis, we calculated three measures of effect sizes for each dataset and examined to what extent each measure could predict the replication of the effects observed in the initial AB component.
Identification of ABAB Graphs
We chose to search for dissertations and theses in order to avoid publication bias reported in the behavioral literature (Sham & Smith, 2014); that is, we expected that published data would be less likely to included failed replications. To identify ABAB graphs, we searched the
ProQuest Dissertations & Theses Global Database between October 4th, 2016 and May 12th,
2017. Initially, we used the keywords “reversal design” or ABAB, and requested that only the results with full texts be displayed by relevance. This search yielded more than 12,000 results, which the second author would hand search in order until she had identified 500 graphs. After identifying 150 graphs, we conducted a second search to improve efficiency as the second author had not identified relevant graphs in more than 60 consecutive theses and dissertations. This second search used the keywords ABAB combined with “single case”. This strategy generated approximately 1,100 results. The second author continued to hand search the articles in order of relevance until we met our target. In total, we identified 501 graphs from 81 theses and
dissertations.
To be included in our analysis, a graph had to include an ABAB design where A represented a baseline condition and B a treatment condition, be based on empirical data, and have a minimum of three data points per phase. A graph could contain more than two replications (e.g., ABABAB), but we only kept the initial ABAB phases for our analyses. We rejected graphs that were missing multiple data points, used multiple probes, or if the quality of the graph did not allow the data to be extracted. If a graph contained two or more behaviors being measured
simultaneously, we counted each data path as a separate graph. However, we only kept the most representative path when two concurrent behaviors were highly correlated (i.e., had matching trends) to avoid biases introduced by having nearly identical datasets.
Data Extraction and Preparation
For each ABAB graph, we extracted the data from the four phases using
WebPlotDigitizer, a free web-based app designed to provide the value of data points on graphs (version 3.9; Rohatgi, 2017). Previous research has shown that, when applied to single-subject
research, this app renders data of adequate accuracy (Moeyaert, Maggin, & Verkuilen, 2016). We entered the resulting data values into a spreadsheet and specified the purpose of the treatment (i.e., increase or decrease behavior), which we subsequently used to conduct the analyses described below.
Study 1: Probability of Replication Procedures
To examine the probability of replication, we applied the dual-criteria method of analysis (Fisher et al., 2003) to the three phase changes in each dataset (i.e., A1 to B1, B1 to A2, and A2 to B2). We selected the dual-criteria method because (a) visual structured criteria are more reliable and objective than visual analysis alone, which minimizes biases introduced by the analyst (see Ninci, Vannest, Willson, & Zhang, 2015), and (b) it is the only visual analysis rubric for AB designs for which both power and Type I error rates are documented. To conduct the analyses, we programmed a PythonTM script to produce three graphs for each dataset: one graph
showing the first AB component, one graph showing the middle BA component, and one graph showing the final AB component. Each graph also contained a code indicating the expected direction of the behavior change (i.e., increase or decrease) as the method of analysis is unidirectional. In all cases, the first and final AB components had the same expected direction whereas the direction was reversed for the middle BA component. Each graph included a
continuation of the mean and trend lines from the first phase to the second phase, which allowed the application of the dual-criteria method. We counted the number of points falling above (when the purpose was to increase behavior) or below (when the target was to decrease behavior) both lines and compared it to the binomial distribution as described by Fisher et al. (2003).
We considered that a phase change showed a clear change when a sufficient number of points fell above or below both lines (see Table 1 from Fisher et al., 2003 for specific number of points); if not, we rated it as showing no clear change. This analysis allowed us to determine whether the introduction of the treatment (for phase changes from A to B) or the withdrawal of treatment (for the phase change from B to A) produced changes from the expected direction of the trend observed in the previous phase (Kazdin, 2011). For each dataset, we then compared the results of the first AB component to the subsequent BA and AB components. Specifically, we calculated the percentage of datasets for which all three components agreed (i.e., all showed clear change or all showed no clear change), and also the percentage of datasets for which the effects observed in the first AB component were replicated at least once.
Results and Discussion
Table 1 shows the empirically-determined probabilities of replication for our datasets. According to the dual-criteria method, the initial AB component of the ABAB graphs displayed a clear change in 280 datasets and a no clear change in 221 datasets. Results of the initial
component agreed with at least one of the two subsequent components about 85% of the time. Results of the initial component corresponded to those of both subsequent components about 64% of the time. To put our results into perspective, an analysis would require a power of .87 for an initial true effect to be detected and replicated at least once 85% of the time, and a power .86 for all three components agreeing on a true effect for 64% of the time. These results are
consistent with the power of the dual-criteria method reported by Fisher et al. (2013) for large effect sizes. Other investigators have also shown that single-subject research tends to yield large effect sizes (Ferron & Levin, 2014; Marquis et al., 2000; Rogers & Graham, 2008). Thus, we
conducted a second study to more carefully consider the relationship between effect size and replicability.
Study 2: Effect Size as a Predictor of Subsequent Replication
Study 1 revealed a high probability of initial AB effects replicating; however, initial effects failed to replicate in at least one subsequent component approximately 15% of the time. This suggests that a practitioner who attended only to initial AB data and conducted no
replication would reached erroneous conclusions for approximately 1 of 6 cases. Put in the simplest terms, our data from Study 1 suggest that in some cases it will remain profitable to conduct the replications that have been considered a hallmark of single-case research. Exactly when replication is, and is not, merited remains to be determined. In the present study, we explored whether the initial effect size might predict whether it would be necessary to conduct a replication.
Procedures
Many effect size measures are available for single-case designs and there is no consensus on which one is the best (Kratochwill et al., 2010; Parker, Vannest, & Davis, 2011). For the present study, we employed three effect size estimates that we believe are representative of the options available. The standardized mean difference (SMD), the percentage of points exceeding the median (PEM) and Tau-U (all described below) are calculated quite differently but have similarities to some of the other measures that we did not employ (Vannest & Ninci, 2015). On this basis, we assumed that our findings would not be idiosyncratic to any single effect size measure.
The SMD is a dimensionless measure of change in standard deviations, which is analogous to Cohen’s d for group designs (Cohen, 1992). SMD's utility in single-case research
are not well documented (Kratochwill et al., 2010); however, it has been used as part of Monte Carlo studies to examine the power and Type I error rate of statistical and visual analyses (e.g., Fisher et al., 2003; Levin, Ferron, & Kratochwill, 2012). Theoretically, SMD can take on any positive or negative value. Although there are no clear established guidelines for the
interpretation of SMD for single-case designs, researchers have suggested that most effective interventions produce effects sizes with absolute values larger than 3 (Levin et al., 2012; Rogers & Graham, 2008). We calculated SMD for each dataset by subtracting the mean of Phase A from the mean of Phase B and dividing the result by the standard deviation of Phase A.
The PEM is a simple measure that does not involve any complex computations, but rather involves counting the number of points for the treatment phase that fall above or below the median for the preceding phase, and then dividing the count by the total number of points in the target phase (Ma, 2006). The value of PEM can vary between 0 and 100%, but random
fluctuation alone should produce a value varying around 50%. Ma (2006) indicates that highly effective treatments produce a mean PEM value of 94%, moderately effective treatments a mean value of 76%, and ineffective treatments a mean value of 48%. We used the R statistical package to compute PEM automatically for our analyses (R code available from the first author). The main drawback of PEM is that it does not consider all points and is impervious to data trends.
Tau-U compares changes from one phase A to another while controlling for baseline trends (Vannest & Ninci, 2015). It produces a Tau-U value, which can subsequently be
transformed to a Z value and p score to determine whether the results are statistically significant. Tau-U has amongst the best properties as it considers all points in each phase, offers a correction for baseline trends, and allows for inferential statistics. The value of Tau-U generally varies between -1 and 1. Vannest and Ninci (2015) propose that small changes have absolute values of
.20 or less, moderate changes have absolute values of .20 to .60, and large changes have absolute values greater than .60. To compute Tau-U for each dataset, we used the R statistical package with code developed by Pustejovsky (2016).
To facilitate comparison across datasets, we used the absolute values of the effect sizes for our subsequent analyses (as the SMD and Tau-U could have negative values). Because SMD and Tau-U can produce both negative and positive values, we occasionally observed effect sizes in the opposite direction of the desired change, especially for datasets with no clear change. In these cases, using the absolute values would have biased our results as the value could be high even though its direction suggested that the treatment was ineffective. To address this issue, we assigned the value of 0 to the effect size when it was in the opposite direction of the desired change.
Analyses
To examine the predictive properties of effect size, we calculated the probability of failing to replicate the effects observed in the initial AB component (i.e., clear change or no clear change) given values above or lower certain effect size thresholds. The probability of failing to replicate the results is akin to the decision error rate produced by not conducting a replication. To set the thresholds, we considered a broad range of effect sizes that were generally representative of the values that we observed in our current datasets.
Results and Discussion
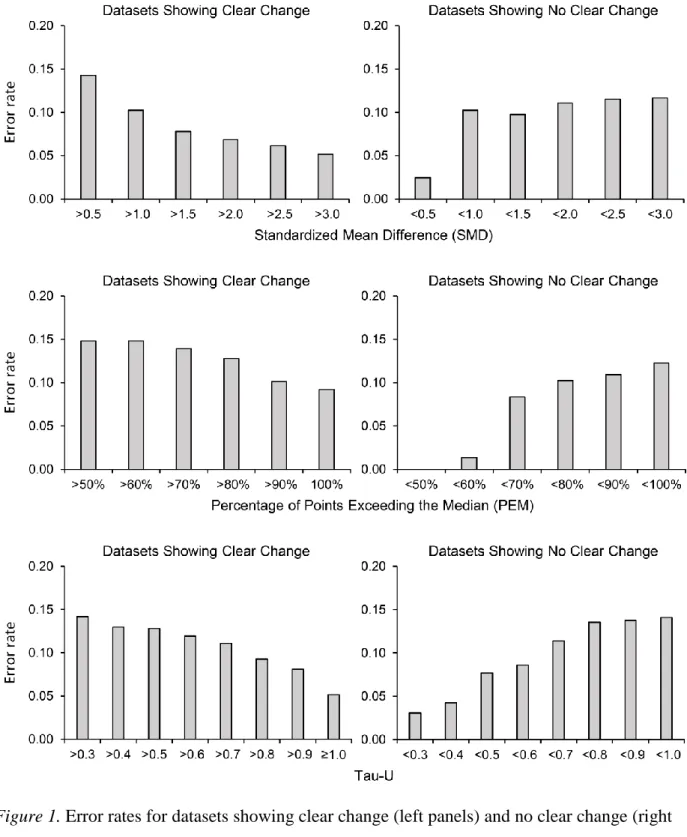
Figure 1 shows the proportion of datasets with values above or below specific thresholds of effect size for which there was a failure to replicate the initial observed effects (i.e., the error rate). For all measures of effect size, larger values produced lower error rates for datasets showing clear change whereas lower values produced lower error rates for datasets showing no
clear change. When comparing across measures, the SMD was associated with the lowest error rates for data showing change whereas PEM and Tau-U produced the lowest error rates for data showing no change. It should be noted that some effects may have failed to replicate despite the treatment having a true effect. If we set the power of our analyses at .86 (based on the results of Study 1), the probability of observing no replication due to a lack of power would be 0.02 (i.e., 0.142). The results of Study 2 support the rather provocative proposition that it may be possible
to set threshold values of effect size above which conducting a replication could be considered unnecessary (or at least optional). Inherent in this proposition is the assumption that as effect size in an initial AB component rises, decision errors that might be revealed in a subsequent
component become decreasingly rare.
General Discussion
Overall, our findings suggest that practitioners may not always need to conduct a
replication in practical settings, and that measures of effect size may provide a convenient aid to decisions to about when to conduct a return to baseline and replication of intervention. We emphasize, however, that at present there exists limited empirical guidance for such decisions. There is no reason to expect that a single relationship between effect size and replicability holds for all circumstances. In the present analyses, we pooled data from, and treated as
interchangeable, a wide variety of investigations that subsumed many different target behaviors, types of disorder, and settings. Such factors may well influence the probability of replication, and so additional research is needed in which these factors are treated as a covariate.
Practitioners should also bear in mind that the AB design does not allow the
demonstration of functional control. The main threat to internal validity when using AB designs is history (Christ, 2007). That is, the introduction of the independent variable may coincide with
other life events that produce behavior changes. Consequently, variables unrelated to treatment may inadvertently cause behavior changes, which may be erroneously explained as being the result of treatment. In our analyses, we assumed that changes produced by confounding variables during the initial phase change would not be replicated, but we did not consider confounds that may operate within phases or across subsequent phase changes. As such, the issue of
confounding variables remains unresolved and should be carefully considered in future research. From a practical standpoint, it is also important to discuss what would happen with the individuals for which the absence of replication would lead to an error: The practitioner may conclude that a treatment is effective when it is actually not, or the practitioner may conclude that a treatment is ineffective when it is actually effective. In the first case, continuing the implementation of an unnecessary treatment would waste time, effort and resources that might have been used to enhance well-being. In the second case, the practitioner risks stopping a treatment that would have been effective and subsequently implementing a more intrusive
alternative. The costs and side-effects would be highly dependent on the nature of this alternative treatment. Future research should conduct a cost-benefit analysis of such situations to address this issue more thoroughly. In sum, our empirical results indicate that AB designs are not as prone to error as one may assume using theoretical reasoning alone, but more research is essential to confirm and examine the generalizability of these results prior to recommending changes in practice.
References
Christ, T. J. (2007). Experimental control and threats to internal validity of concurrent and nonconcurrent multiple baseline designs. Psychology in the Schools, 44, 451-459. doi: 10.1002/pits.20237
Cohen, J. (1992). A power primer. Psychological Bulletin, 112, 155-159. doi: 10.1037/0033-2909.112.1.155
Ferron, J. M., & Levin, J. R. (2014). Single-case permutation and randomization statistical tests: Present status, promising new developments. In T. R. Kratochwill & J. R. Levin (Eds.), Single-case intervention research: Methodological and statistical advances (pp. 153-183). Washington, DC: American Psychological Association. doi: 10.1037/14376-006 Fisher, W. W., Kelley, M. E., & Lomas, J. E. (2003). Visual aids and structured criteria for
improving visual inspection and interpretation of single-case designs. Journal of Applied Behavior Analysis, 36, 387-406. doi:10.1901/jaba.2003.36-387
Horner, R. H., Carr, E. G., Halle, J., McGee, G., Odom, S., & Wolery, M. (2005). The use of single-subject research to identify evidence-based practice in special education. Exceptional Children, 71, 165-179. doi: 10.1177/001440290507100203
Johnston, J. M., Carr, J. E., & Mellichamp, F. H. (2017). A history of the professional credentialing of applied behavior analysts. The Behavior Analyst. Advanced online publication. doi: 10.1007/s40614-017-0106-9
Kazdin, A. E. (2011). Single-case research designs (2nd ed.). New York, NY: Oxford University Press.
Keohane, D. D., & Greer, R. D. (2005). Teachers’ use of a verbally governed algorithm and student learning. International Journal of Behavioral Consultation and Therapy, 1, 252-271. doi: 10.1037/h0100749.
Kratochwill, T. R., Hitchcock, J., Horner, R. H., Levin, J. R., Odom, S. L., Rindskopf, D. M., & Shadish, W. R. (2010). Single-case designs technical documentation. Retrieved from http://files.eric.ed.gov/fulltext/ED510743.pdf
Krueger, T. K., Rapp, J. T., Ott, L. M., Lood, E. A., & Novotny, M. A. (2013). Detecting false positives in A-B designs: Potential implications for practitioners. Behavior Modification, 37, 615-630. doi:10.1177/0145445512468754
Lanovaz, M. J., Huxley, S. C., & Dufour, M.-M. (2017). Using the dual-criteria methods to supplement visual inspection: An analysis of nonsimulated data. Journal of Applied Behavior Analysis, 50, 662-667. doi: 10.1002/jaba.394
Levin, J. R., Ferron, J. M., & Kratochwill, T. R. (2012). Nonparametric statistical tests for single-case systematic and randomized ABAB… AB and alternating treatment
intervention designs: New developments, new directions. Journal of School Psychology, 50, 599-624. doi: 10.1016/j.jsp.2012.05.001
Ma, H. H. (2006). An alternative method for quantitative synthesis of single-subject researches: Percentage of data points exceeding the median. Behavior Modification, 30, 598-617. doi: 10.1177/0145445504272974
Marquis, J. G., Horner, R. H., Carr, E. G., Turnbull, A. P., Thompson, M., Behrens, G. A., …, Doolabh, A. (2000). A meta-analysis of positive behavior support. In R. Gersten, E. P. Schiller, & S. Vaughn (Eds.), Contemporary special education research: Syntheses of knowledge base on critical instructional issues (pp. 137-178). Mahwah, NJ: Erlbaum.
Moeyaert, M., Maggin, D., & Verkuilen, J. (2016). Reliability, validity, and usability of data extraction programs for single-case research designs. Behavior Modification, 40, 874-900. doi: 10.1177/0145445516645763
Ninci, J., Vannest, K. J., Willson, V., & Zhang, N. (2015). Interrater agreement between visual analysts of single-case data: A meta-analysis. Behavior Modification, 39, 510-541. doi: 10.1177/0145445515581327.
Novotny, M. A., Sharp, K. J., Rapp, J. T., Jelinski, J. D., Lood, E. A., & Steffes, A. K. (2014). False positives with visual analysis for nonconcurrent multiple baseline designs and ABAB designs: Preliminary findings. Research in Autism Spectrum Disorders, 8, 933-943. doi: 10.1016/j.rasd.2014.04.009
Ombudsman Ontatrio. (2016). Nowehere to turn: Investigation into the Ministry of Community and Social Services’ response to situations of crisis involving adults with developmental disabilities. Retrieved from
https://www.ombudsman.on.ca/Files/sitemedia/Documents/NTT-Final-EN-w-cover.pdf Parker, R. I., Vannest, K. J., & Davis, J. L. (2011). Effect size in single-case research: A review
of nine nonoverlap techniques. Behavior Modification, 35, 303-322. doi: 10.1177/0145445511399147
Pustejovsky, J. E. (2016, November 3). What is Tau-U?. Retrieved from http://jepusto.github.io/What-is-Tau-U
Québec Obudsman. (2012). Services provided to young people and adults with a pervasive developmental disorder. Retrieved from
https://protecteurducitoyen.qc.ca/sites/default/files/pdf/rapports_speciaux/2012-05-23_rapport_ted_2_EN.pdf
Rohatgi, A. (2017). Plot Digitizer [computer software]. Retrieved from http://arohatgi.info/WebPlotDigitizer/app/
Rogers, L. A., & Graham, S. (2008). A meta-analysis of single subject design writing intervention research. Journal of Educational Psychology, 100, 879-906. doi: 10.1037/0022-0663.100.4.879
Shadish, W. R., & Sullivan, K. J. (2011). Characteristics of single-case designs used to assess intervention effects in 2008. Behavior Research Methods, 43, 971-980.
doi:10.3758/s13428-011-0111-y
Sham, E., & Smith, T. (2014). Publication bias in studies of an applied behavior‐analytic intervention: An initial analysis. Journal of Applied Behavior Analysis, 47, 663-678. doi:10.1002/jaba.146
Shook, G. L. (2005). An examination of the integrity and future of the Behavior Analyst Certification Board® credentials. Behavior Modification, 29, 562-574. doi: 10.1177/0145445504274203
Skinner B. F. (1991). The behavior of organisms: An experimental analysis. Acton, MA: Copley Publishing Group. (Original work published 1938)
Vannest, K. J., & Ninci, J. (2015), Evaluating intervention effects in single-case research designs. Journal of Counseling & Development, 93, 403-411. doi:10.1002/jcad.12038
Table 1
Percentage of datasets for which the effects observed in the initial AB component was successfully replicated at least once or twice
Successful Replications Number of
datasets At least one Two
All datasets 501 85.4% 64.3%
First AB showed clear change 280 85.0% 63.6%
Figure 1. Error rates for datasets showing clear change (left panels) and no clear change (right panels) for values lower or above specific thresholds for standardized mean difference (upper panels), percentage of points exceeding the median (middle panels), and Tau-U (lower panels).