HAL Id: hal-00933697
https://hal.archives-ouvertes.fr/hal-00933697
Submitted on 20 Jan 2014
HAL is a multi-disciplinary open access
archive for the deposit and dissemination of sci-entific research documents, whether they are pub-lished or not. The documents may come from
L’archive ouverte pluridisciplinaire HAL, est destinée au dépôt et à la diffusion de documents scientifiques de niveau recherche, publiés ou non, émanant des établissements d’enseignement et de
IMISketch: an interactive method for sketch recognition
Achraf Ghorbel, Eric Anquetil, Jean Camillerapp, Aurélie Lemaitre
To cite this version:
Achraf Ghorbel, Eric Anquetil, Jean Camillerapp, Aurélie Lemaitre. IMISketch: an interactive method for sketch recognition. Pattern Recognition Letters, Elsevier, 2014, 35 (78-90), pp.13. �hal-00933697�
IMISketch: an interactive method for sketch
1recognition
2Achraf Ghorbela, Eric Anquetila, Jean Camillerappa, Aurélie Lemaitreb
3
aINSA de Rennes, UMR IRISA, Campus de Beaulieu, F-35042 Rennes
4
Université Européenne de Bretagne, France
5
bUMR IRISA, Campus de Beaulieu, F-35042 Rennes
6
Université de Rennes 2, France
7
Abstract
8
In this paper, we present a new generic method for an interactive
interpreta-9
tion of sketches to avoid a fastidious verification phase. After a
preprocess-10
ing phase in which we extract a set of primitives, the interpretation process
11
consists of an interactive analysis. The analyzer is based on a competitive
12
breadth-first exploration of the analysis tree. As opposed to well known
13
structural approaches, this method allows to evaluate simultaneously several
14
possible hypotheses of recognition in a dynamic local context of document.
15
The decision process is able to solicit the user in the case of strong ambiguity:
16
when it is not sure to make the right decision. The user explicitly validates
17
the right decision. While, in practice these approaches often induce a large
18
combinatory, this paper presents optimization strategies to reduce the
com-19
binatory. The goal of these optimizations is to have time analysis compatible
20
with user expectations. These strategies have been integrated into both
pre-21
processing and analysis phases. To validate this interactive analysis method,
22
several experiments are reported in this paper on off-line handwritten 2D
23
architectural floor plans.
24
Email addresses: [email protected] (Achraf Ghorbel),
Keywords: sketch recognition, breadth-first exploration, interactive
25
recognition, 2D architectural floor plans, Kalman filter
26
1. Introduction
27
Nowadays, digital documents are becoming more and more omnipresent in
28
our life. Many reasons, such as the flexibility provided by digital processing,
29
have led to transform handwritten documents to digital ones. In this context,
30
people are working on mapping technical paper documents, like architectural
31
floor plans, to digital ones. We aim at offering a complete and homogeneous
32
solution to unify paper document recognition and pen-based composition (for
33
instance: with Tablet PC). We present the IMISktech system : Interactive
34
Method for Interpretation of Sketches. The input of this system is a scanned
35
image of handwritten architectural plan and after interpretation the output
36
is its digital version. This method is the result of four years of research
37
that leads to several scientific publication [14, 16, 17, 15]. This paper is a
38
synthesis of this method. We focus on the extraction of primitives that feed
39
the analyzer to optimize the management of combinatory.
40
We have identified two major approaches for document analysis: syntactic
41
and statistical approaches. Choosing one of these two approaches depends
42
on the document type.
43
The syntactic approaches [6, 8, 29, 12, 21, 22] lean on prior knowledge
44
of the document structure to drive the analysis. They are often based on
45
visual languages for describing this knowledge and generating the analyzer.
46
However, syntactic methods have difficulties to incorporate the uncertainty.
47
The statistical approaches [25, 30, 32] provide a better ability to
porate uncertainty and usually lack the ability to convey the hierarchical
49
structure of the document. The use of statistical approaches needs a wide
50
learning on a homogeneous and labeled base. Each type of approach has
51
advantages and drawbacks. The interpretation of handwritten structured
52
documents needs on the one hand an approach that retains its structure, ie
53
a syntactic approach, and on the other hand an approach that provides a
54
better ability to incorporate uncertainty, ie a statistical approach.
55
In this work, we design a complete system for the sketch interpretation:
56
IMISketch1. One of the main originalities of IMISketch is to avoid an a
pos-57
teriori verification phase by soliciting the user. After a preprocessing phase
58
in which primitives of the structured document are extracted, the system
59
is characterized by an interactive analysis phase. The analyzer (referred as
60
IMISketch) uses a new syntactic approach based on an interactive and lazy
61
interpretation of the document. Unlike the classical syntactic approaches,
62
IMISketch does not always select the first or the best found hypothesis. The
63
associated analysis process is able to take into account the uncertainty.
64
Thanks to the interactivity, the user can be solicited, if needed, by the
65
analyzer to raise ambiguities of recognition [17] i.e. to choose between two
66
or more possible hypotheses or to enrich the a priori knowledge of the
sys-67
tem [14]. In fact, the user participation has a great impact to avoid error
68
accumulation during the analysis step. To detect ambiguities, we should
69
adopt a method based on breadth-first exploration. Like all the analysis
70
methods based in breadth-first exploration, this approach can induce a large
71
combinatorics. This combinatorics mainly depends on the quality of
prim-72
itives extracted from the image and the manner to analyze them. In this
73
paper we propose some optimizations to reduce it, by addressing these two
74
points. These optimizations are introduced from the phase of segmentation
75
to the analysis. They will lead to the new system IMISketch+.
76
The complete system can be applied to off-line documents (image), as
77
illustrated in this paper (Figure 9(a)), as well as on-line or vectored
docu-78
ments.
79
In the state of the art, one interesting generic approach is the
LAD-80
DER [19] [18] system which has been proposed by Hammond and Davis
81
for interpreting a posteriori or on the fly on-line handwritten documents.
82
LADDER language has been exploited for the design of various systems of
83
interpretation of structured documents, such as UML [18], electrical
dia-84
grams [2] or complex graphs [20]. Also Plimmer proposed InkKit that is a
85
framework and a toolkit to recognize complex components [31] [13]. In
addi-86
tion VR Sketchpad [27] is a pen-based computing environment for inputting
87
and locating 3D objects in a virtual world.
88
Unlike these methods, our method interprets off-line handwritten
struc-89
tured documents. It has been tested on 2D architectural floor plans. The
90
specific task of floor plan analysis has been addressed for more than twenty
91
years. Lladós [26] proposed a method for understanding hand drawn floor
92
plans using subgraph isomorphism and Hough transform. Aoki [3] proposed
93
also a method for interpreting a hand-sketched floor plan. This method
fo-94
cuses on understanding the hand sketched floor plan and converting it into
95
a CAD representation. Also, Ahmed [33] proposed an analysis method
ified in printed architectural floor plans.
97
Contrary to these methods that can require a fastidious a posteriori
veri-98
fication phase, IMISketch system attempts to avoid this phase by integrating
99
the user during the analysis process.
100
The recognition of a structured document using a structural approach
101
needs an a priori description. The modeling of structured documents differs
102
from one type to another. Several techniques allow the document
descrip-103
tion. Yamamoto [35] and Bunke [5] use classical one-dimensional grammars.
104
Other techniques are used to model two-dimensional documents. Fahmy [11]
105
and Bunke [4] offer grammar graphs. These grammars have been widely used
106
in the various communities for interpreting off-line documents such as
math-107
ematical formulas. Despite graph grammars offer a very expressive
mecha-108
nism for pattern recognition, these grammars have their limitations. They
109
are expensive to implement and difficult to handle by the developer,
espe-110
cially when the productions become numerous. These graphs are also poorly
111
adapted to deal with uncertainty.
112
Our goal is to analyze documents of different kinds such as handwritten
113
documents. To overcome this problem, we adopt context-driven constraint
114
multi-set grammars (CD-CMG), designed for on-line recognition [28]
asso-115
ciated with a scoring approach based on the fuzzy logic theory. The main
116
contribution of our work is to modify and to extend this formalism to design
117
an interactive analyser for off-line recognition. This strategy allows to solicit
118
the user in the case of strong ambiguity and avoids the fastidious a posteriori
119
verification task to find and correct the remaining interpretation errors.
120
The remaining of the paper is organized as follows. In the section 3(a),
we introduce the architecture and the basic principles of IMISketch method.
122
The phase of primitive extraction is described in section 3. Section 4 presents
123
the concepts that are linked with an interactive breadth-first analysis. In
sec-124
tion 5 implementation and optimization of IMISketch analyzer are presented.
125
Experimental results on interpretation of images of 2D handwritten
architec-126
tural floor plans are reported in section 6 and finally, section 7 concludes the
127
paper.
128
2. Interactive analysis stages
129
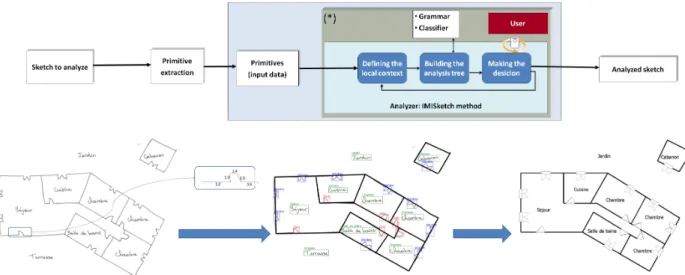
In this section, we summarize the different steps of treatment to ensure the
130
recognition of a handwritten structured document (cf. Figure 1). The first
131
step is the segmentation process. This step is purely off-line (i.e. without user
132
interaction). The aim of this phase is to extract all the basic primitives that
133
will be used to analyze the document. In the context of sketch recognition,
134
the segmentation process consists in extracting handwritten strokes as a set
135
of segments. This part is detailed in section 3. The second main step is to
136
analyze these primitives and to compose them according to their structural
137
arrangement in the document to identify the symbols. Our analyzer is made
138
of two associated key processes: the recognition of the document structure
139
is managed by the grammatical analyzer that drives the calls of symbol
140
classifiers to evaluate a fuzzy scoring for each hypotheses. For instance, in
141
architectural plans, structural recognition detects walls, opening, etc., and
142
the fuzzy classifiers identify the opening to window, door, etc.
143
The user can be solicited during the analysis process in case of ambiguity
144
detection. This approach is generic and needs some a priori knowledge at
the structural level by defining a grammar that will describe the document
146
structure and at the classifier level to identify the symbols. This knowledge
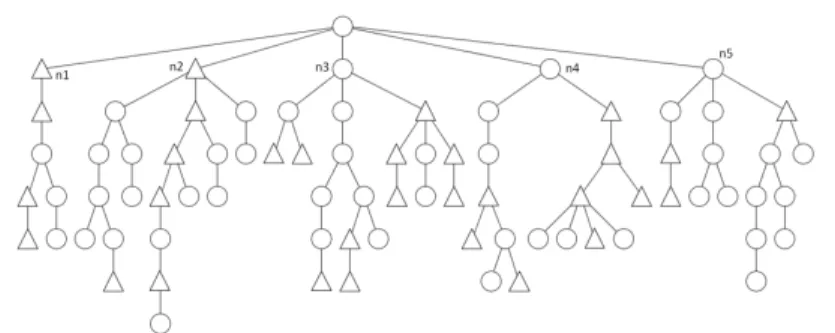
147
corresponds to the specific part of the analysis system.
148
We detail in the following sections the preprocessing (section 3) and the
149
analysis phases (section 4).
150
Figure 1: Synthetic scheme for structured documents interpretation
3. Preprocessing phase: primitive extraction
151
3.1. Related works
152
The recognition of architectural plans has already been studied in
par-153
ticular by Dosch et al [10]. In this kind of plans, segments, representing the
154
walls, are primitives widely used. In these works, most of the analyzed plans
155
have been drawn with a ruler (or CAD software), consequently, segments are
156
really straight. In [23], Hilaire proposed a method that improves the method
of Dosch. The originality of his work comes from the segmentation process
158
of the skeleton. This aspect is very important in the context in which
draw-159
ings are crossing. His paper contains an important bibliography. Hilaire, as
160
Dosch, works on printed documents, but our aim is to process handwritten
161
documents. In such documents, walls are not straight lines and the
repre-162
sentation of doors and windows use arcs of a circle which are sometimes very
163
roughly drawn.
164
In [7], Chang proposes to carry out the vectorization of handwritten
doc-165
uments by Bezier curves. This approach has been designed for the
vector-166
ization of cartoons, but it does not lead to an easy representation to be used
167
for a later interpretation of symbols like pieces, doors, windows, etc.
168
In [9] de Brucq uses a Kalman filter to decompose handwritten strokes
169
into straight lines and arcs of circle. These primitives are well adapted for
170
architectural plan interpretations, but the system works with an on-line
rep-171
resentation of the drawing.
172
3.2. Our method
173
To extract lines in off-line sketch documents, we propose to adapt the
174
method we presented in [24]. It uses a Kalman filter.
175
A Kalman filter is a prediction verification process that provides an
es-176
timate of a model from observations. In the case of the drawing extraction,
177
our model is based on three values: the thickness, the position and the local
178
slope of the line. When the drawing is relatively regular, the Kalman filter
179
can use these three values to predict the next position and update the model
180
from the pixels of the image. In areas that include intersections, the observed
181
thickness is not consistent with the predicted thickness, but it is possible to
use the prediction ability of the filter to pass through these regions. In a
183
region where the direction of the line changes rapidly, it is not possible to
184
find black pixels in the predicted position and the follow-up of the drawing
185
stops. Equations and more details can be found in [24].
186
For sketch documents the most important parameter for the Kalman filter
187
is the one that defines the variability of the slope. With a large value (0.1, i.e.
188
a 10% variation of the slope) a curved section of drawing is detected as a single
189
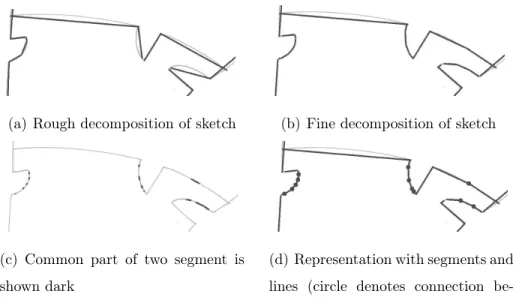
segment joining its two ends (Figure 2(a)). With a very low value (0.005)
190
the model allows a very little variation of the slope, and thus many small
191
segments are detected in the same curved section (Figure 2(b)). We note, in
192
this example, that the symbols representing opening (door or window) are
193
more precisely represented in Figure 2(b) (precise decomposition) than in
194
Figure 2(a) (rough decomposition). A precise decomposition increases the
195
number of segments extracted from the image, however this decomposition
196
can be very useful when using a classifier to recognize symbols.
197
To fix ideas, the full plan from which is extracted the Figure 2 is
repre-198
sented by 144 segments for the rough decomposition and 177 segments for the
199
precise one. This increase of the number of segments is mostly due to small
200
segments in the opening regions. We must notice that a little region with
201
many small segments will produce a combinatorics explosion of the analyze
202
time. This effect is pointed out later in the section 6 and Figure 9(c).
203
To overcome this dilemma, i.e. a precise representation but a low
com-204
binatorics, we propose to extract only a precise decomposition and to build
205
spatial relationships between the segments. Thus, it is important to
re-206
member if a segment is a curvilinear extension of another one. During the
(a) Rough decomposition of sketch (b) Fine decomposition of sketch
(c) Common part of two segment is shown dark
(d) Representation with segments and lines (circle denotes connection be-tween consecutive segments)
Figure 2: Extraction of primitives: Original drawing in light gray, primitives shown in dark black
detection of segments by the Kalman filter, it is possible to detect that a
208
part of the drawing belongs to two different segments (Figure 2(c)). In this
209
case, we remove this common part from one of the two segments and
mem-210
orize that their is a curvilinear link between the extremities of these two
211
segments. The small circles in Figure 2(d) represent a connection between
212
two segments. Each set of segments attached to one another corresponds to
213
a polygonal approximation of the curved parts of the drawing (for instance
214
an opening).
215
Thus, there are two types of primitives extracted from an image:
sim-216
ple segments and polygons. We transmit the connection information so that
217
the interpretation process can directly use simple segments and polygons as
218
primitive, or can decide to split a polygon into segments according to some
219
structural information like the size of the polygon or criterion of collinearity.
220
The use of this dual representation on one hand allows a more precise
char-221
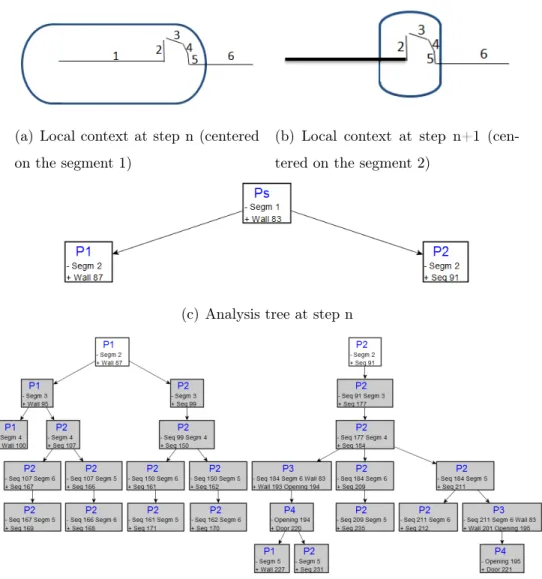
acterization of curve sections and on the other hand limits the combinatorics
222
during the interpretation process.
223
4. Interactive breadth-first exploration
224
In this section, we present the analyzer by first describing its main
char-225
acteristics. Then, we detail the different steps of the internal analysis. The
226
description of this method is followed by a concrete example in the next
227
section (section 5).
228
4.1. Analyzer characteristics
229
The interpretation strategy of structured documents is driven by the a
230
priori knowledge we have on the structural rules of the application domain.
These structural information are formalised by a visual language from which
232
we can automatically develop a breadth-first interactive analyser. For
hand-233
written architectural plans, the interpretation of a primitive takes into
ac-234
count the neighbouring objects. Moreover, as we work in a two-dimensional
235
context (images), it can induce a large combinatorics. To overcome this
com-236
plexity problem, we propose to guide our breadth-first exploration using a
237
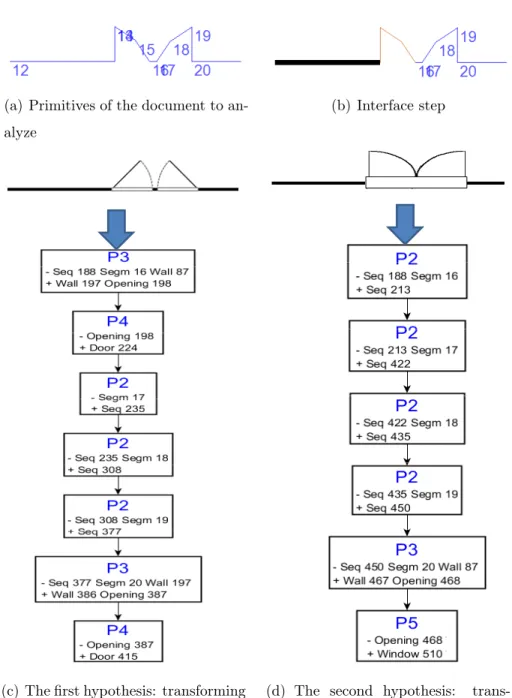
spatial contextual focus.
238
This idea is close to the well known LL(k) analysis, where reading the next
239
k tokens enables to choose without ambiguities which rule must be applied.
240
In the same manner, in our two-dimensional analysis, we have to limit the
241
number of token k to explore, i.e. the depth of the analysis. Consequently,
242
contrary to the LL(k) analysis, the exploration of the following tokens does
243
not allow to take a unique decision on the rule to apply, because we
volun-244
tarily limit the value of k. Moreover, sometimes, the grammar is not LL(k)
245
for any k and the analyser meets ambiguities. In those two cases, the process
246
can not be sure to take itself the decision, and may hesitate between several
247
hypotheses. In order to validate the right decision, we propose an analysis
248
process that can, through its decision process, take the right decision or
so-249
licit the user in case of ambiguities. This analyzer is based on the following
250
characteristics:
251
• the expression of a priori structural knowledge of the document through
252
a visual language based on production rules;
253
• a two-dimensional descending breadth first analysis;
254
• a spatial contextual focus of the exploration to limit the combinatorics;
• the formalization of uncertainty by the attribution of scores to each
256
hypothesis, represented by a tree analysis branch;
257
• some user solicitaions: if the ambiguities can not be resolved in the
258
local context in an automatic manner, the user will be solicited by the
259
analyzer to resolve the ambiguity.
260
These characteristics have been defined to ensure a good interaction between
261
the process of analysis and the user. This interactivity allows in particular
262
to avoid an a posteriori verification phase, which can become fastidious on
263
complex documents. Indeed, the user participation, on the critical phases of
264
the analysis of the document, has a great impact to avoid error accumulation
265
during the analysis step and overcomes the combinatorics due to the sketch
266
complexity.
267
4.2. Steps of the analysis
268
The analyzer tries to match the set of primitives contained in the
doc-269
ument with the structure model defined by the two-dimensional production
270
rules. The interactive breadth-first analysis process consists of three stages:
271
1) defining the local context, 2) building the analysis tree and 3) making the
272
decision. The inner part(*) of Figure 1 illustrates these three phases and the
273
relationships between them.
274
4.2.1. Defining the local context
275
The recognition of a given primitive depends on its neighbourhood in
276
structured documents. The analyzer begins by defining a spatial contextual
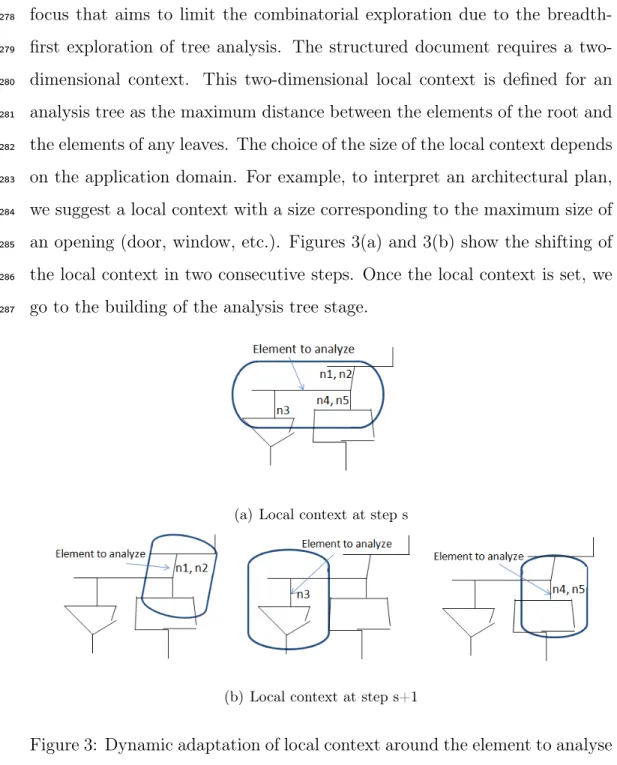
focus that aims to limit the combinatorial exploration due to the
breadth-278
first exploration of tree analysis. The structured document requires a
two-279
dimensional context. This two-dimensional local context is defined for an
280
analysis tree as the maximum distance between the elements of the root and
281
the elements of any leaves. The choice of the size of the local context depends
282
on the application domain. For example, to interpret an architectural plan,
283
we suggest a local context with a size corresponding to the maximum size of
284
an opening (door, window, etc.). Figures 3(a) and 3(b) show the shifting of
285
the local context in two consecutive steps. Once the local context is set, we
286
go to the building of the analysis tree stage.
287
(a) Local context at step s
(b) Local context at step s+1
4.2.2. Building the analysis trees
288
In this stage, the analyzer explores all the possible hypotheses of
inter-289
pretation in the spatial context using a set of two-dimensional rules that
290
describe the structure of the document. Each primitive can be interpreted
291
in several ways. Each node or leaf is the application of a production rule
292
deduced from the previous node. Every leaf or node of the tree has a score
293
calculated from both its local score and the score obtained from the preceding
294
nodes. Every score determines the adequacy degree to validate a production.
295
It is calculated from each rule. The production score can also be deduced
296
from a classifier. Each branch (hypothesis) is characterized by a score.
297
The breadth-first exploration using a local context of the IMISketch
298
method is illustrated in Figures 4(a) and 4(b). This exploration generates
299
some combinatorics. Consequently, we describe in section 4.2.2.a a new
al-300
gorithm for constructing analysis trees for reducing the combinatorics.
301
4.2.2.a. Our new IMISketch+ method of tree construction
302
Each analysis tree characterizes the elements to interpret in the defined local
303
context. Each root is the production rule that would consume this primitive.
304
The number of analysis trees corresponds to the number of possible
inter-305
pretations for the current primitive. The analysis tree then contains a set of
306
complete or incomplete objects. An object is called complete if and only if
307
this object can be found in the final result of the document interpretation.
308
For example, in the case of the architectural plans, the complete objects can
309
be walls, doors, windows... An incomplete object is an object that is not
310
complete, but rather a part of complete object, i.e, we do not find it in the
(a) IMISketch method at step s
(b) IMISketch method at step s+1
(c) IMISketch+ at step s. The direct son of the root are grouped by consumed elements
(d) IMISketch+ at step s+1. Only the roots (n1, n2), belonging to the same group (Group 1) are developed
Figure 4: IMISketch Vs IMISketch+: transition between two successive anal-ysis trees. Nodes modeled by circles refer to complete object. Nodes modeled
final result of the interpretation. These objects can lead to complete objects
312
(furniture, openings).
313
Despite the use of a local context, the problem of combinatory and
there-314
fore computing time, is an important problem that must be addressed to meet
315
the criteria of acceptability and usability of this type of interactive
analy-316
sis with a user. The combinatory is mainly due to the number of applied
317
production rules in the local context.
318
In fact, the development of certain nodes in tree analysis is useless. That
319
is why, we present a new approach to build the tree analysis in order to only
320
develop the useful nodes for making the right decision [16]. This algorithm
321
is described below:
322
• If the number of analysis tree roots is equal to 1: (Figure 4(c))
323
1. limit the development of direct sons of the root. If the root to
de-324
velop is unique, we can say that only one interpretation is possible
325
for the consumed element. The decision process is then sure to
326
validate the right root. In this case, since we know the root to be
327
validated, we consider unnecessary to build all the tree analysis,
328
and we can limit the tree development to the direct sons. After
329
validation of this root, these direct sons will be the new roots to
330
build.
331
• If the number of analysis tree roots is greater than 1: (Figure 4(d))
332
1. regroup the roots by consumed elements. We will not build all
333
roots but only those that share the same elements. We want
to find the right interpretation in order to consume the element
335
within the root.
336
2. order these groups by their scores. Each group has a score
de-337
rived from the roots within it. This score is the score of the best
338
hypothesis (branch) located in the group.
339
3. develop only roots belonging to the group having the best score.
340
4. build analysis tree as long as the following conditions are verified:
341
– the newly consumed element is in the local context of research;
342
– the number of consumed elements in each hypothesis (branch)
343
is below a threshold. In the architectural plans, we note that
344
the number of primitive of an opening can not exceed 10
prim-345
itives. For this we fix this threshold to 10.
346
– the number of complete elements belonging to a branch is less
347
than a second threshold. We can fix a threshold to 3 for the
348
architectural plans.
349
Figures 4(d) and 4(c) illustrate an example of building the analysis trees
350
with our new method (IMISketch+). The local context is not only limited to
351
the distance between primitives but also to the number of complete elements
352
in hypothesis. This optimization can generate a lack of information on
hy-353
potheses and therefore a possible ambiguity. But thanks to the interactivity,
354
this insufficiency does not influence on the final result as far as the user may
355
be solicited to validate the right hypothesis.
4.2.2.b. IMISketch+ Vs IMISketch
357
The aim of this section is to show the improvements deduced from the new
358
algorithm (IMISketch+) for building analysis trees compared to the classic
359
exploration method IMISketch (in which all possible branches are explored).
360
To facilitate this comparison, we present an example of an artificial tree
361
analysis. The goal is to compare, for each step, the number of developed
362
nodes according to the placement of the local context depending on the
363
elements to be analyzed. The transition of an analysis tree to the next
364
analysis tree involves a shift of the local context. This movement allows
365
applying the other productions. In fact, the building of the new analysis
366
trees is not the rebuilding of the whole branches but only the new found
367
productions by shifting the context.
368
Figure 4(a) shows the result of the exploration according to the IMISketch
369
method. The number of interpretation (nodes) is equal to 80 interpretations.
370
The tree construction based on the IMISketch+ algorithm generates only 6
371
interpretations (Figure 4(c)). Figures 4(b) et 4(d) illustrate the new analysis
372
trees by moving the local context. After two successive construction steps
373
of analysis trees, we went from 111 interpretations (IMISketch method) to
374
28 interpretations (IMISketch+), this corresponds to a gain of about 75% of
375
computation time. These optimizations are generic and do not depend on
376
the category of structured document to analyze.
377
4.2.3. Making the decision
378
Once the tree is well constructed, we start the decision phase. The role
379
of the decision process is to validate the right hypothesis among a set of
competing hypotheses generated with a descending breadth first analysis.
381
Two cases are presented (section 4.2.2): case of a single root and case of
382
several roots.
383
• Case of a single root: this root is validated.
384
• Case of several roots: the hypothesis (branch) having the highest leaf
385
score in each tree is considered. These branches are sorted by the score
386
of each leaf. Then we compare the obtained branches. Two cases may
387
appear:
388
– Implicit validation: when the analyzer is confident enough to
389
choose the correct root without requesting the user. The
ana-390
lyzer implicitly validates the root which has the branch having
391
the highest score.
392
– Explicit validation: when the decision process requires the user to
393
validate the right decision. In practice, if the difference between
394
the branch with the highest score and another branch is below a
395
threshold, called threshold of confidence and these two branches
396
are contradictory (at least one joint primitive is not consumed by
397
the same rule production), the user intervention is required.
398
The decision is not limited only to validate the correct root but can also
vali-399
date directly a part of the branch (hypothesis), for accelerating the analysis.
400
In general, if the direct son of a node is unique, the validation of this node
401
generates automatically the validation of its direct son. The decision making
402
is summarize in Algorithm 1.
Function Making the decision( right hypothesis : list of nodes) : list of nodes
validated-nodes : list of nodes;
validated-nodes.add(root of the right hypothesis) ; successor ← validated-nodes.lastElement.successor; While (Number of successor == 1) do
validated-nodes.add(validated-nodes.lastElement); successor ← validated-nodes.lastElement.successor done
return validated-nodes; End
Algorithm 1: Decision algorithm
When the correct root is validated, other roots are put on hold and the
404
new roots are either the sons of this root if exists, or the waiting roots
405
otherwise and the analyzer goes back to the first step (defining the local
406
context step). The analysis is complete when no more production rule is
407
applicable.
408
5. Implementation of IMISketch
409
In this section, we describe the implementation of our interactive analysis
410
method (IMISketch) and illustrate it on 2D handwritten architectural plans.
5.1. Use of CD-CMG
412
Given that architectural plans are two-dimensional structured documents,
413
for modeling our interactive analyzer, we adopt the two-dimensional
gram-414
mars. We use the context-driven constraint multiset grammars (CD-CMG)
415
(detailed in [28]). The analysis process is driven by the context that involves
416
a significant decrease in the complexity of the analysis process. The score
417
calculated by each production (node) is due to preconditions and constraints
418
of the rule production [28]. Equation 1 defines the manner that we calculate
419
the score for each production. The use of the square root is a normalization
420
using a geometric average.
421
ρP =√µpreconditions.µconstraints (1)
Deducing µpreconditions: the computing of µpreconditions is simply the fuzzy
422
application of the precondition block. Each DSC 2 is evaluated and the
423
corresponding membership degrees are merged: a fuzzy conjunction (t-norm)
424
is used for an ’&’, whereas a fuzzy disjunction (t-conorm) is used for an ’|’.
425
Once again, the resulting degree is normalized to avoid giving an advantage
426
to productions with less DSC.
427
Deducing µconstraints: the computing of µconstraints is based on the same
428
principle than the computing of µpreconditions. It means that each constraint
429
(structural or statistical) must return a membership degree. In practice,
430
defining fuzzy structural constraints is often straightforward and recognition
431
systems we use are based on fuzzy inference systems from which we obtain
432
2DSC is a specific constraint modeling both a location in the document and elements that are awaited in it.
such degrees [34].
433
Equation 2 determines the degree of adequacy (score) of a hypothesis.
434
|PS| is the number of production in the considered branch (referred PS). ρPi 435 is calculated by Equation 1. 436 ρP S = ( Y Pi∈P S ρPi) 1 |P S| (2)
A production rule can call an external classifier to recognize the symbols.
437
In our application context, the classifier is used for the recognition of the
438
types of opening (eg door, window, etc.). Each recognition is associated to a
439
score. This classification system is based on first-order Takagi-Sugeno (TS)
440
fuzzy inference system [1].
441
5.2. Impact of the primitives
442
To demonstrate the interest of using the polygons (cf. section 3) to reduce
443
the combinatorics, we compare a first set of production rules for interpreting
444
primitives composed only with segments (Table 1(Ps-P5)) and a second set
445
of rules dealing with two kinds of primitives : the segments and polygons.
446
This second set consists of the same rules enriched by three new rules that
447
allow to analyze polygons (Table 1(P6-P8)).
448
By applying the production rules described in Table 1 to a set of segments
449
extracted from an architectural plan (Figure 5(a)), we obtain the analysis
450
tree illustrated in Figure 5(c). In the next step, the local context is shifted
451
(Figure 5(b)). We then obtain tree analysis described in Figure 5(d). Despite
452
this example is quite simple, these two analysis trees contain 28 nodes.
453
Now, we integrate the new polygon primitive. We add production rules
454
illustrated in Table 1(P6-P8). To interpret the segment 1, the analyzer
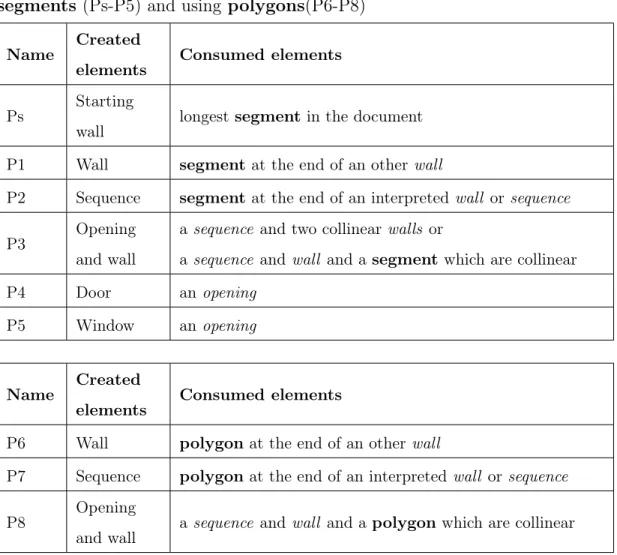
Table 1: Example of production rules used for the architectural plans using segments (Ps-P5) and using polygons(P6-P8)
Name Created elements Consumed elements Ps Starting wall
longest segment in the document
P1 Wall segment at the end of an other wall
P2 Sequence segment at the end of an interpreted wall or sequence
P3
Opening and wall
a sequence and two collinear walls or
a sequence and wall and a segment which are collinear
P4 Door an opening P5 Window an opening Name Created elements Consumed elements
P6 Wall polygon at the end of an other wall
P7 Sequence polygon at the end of an interpreted wall or sequence
P8
Opening and wall
(a) Local context at step n (centered on the segment 1)
(b) Local context at step n+1 (cen-tered on the segment 2)
(c) Analysis tree at step n
(d) Analysis tree at step n+1. The grayed leaves indicate the new applied production rules after shifting the local context.
Figure 5: Position of the local context (box) during the analysis and the associated analysis trees. The primitives only consist of segments.
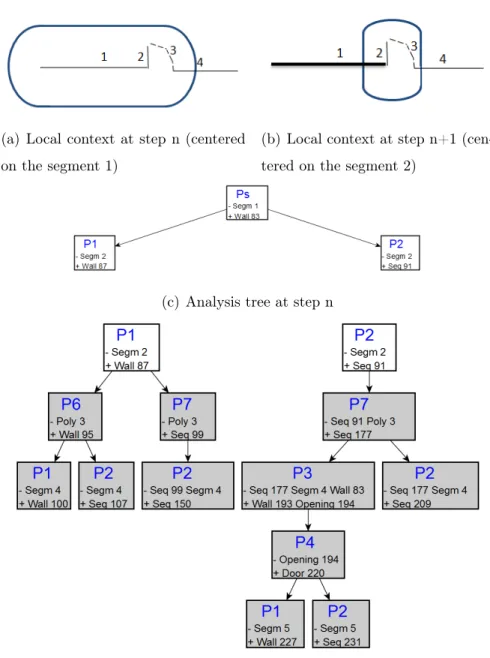
termines the local context (Figure 6(a)) and builds the tree analysis shown
456
in Figure 6(c). In the next step, the segment 2 will be interpreted, the local
457
context associated with this segment is illustrated in Figure 6(b) and the
458
new tree analysis is described in Figure 6(d). Thanks to the chaining of
seg-459
ments in polygons, we can reduce the combinatorics to 50%. We went from
460
28 nodes to 14 nodes.
461
We have shown in this section, the impact of using the chaining of
seg-462
ments on building of the analysis tree. This improvement induces
optimiza-463
tions in the decision process. Moreover, using polygons increases the chances
464
to validate a set of nodes. (cf. section 4.2.3).
465
The use of polygons as a primitive not only reduces the combinatorics
466
for structural recognition but also guarantees a better shape recognition for
467
obtained symbols through a more accurate representation of its constituents.
468
Indeed, once the symbol is well recognized structurally, all the segments
469
forming the symbol (the segments that are primitive and chained segments
470
forming the polygon) will be forwarded to the classifier to label the symbol.
471
Indeed, once the symbol is well structurally recognized, all the segments of
472
symbol (the segments that are primitive and chained segments forming the
473
polygon) will be transmitted to the classifier to label this symbol.
474
Once the tree analysis is explored, the analyzer starts the final phase: the
475
decision making. In this phase, illustrated in the next section, the user may
476
be solicited for removing ambiguities.
477
5.3. Ambiguity cases
478
In this section, we show an example of ambiguity which requires a user
479
solicitation. The aim is to analyze the set of primitives extracted from an
(a) Local context at step n (centered on the segment 1)
(b) Local context at step n+1 (cen-tered on the segment 2)
(c) Analysis tree at step n
(d) Analysis tree at step n+1. The grayed leaves indicate the new applied production rules after shifting the local context.
Figure 6: Position of the local context (box) during the analysis and the associated analysis trees. The primitives consist of segments and polygons. The dotted line (primitive 3) means the polygon.
architectural plan (Figure 7(a)). At the step illustrated in Figure 7(b), the
481
decision process decides to report the decision on the user because the two
482
branches in competition are contradictory and the difference between the
483
two scores is lower than the threshold of confidence. The decision process
484
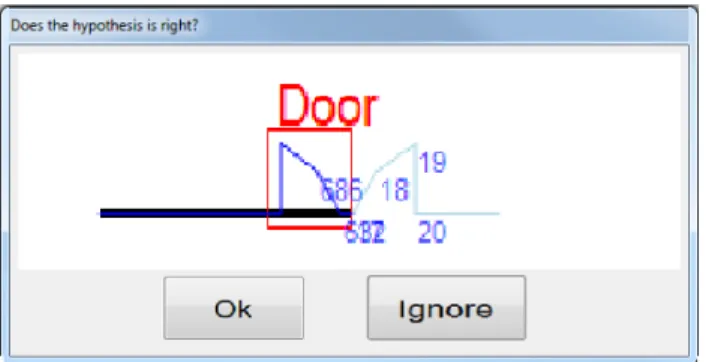
launches an interaction with the user (Figure 8), and proposes to validate the
485
first hypothesis. If the user validates this hypothesis, the document will be
486
recognized as two doors (Figure 7(c)). If the user declines the first hypothesis,
487
the system implicitly validates the second hypothesis (Figure 7(d)) and the
488
interpreted document will be made of one window. We note that the interface
489
is basic for the first version; we have not focused on the HCI design but on
490
the fact to interact with user. We focus on "when" the interpretation process
491
solicits the user. "How" to interact will be the subject of our future work.
492
6. Experimental results
493
In this section we report different results obtained with the complete
494
interactive recognition system. The results are focused on the impact of the
495
presented optimizations : the use of the polygon primitive and the building
496
strategy of tree analysis in terms of recognition rate and of computing time.
497
For this reason, we propose three versions of IMISketch (Figure 10). The first
498
one (referred as IMISketch) explores all the hypotheses (branches) of the tree
499
analysis in a local context with a set of primitives that contains only segments
500
(without polygons). The second version (referred as IMISketch+(Seg)) takes
501
into account the new algorithm to build the analysis tree keeping the same
502
set of primitives (only segments) as in the first version. The last version
503
(referred as IMISketch+(Seg&poly)) incorporates the both optimizations:
(a) Primitives of the document to an-alyze
(b) Interface step
(c) The first hypothesis: transforming a set of primitives into a wall and two doors
(d) The second hypothesis: trans-forming a set of primitives into a wall and a window
Figure 8: User interface: the analyzer proposes a user to validate the hy-pothesis described in Figure 7(c). If the user don’t validate this hyhy-pothesis, the analyzer will validate the hypothesis implicitly described in Figure 7(d)
the use of the polygon primitive and the new algorithm to build the analysis
505
tree (Figure 10).
506
The experiments were carried on 69 handwritten architectural plans of
507
varying complexity drawn by around ten different people. Each
architec-508
tural plan is composed of a set of walls, doors, windows and sliding
win-509
dows. The databases contains 2641 walls, 555 doors, 377 windows and 401
510
sliding windows. Some examples of architectural plans are illustrated in
Fig-511
ure 9(a). For each architectural plan, we compare, for the three versions
512
(IMISketch, IMISketch+(Seg), IMISketch+(Seg&poly)), the final
interpre-513
tation result and the obtained computing time (Figure 9).
514
Concerning the recognition rates (cf. Figure 9(b)), we note that the
515
optimizations performed to IMISketch do not affect system performance.
In-516
deed, we observe a very light difference between IMISketch, IMISketch+(Seg)
517
and IMISketch+(Seg&poly) in terms of recognition. With the user
solicita-518
tion, during the analysis, we obtain 97.96% with IMISketch, 98.13% with
IMISketch+(Seg) and 97.93% with IMISketch+(Seg&poly) (Figure 9(b)).
520
This can be explained as the hypotheses proposed by the three methods
521
are not the same. IMISketch produces more hypotheses than IMISketch+(Seg)
522
and IMISketch+(Seg) generates more hypotheses than IMISketch+(Seg&poly).
523
The number of competing hypotheses is more important in IMISketch than
524
IMISketch+(Seg&poly). This might suggest that there are more chance to
525
have the right hypothesis with IMISketch, but the generated confusions are
526
also potentially more numerous. In the end, the results in terms of
recogni-527
tion performance are very comparable.
528
Moreover, the user solicitation decreases from 6 interventions in IMISketch
529
to about 4 interventions in IMISketch+(Seg&poly)(Figure 9(b)). This
de-530
crease shows a reduction in the competing hypothesis that can lead to
ambi-531
guities. This is due to the polygons which has reduced the number of nodes
532
per branch and therefore the conflicts between hypotheses. The obtained
533
errors (about 2%) are due either to poor calibration of the local context, or
534
the badly drawing of certain symbols.
535
The details of computation time per image between the three versions
536
(IMISketch, IMISketch+(Seg) and IMISketch+(Seg&poly)) are shown in
Fig-537
ure 9(c). The images are ordered by the computing time according to
538
IMISketch+(Seg&poly). We improve the computation time from about 11
539
minutes of average computing time per image (with classical IMISketch) to
540
about 4 minutes 43 seconds (with IMISketch+(Seg)), i.e. a gain of 57%.
541
IMISketch+(Seg&poly) further reduces computation time to attain about 2
542
minutes 31 seconds, which presents a total gain of 77%. Depending on the
543
complexity of the plans, the gain of computing time can reach 90% per image
(a) Examples of architectural floor plans
IMISketch IMISketch+(Seg) IMISketch+ (Seg+poly)
Types of primitive Segments Segments and polygons
Building the analysis trees All possible hypotheses in the
local context (classical approach)
Using the new approach described in Section 4.2.2
Number of unrecognized symbols 81 74 82
Recognition rate 97.96% 98.13% 97.93%
Average computation time 11m03 4m43 2m31
Average user solicitation 6.07 5.17 3.59
(b) Characteristics of IMISketch versions and recognition rate on archi-tectural plans per version
(c) Computing time per image showing the disappearance of combinatorial peak using IMISketch+ 32
(image with index 67). We note, in Figure 9(c), that the peaks in the analysis
545
time have completely disappeared with the optimized method. Thus, there is
546
no risk for a long wait to interpret a more complex plan. These computation
547
times are obtained in real conditions, i.e. in the presence of a user in the
548
loop of analysis. Today, the average computation time is 2 minutes 31 per
549
image. In a future work, we will try to reduce the computation time to attain
550
around 1 min 30 per image: experimentally, it seems the ideal timing that
551
allows the user to follow in real time the recognition process.
552
The experimental results are very encouraging. They suggest that it is
553
possible to introduce a descending breadth first analysis by controlling the
554
generated combinatorics. This supports the idea of conceiving an
interac-555
tive systems for the document recognition. User solicitations, driven by the
556
analyzer, guarantee the obtaining of very high rate of reliability even when
557
considering the treatment of complex documents. the use of the polygon
558
primitive does not have a negative impact on the structural recognition rate,
559
in addition it reduces the number of user intervention during the analysis
560
and also accelerates the computation time.
561
Current state of IMISketch system
562
Optimizations of our IMISketch method were carried out to the
inter-563
pretation of more complex architectural plans containing a dozen furniture
564
types (toilet, table, bed...), 3 types for openings (door, window and sliding
565
window) and walls. Indeed, some experiments on 24 architectural
handwrit-566
ten plans (see Figure 10) show that the structural recognition rate increase
567
from 91% without user solicitations to 96% with user solicitations.
568
We can notice that the best compromise (recognition rates/user
(a) Original image (b) Interpreted image
Figure 10: Interpretation of a complex architectural floor plans
tions) is obtained with 12 user solicitations per image: it means that 4% of
570
primitive interpretations require the user solicitation. 49% of user
solicita-571
tions are useful to take the right decision which is not the best hypothesis
572
proposed by the analyser (more details in [16]).
573
7. Conclusion
574
In this paper, we have presented a complete generic method to interpret
575
sketches such as 2D architectural floor plans. This method consists of a
576
preprocessing phase in which we extract useful primitives which constitute
577
the inputs of an interactive analyzer. This analyzer is based on a
competi-578
tive breadth-first exploration of the analysis tree according to a dynamical
579
local context of the document. The decision process is able to solicit the
580
user in the case of strong ambiguity. Generally, the competitive breadth-first
581
exploration generates combinatorics. Our interactive method integrates an
582
optimization strategy for solving combinatorics. This strategy concerns the
preprocessing phase and the analysis phase. The preprocessing phase avoids
584
the aggomeration of primitives in reduced zones of document. At the
anal-585
ysis phase, the strategy is based on a dynamic construction of analysis tree
586
by controlling the depth of each branch following a set of criteria specified in
587
the current local context. It may be noted that this strategy is generic and
588
therefore it could be easily applied to other types of st uctured documents,
589
and other analyzers characterized by a breadth-first exploration. The first
590
tests of this interactive analyzer have been made on 2D handwritten
archi-591
tectural floor plans. Integrating the user in the analysis process is, in our
592
view, a key point to address complex off-line sketch recognition and to avoid
593
an a posteriori verification phase.
594
Future work will focus on extending the experimental results on large
595
image databases containing more complex architectural plans (integration of
596
furniture, quotes, etc.). We will also validate the criteria of acceptability and
597
usability of the system by doing usage tests that will be conducted in
collabo-598
ration with experts from the Loustic laboratory (http://www.loustic.net/rennes).
599
Acknowledgment
600
The authors would like to thank all the people who took part in the
601
experiments. This work partially benefits from the financial support of the
602
ANR Project Mobisketch.
603
References
604
[1] Almaksour, A., Anquetil, E., 2011. Improving premise structure in
605
evolving takagi-sugeno neuro-fuzzy classifiers. Evolving Systems 2, 25–
33.
607
[2] Alvarado, C., Davis, R., 2007. Sketchread: a multi-domain sketch
recog-608
nition engine. In: ACM SIGGRAPH 2007 courses. ACM, pp. 34–es.
609
[3] Aoki, Y., Shio, A., Arai, H., Odaka, K., 1996. A prototype system for
610
interpreting hand-sketched floor plans. In: Pattern Recognition, 1996.,
611
Proceedings of the 13th International Conference on. Vol. 3. IEEE, pp.
612
747–751.
613
[4] Bunke, H., nov. 1982. Attributed programmed graph grammars and
614
their application to schematic diagram interpretation. Pattern Analysis
615
and Machine Intelligence, IEEE Transactions on PAMI-4 (6), 574 –582.
616
[5] Bunke, H., 1990. String grammars for syntactic pattern recognition.
Syn-617
tactic and Structural Pattern Recognition. Theory and Applications,
618
29–54.
619
[6] Chan, K., Yeung, D., 2000. An efficient syntactic approach to
struc-620
tural analysis of on-line handwritten mathematical expressions. Pattern
621
Recognition 33 (3), 375–384.
622
[7] Chang, H.-H., Yan, H., 1998. Vectorization of hand-drawn image using
623
piecewise cubic bézier curves fitting. Pattern Recognition 31 (11), 1747
624
– 1755.
625
[8] Coüasnon, B., 2006. Dmos, a generic document recognition method:
626
Application to table structure analysis in a general and in a specific
627
way. IJDAR 2006 8 (2), 111–122.
[9] de Brucq, D., Amara, M., Courtellemont, P., Wallon, P., Mesmin, C.,
629
1996. A recursive estimation of parameters of straight lines and circles
630
by an extended Kalman filtering. Application to the modeling of
on-631
line Handwritten drawings. In: International Conference on Signals and
632
Image Processing and Applications (SIPA’96). pp. 213–216.
633
[10] Dosch, P., Tombre, K., Ah-Soon, C., Masini, G., 2000. A complete
sys-634
tem for analysis of architectural drawings. International Journal On
Doc-635
ument Analysis and Recognition 3 (2), 102–116.
636
[11] Fahmy, H., Blostein, D., aug-3 sep 1992. A survey of graph grammars:
637
theory and applications. In: Pattern Recognition, 1992. Vol.II.
Confer-638
ence B: Pattern Recognition Methodology and Systems, Proceedings.,
639
11th IAPR International Conference on. pp. 294 –298.
640
[12] Fitzgerald, J., Geiselbrechtinger, F., Kechadi, T., 2007. Mathpad: A
641
fuzzy logic-based recognition system for handwritten mathematics. In:
642
ICDAR 2007. Vol. 2. pp. 694 –698.
643
[13] Freeman, I. J., Plimmer, B., 2007. Connector semantics for sketched
di-644
agram recognition. In: Proceedings of the eight Australasian conference
645
on User interface - Volume 64. AUIC ’07. Australian Computer Society,
646
Inc., Darlinghurst, Australia, Australia, pp. 71–78.
647
URL http://dl.acm.org/citation.cfm?id=1273714.1273726
648
[14] Ghorbel, A., Almaksour, A., Lemaitre, A., Anquetil, E., 2011.
Incre-649
mental learning for interactive for sketch reconition. Ninth IAPR
Inter-650
national Workshop on Graphics RECognition - GREC 2011.
[15] Ghorbel, A., Anquetil, E., Lemaitre, A., 2012. Optimization analysis
652
based on a breadth-first exploration for a structural approach of sketches
653
interpretation. In: Document Analysis Systems (DAS), 2012 10th IAPR
654
International Workshop on. pp. 240–244.
655
[16] Ghorbel, A., Lemaitre, A., Anquetil, É., 2012. Competitive hybrid
ex-656
ploration for off-line sketches structure recognition. In: ICFHR. pp. 571–
657
576.
658
[17] Ghorbel, A., Macé, S., Lemaitre, A., Anquetil, E., 2011. Interactive
659
competitive breadth-first exploration for sketch interpretation. ICDAR
660
2011, 1195–1199.
661
[18] Hammond, T., Davis, R., 2003. Ladder: A language to describe drawing,
662
display, and editing in sketch recognition.
663
[19] Hammond, T., Davis, R., 2005. Ladder, a sketching language for user
664
interface developers. Computers & Graphics 29 (4), 518–532.
665
[20] Hammond, T., O’Sullivan, B., 2007. Recognizing free-form
hand-666
sketched constraint network diagrams by combining geometry and
con-667
text. Proceedings of the Eurographics Ireland 2007.
668
[21] Hammond, T., Paulson, B., Oct. 2011. Recognizing sketched multistroke
669
primitives. ACM Trans. Interact. Intell. Syst. 1 (1), 4:1–4:34.
670
URL http://doi.acm.org/10.1145/2030365.2030369
671
[22] Hammond, T. A., Davis, R., 2009. Recognizing interspersed sketches
672
quickly. In: Proceedings of Graphics Interface 2009. pp. 157–166.
[23] Hilaire, X., Tombre, K., 2006. Robust and accurate vectorization of line
674
drawings. IEEE Transactions on Pattern Analysis and Machine
Intelli-675
gence 28, 890–904.
676
[24] Lemaitre, A., Camillerapp, J., 2006. Text line extraction in handwritten
677
document with kalman filter applied on low resolution image. Document
678
Image Analysis for Libraries, International Workshop on 0, 38–45.
679
[25] Lemaitre, M., Grosicki, E., Geoffrois, E., Preteux, F., 2007. Preliminary
680
experiments in layout analysis of handwritten letters based on textural
681
and spatial information and a 2d markovian approach. In: ICDAR 2007.
682
Vol. 2. pp. 1023 –1027.
683
[26] Lladós, J., López-Krahe, J., Martí, E., 1997. A system to understand
684
hand-drawn floor plans using subgraph isomorphism and hough
trans-685
form. Machine Vision and Applications 10 (3), 150–158.
686
[27] luen Do, E. Y., 2001. Vr sketchpad, create instant 3d worlds by
sketch-687
ing on a transparent window. In: Proceedings of CAAD Futures 2001
688
(Eindhoven. Kluwer Academic Publishers, pp. 161–172.
689
[28] Macé, S., Anquetil, E., 2009. Eager interpretation of on-line
hand-690
drawn structured documents: The dali methodology. Pattern
Recog-691
nition 42 (12), 3202–3214.
692
[29] Mao, S., Rosenfeld, A., Kanungo, T., 2003. Document structure analysis
693
algorithms: a literature survey. In: Proc. SPIE Electronic Imaging. Vol.
694
5010. pp. 197–207.
[30] Montreuil, F., Grosicki, E., Heutte, L., Nicolas, S., 2009. Unconstrained
696
handwritten document layout extraction using 2d conditional random
697
fields. ICDAR 2009 0, 853–857.
698
[31] Plimmer, B., Freeman, I., 2007. A toolkit approach to sketched diagram
699
recognition. In: Proceedings of the 21st British HCI Group Annual
Con-700
ference on People and Computers: HCI...but not as we know it - Volume
701
1. BCS-HCI ’07. British Computer Society, Swinton, UK, UK, pp. 205–
702
213.
703
URL http://dl.acm.org/citation.cfm?id=1531294.1531323
704
[32] Sezgin, T. M., Davis, R., 2005. Hmm-based efficient sketch recognition.
705
In: Proceedings of the 10th international conference on Intelligent user
706
interfaces. IUI ’05. ACM, New York, NY, USA, pp. 281–283.
707
URL http://doi.acm.org/10.1145/1040830.1040899
708
[33] Sheraz Ahmed, a. M. L., Weber, M., Dengel, A., 2011. Improved
auto-709
matic analysis of architectural floor plans. ICDAR 2011, 864–868.
710
[34] Takagi, T., Sugeno, M., 1985. Fuzzy identification of systems and its
711
applications to modeling and control. Systems, Man and Cybernetics,
712
IEEE Transactions on SMC-15 (1), 116–132.
713
[35] Yamamoto, R., Sako, S., Nishimoto, T., Sagayama, S., Oct. 2006.
714
On-line recognition of handwritten mathematical expressions based on
715
stroke-based stochastic context-free grammar. In: Tenth International
716
Workshop on Frontiers in Handwriting Recognition. Suvisoft, La Baule
717
(France).