HAL Id: tel-03130651
https://tel.archives-ouvertes.fr/tel-03130651
Submitted on 3 Feb 2021HAL is a multi-disciplinary open access
archive for the deposit and dissemination of sci-entific research documents, whether they are pub-lished or not. The documents may come from teaching and research institutions in France or abroad, or from public or private research centers.
L’archive ouverte pluridisciplinaire HAL, est destinée au dépôt et à la diffusion de documents scientifiques de niveau recherche, publiés ou non, émanant des établissements d’enseignement et de recherche français ou étrangers, des laboratoires publics ou privés.
Influence of new network architectures and usages on
RF human exposure in cellular networks
Amirreza Chobineh
To cite this version:
Amirreza Chobineh. Influence of new network architectures and usages on RF human exposure in cellular networks. Electromagnetism. Institut Polytechnique de Paris, 2020. English. �NNT : 2020IP-PAT019�. �tel-03130651�
I
NFLUENCE OF NEW NETWORK
ARCHITECTURES AND USAGES ON RF
HUMAN EXPOSURE IN CELLULAR
NETWORKS
Thèse de doctorat de l’Institut Polytechnique de Paris Préparée à Télécom Paris École doctorale n°626 Institut Polytechnique de Paris (ED IP Paris)
Spécialité de doctorat : Réseaux, Informations, Communications Thèse présentée et soutenue à Palaiseau, le 02 Juillet 2020, par
Amirreza Chobineh
Composition du Jury :
Hélène Roussel
Sorbonne Université Présidente
Philippe De Doncker
Université Libre de Bruxelles Rapporteur Christian Person
IMT Atlantique Rapporteur
Shermila Mostarshedi
Université Gustave Eiffel Examinatrice David Lautru
Université Paris Nanterre Examinateur Philippe Martins
Ecole Télécom Paris Examinateur
Emmanuelle Conil
Agence National des Fréquences Co-Directrice de thèse
NNT : 2 0 2 0 IP P A T 0 1 9
A
CKNOWLEDGEMENTS
Firstly, I would like to thank the members of my dissertation committee: Prof. Philippe De Doncker, Prof. Christian Person, Prof. Shermila Mostarshedi, Prof. Hélène Roussel, Prof. David Lautru and Prof. Philippe Martins for their time, support and guidance during the preparation of this document.
I offer my thanks to ANFR team especially Mr. Jean-Benoît Agnani for their support, feedbacks, and discussions throughout my Ph.D.
I would like to express my sincere gratitude to my supervisors Dr. Joe Wiart and Dr. Emmanuelle Conil for the continuous support of my Ph.D. study and related research, for their patience and immense knowledge. Their guidance helped me throughout the research and writing of this thesis.
I thank my colleagues Bader, Marouf, Taghrid, Soumaya, Yuanyuan, Ziecheng, Xi, Mauricio and Tarek for the interesting discussions, and for all the fun we have had in the last three years.
I am grateful to my wife Hiva, my parents and my sister, for supporting me by all means throughout writing this thesis and my life in general.
iv
A
BSTRACT
In coming years, there will be a sharp growth in wireless data traffic due to the increasing usage of mobile phones and implementation of IoT technology. Therefore, mobile network operators aim to increase the capacity of their networks, to provide higher data traffic with lower latency, and to support thousands of connections. One of the primary efforts toward these goals is to densify today's cellular Macrocell networks using Small cells to bring more coverage and higher network capacity. Small cell antennas emit lower power than Macrocells and are often deployed at lower heights. As a consequence, they are closer to the user and can be implemented massively. The latter can result in an important raise in public concerns.
Mobile phones are used on the one hand, for a large variety of data usages that require different amounts of data and throughput and on the other hand for making phone calls. Voice over IP applications such as Skype has become very popular since they provide cheap international voice communication and can be used on mobile devices. Since LTE systems only support packet services, the voice service uses Voice over LTE technology instead of classical circuit-switched voice technology as in GSM and UMTS.
The main objective of this thesis is to characterize and analyze the influence of new network architectures and usages on the actual human exposure induced by cellular networks. In this respect, several measurement campaigns were carried out in various cities and environments.
Regarding the EMF exposure in heterogeneous networks, results suggest that by implementing Small cells, the global exposure (i.e. exposure induced by mobile phone and base station antenna) reduces due to the fact that by bringing the antenna closer to the user the emitted power by mobile phone and the usage duration reduce owing to power control schemes implemented in cellular network technologies. However, the magnitude of exposure reduction depends on the location of the Small cell with respect to Macrocells. Moreover, to assess the EMF exposure of indoor users induced by Small cells, two statistical models are proposed for the uplink and downlink exposures in an LTE heterogeneous environment based on measurements.
The last part of the thesis is devoted to the assessment of the exposure for new types of usages through measurements. Results suggest that the amount of uplink emitted power and the emission time duration by a mobile phone is highly dependent on the usage and
network technology. Voice call communications require a continuous and generally low throughput in order to maintain the communication during the call. On the contrary, in data usage, the mobile phone requires higher data and throughput to perform the task as fast as possible. Therefore, during a voice call even if the user is using the mobile phone for a relatively long time, the exposure time duration should be lower since the usage does not require high amounts of data. The temporal occupation rate for several types of voice calls for different technologies is assessed through measurements.
vi
RÉSUMÉ
Dans les années à venir, le trafic de données dans les réseaux cellulaires connaîtra une forte croissance en raison de l'augmentation d’utilisation des téléphones mobiles et de la mise en œuvre de la technologie des objets connectés. Par conséquent, les opérateurs de réseaux mobiles visent à augmenter la capacité de leurs réseaux avec une latence plus faible et à supporter des milliers de connexions simultanément. L'un des principaux efforts est de densifier les réseaux Macrocells actuels par les Small cells afin d’offrir plus de couverture et de débit aux utilisateurs. Les antennes Small cells émettent de faibles puissances et sont souvent déployées à de faibles hauteurs. En conséquence, ils sont plus proches des utilisateurs, peuvent être déployés massivement mais génèrent également des inquiétudes chez les riverains.
Les téléphones portables sont utilisés pour une grande variété d'utilisations qui nécessitent différentes quantités de données et de débit. Les applications de voix sur IP telles que Skype sont devenues très populaires car elles fournissent une communication vocale internationale peu onéreuse et peuvent être utilisées sur les appareils mobiles. Étant donné que les systèmes LTE ne prennent en charge que les services par paquets, le service vocal utilise la technologie voix sur LTE au lieu de la technologie « circuits » classique comme avec le GSM et UMTS.
L'objectif principal de cette thèse est d'évaluer l'influence des nouvelles architectures des réseaux et usages sur l'exposition actuel du publique induite par les réseaux cellulaires. À cet égard, plusieurs campagnes de mesures ont été menées dans différentes villes et environnements.
En ce qui concerne l'exposition aux champs électromagnétiques dans les réseaux hétérogènes, les résultats suggèrent qu'en déployant les Small cells, la puissance émise par le téléphone mobile, en raison de la proximité de l’antenne et par conséquent l’exposition global diminue.
De plus, pour évaluer l'exposition EMF des utilisateurs indoor induite par les Small cells, deux modèles statistiques sont proposés pour les expositions montante et descendante induite dans un réseau hétérogène LTE.
La dernière partie de cette thèse est consacrée à l'évaluation de l'exposition aux nouveaux types d'usages. Les résultats suggèrent que la puissance émise et la durée d'émission par un téléphone mobile dépendent fortement de l’usage et de la technologie du réseau. Les communications voix nécessitent un débit continu et généralement faible afin de maintenir la communication pendant l'appel. Au contraire, dans le cas de l’usage données, le téléphone mobile nécessite des débits plus élevés pour effectuer la tâche le plus rapidement. Par conséquent, pendant un appel voix, même si l'utilisateur utilise le téléphone portable pendant une durée relativement longue, la durée de l'exposition est moins longue car l'utilisation ne nécessite pas une grande quantité de données. Ainsi, le taux d'occupation temporelle de plusieurs types d'appels voix pour différentes technologies est évalué par les mesures.
viii
C
ONTENTS
1. GENERAL INTRODUCTION ... 20
2. HUMAN EXPOSURE INDUCED BY ELECTROMAGNETIC FIELDS ... 25
2.1. HUMAN EXPOSURE TO EMF ... 26
2.1.1 Electromagnetic Field... 26
2.1.2 Exposure metrics: Specific Absorption Rate (SAR)... 27
2.2. PROTECTION LIMITS... 28
2.3. EXPOSURE ASSESSMENT FOR BASE STATIONS ANTENNAS... 31
2.3.1 Numerical assessment ... 31
2.3.2 Experimental assessment ... 36
2.4. EXPOSURE ASSESSMENT FOR USER DEVICE ... 41
2.4.1 Numerical assessment ... 41
2.4.2 Experimental measurement for compliance testing in laboratory ... 43
2.5. ACTUAL EXPOSURE ASSESSMENT ... 45
2.6. GLOBAL EXPOSURE ... 48
2.6.1 Relation between RX and TX... 48
2.6.2 Global exposure and Exposure Index (EI) ... 52
2.6.3 Exposure index assessment in classic cellular networks ... 54
2.7. EXPOSURE IN HETEROGENEOUS NETWORKS ... 54
2.8. THE INFLUENCE OF TECHNOLOGY AND USAGE ON HUMAN EXPOSURE ... 56
2.9. CONCLUSION ... 58
3. INFLUENCE OF NETWORK DENSIFICATION ON HUMAN EXPOSURE 60 3.1. INTRODUCTION ... 61
3.2. MEASUREMENT DESCRIPTION ... 62
3.3. BASEL MEASUREMENT CAMPAIGN (MACROCELL MEASUREMENTS) ... 64
3.4. ANNECY AND MONTREUIL MEASUREMENT CAMPAIGNS (SMALL CELL MEASUREMENT TRIALS)... 69
3.4.1 Measurement description ... 69
3.4.2 E-field Stationary and Spatial measurement results ... 74
x
3.5. PATH LOSS MEASUREMENTS AND MODELING ... 86
3.5.1 Linear regression modelling method ... 88
3.5.2 Statistical modelling of path loss exponent ... 90
3.5.3 Uplink emitted and downlink received powers... 92
3.6. EXPOSURE INDEX ASSESSMENT IN AN LTE SCENARIO USING PROPOSED MODELS 94 3.7. CONCLUSION ... 97
4. INFLUENCE OF USAGE AND TECHNOLOGY ON HUMAN EXPOSURE 101 4.1. INTRODUCTION ... 102
4.2. CIRCUIT SWITCHED AND PACKET SWITCHED COMMUNICATION ... 103
4.3. ASSESSMENT AND ANALYSIS OF TX AND RX DURING DIFFERENT TYPES OF VOICE AND DATA COMMUNICATION (BASEL MEASUREMENTS) ... 106
4.4. ANALYSIS OF TEMPORAL POWER EMISSION VARIATION FOR VOICE COMMUNICATION TECHNOLOGIES AND APPLICATIONS ... 111
4.5. TEMPORAL OCCUPATION RATE RESULTS ... 112
4.6. CONCLUSION ... 115
5. CONCLUSION ... 118
6. APPENDICES ... 123
6.1. BASEL MEASUREMENT UMTSTX/RX RESULTS ... 124
6.2. BASEL MEASUREMENT GSMTX/RX RESULTS... 127
7. BIBLIOGRAPHY ... 129
8. PUBLICATIONS ... 137
8.1. JOURNAL ... 138
L
IST OF
T
ABLES
TABLE 1, BASIC RESTRICTIONS FOR TIME-VARYING ELECTRIC, MAGNETIC AND ELECTROMAGNETIC FIELDS FROM ICNIRP1998 GUIDELINES [9]. ... 29
TABLE 2, REFERENCE LEVELS FOR WHOLE-BODY EXPOSURE TO TIME-VARYING FAR-FIELD ELECTRIC, MAGNETIC AND ELECTROMAGNETIC FIELDS, FROM 1 MHZ TO 300 GHZ FROM ICNIRP1998 GUIDELINES [9] ... 30
TABLE 3, WHOLE-BODY SAR VALUES W/KG FOR CHILD AND ADULT MODELS FOR DIFFERENT USAGE AND FREQUENCY BANDS ... 51
TABLE 4, LIST OF MEASUREMENT LOCATIONS... 64 TABLE 5,MEASURED RSRP AND UETX POWERS FOR INDOOR AND OUTDOOR LOCATIONS
IN BASEL CAMPAIGN ... 68 TABLE 6,SC MEASUREMENT CAMPAIGNS CHARACTERISTICS ... 70 TABLE 7, STATIONARY MEASUREMENTS RESULT FOR ALL SITES IN ANNECY AND
MONTREUIL CAMPAIGNS. E-FIELD VALUES ARE THE QUADRATIC SUM OF THE MEASURED FIELDS AT 800MHZ,1800MHZ, AND 2600MHZ LTE BANDS. ... 76 TABLE 8,E-FIELD VALUES ARE THE QUADRATIC SUM OF THE MEASURED FIELDS AT 800 MHZ,1800MHZ, AND 2600MHZ LTE BANDS. ... 77
TABLE 9, STATIONARY MEASUREMENT RESULTS FOR ALL SITES IN ANNECY AND
MONTREUIL CAMPAIGNS. ... 78
TABLE 10, UPLINK AND DOWNLINK MEASURED THROUGHPUT IN THE MONTREUIL CAMPAIGN FOR SCON AND SCOFF SCENARIOS. ... 79 TABLE 11,CHARACTERISTICS OF THE UETX POWERS AND THROUGHPUT IN ANNECY AND
MONTREUIL SPATIAL TRACE MOBILE MEASUREMENTS FOR CLUSTER 1 AND 2 IN SCON AND SCOFF SCENARIOS ... 81
TABLE 12,SCON AND SC OFF THROUGHPUT RATIO FOR CLUSTER 1 AND CLUSTER 2 ... 83
TABLE 13,GLOBAL EXPOSURE PARAMETERS ... 84 TABLE 14, COMPUTED DL DOSE, UL DOSE AND GLOBAL EXPOSURE FOR ONE DAY,100
UPLOAD FOR A USER BASED ON MEASURED DATA ... 85 TABLE 15,CHARACTERSITICS OF FITTED MODELS VIA LINEAR REGRESSION TO MEASURED
xii
TABLE 16, CHARACTERISTICS OF PLE DISTRIBUTIONS FOR 1800MHZ AND 2600MHZ,
CLOSER AND FURTHER THAN 60M FROM THE SC ... 91
TABLE 17, CHARACTERISTICS OF THE COMPUTED AND MEASURED RSRP VALUES ... 92
TABLE 18,CHARACTERISTICS OF COMPUTED AND MEASURED UETX AND RX FOR 1800 AND 2600MHZ ... 93
TABLE 19,SCENARIO NETWORK CONFIGURATIONS ... 95
TABLE 20,EXPOSURE CONFIGURATION ... 96
TABLE 21,EI FOR DIFFERENT FREQUENCIES ... 96
TABLE 22, COMPUTED DETAILED EI FOR DIFFERENT FREQUENCIES AND EVIRONMENTS ... 97
TABLE 23,MEASUREMENTS SCENARIOS FOR EACH LOCATION FOR BASEL CAMPAIGN ... 106
TABLE 24, CHARACTERISTICS OF UE TX POWER IN DIFFERENT USAGES FOR LTE TECHNOLOGY ... 107
TABLE 25,CHARACTERISTICS OF THE ALLOCATED ULPRBS TO UE FOR DIFFERENT USAGES IN BASEL CAMPAIGN FOR LTE TECHNOLOGY ... 110
TABLE 26,CHARACTERISTICS OF LTEUL THROUGHPUT FOR DIFFERENT USAGES IN BASEL TRIAL ... 110
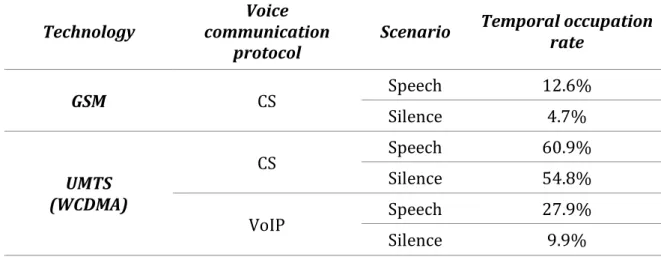
TABLE 27,UETX TEMPORAL OCCUPATION RATE OVER 6 MINUTES FOR GSM,UMTS AND LTE TECHNOLOGIES FOR SPEECH AND SILENCE SCENARIOS ... 112
TABLE 28, CHARACTERISTICS OF UETX POWER FOR DIFFERENT USAGES IN BASEL TRIAL FOR UMTS TECHNOLOGY ... 126
TABLE 29,CHARACTERISTICS OF UL THROUGHPUT FOR DIFFERENT USAGES IN BASEL TRIAL FOR UMTS TECHNOLOGY ... 126
L
IST OF
F
IGURES
FIGURE 1,VIRTUAL FAMILY HUMAN MODELS [21] ... 32
FIGURE 2,WHOLE-BODY SAR VARIATION IN TERMS OF FREQUENCY FOR DIFFERENT HUMAN MODELS FOR STANDING POSITION [22] ... 33
FIGURE 3,SAR VALUES IN TERMS OF FREQUENCY FOR DIFFERENT AGES [22] ... 34
FIGURE 4, WHOLE-BODY AVERAGED SAR FOR POLAR-WAVE EXPOSURE FROM THREE ELEVATIONS IN BOTH V AND H-POLARIZATIONS AND FROM AZIMUTH FROM 0° TO 360° AT 2100MHZ.THE INCIDENT POWER IS 1W/M2[26] ... 35
FIGURE 5, WHOLE-BODY AVERAGED SAR FOR DIFFERENT BODY POSTURES AND WAVE POLARIZATIONS (HOR: HORIZONTAL POLARIZATION)[28] ... 35 FIGURE 6,ELECTRIC FIELD (V/M) IN THE E PLANE, COMPUTED BY THE SYNTHETIC MODEL
(SOLID LINE) AND THE GAIN BASED MODEL (DASHED LINE)[29] ... 36 FIGURE 7,EXAMPLE OF MEASUREMENT POINTS LOCATION FOR SPATIAL AVERAGING [36] ... 37
FIGURE 8, THE VARIATION OF THE EMITTED FIELD BY A GSM ANTENNA DURING 24-HOUR,
NORMALIZED TO ITS MEAN VALUE AT 1800MHZ ... 38 FIGURE 9,E-FIELD MEASUREMENT EQUIPMENT, LEFT: WIDEBAND FIELD METER (NARDA
NBM550), MIDDLE:SELECTIVE SPECTRUM ANALYZER (NARDA SRM-3006), RIGHT:
EXPOSIMETER (MVGSPY) ... 40
FIGURE 10, SPHERICAL WAVE COEFFICIENTS CAN BE MEASURED BY MVG “STARLAB” NEAR-FIELD MEASUREMENT SYSTEM [44]... 41 FIGURE 11, A 3D MOBILE PHONE MODEL [46] ... 42
FIGURE 12, RADIATION PATTERNS OF MOBILE PHONE IN FREE SPACE (BLUE) AND WITH HUMAN BODY (RED AND GREEN) TO CHARACTERIZE THE EFFECT OF COUPLING WITH HEAD [52] ... 43
FIGURE 13,SAR MEASUREMENT SETUP ... 44 FIGURE 14,VECTOR-BASED SAR MEASUREMENT SETUP [60] ... 45 FIGURE 15,RELATIVE TOTAL ELECTRIC-FIELD STRENGTH MEASURED DURING ONE WEEK (A)
xiv
FIGURE 16,THE INFLUENCE OF HANDOVER ON TRANSMITTED POWER FOR GSM(UP) AND
WCDMA(DOWN)IN VOICE CALL MODE.INSTANTANEOUS POWER (FILLED CURVE) AND HANDOVER (DOTS) ... 48
FIGURE 17, THE MEASURED RECEIVED POWER BY UE IN TERMS OF UPLINK EMITTED POWER IN GSM (BLUE CURVE), DCS (LIGHT BLUE) AND UMTS (RED), VERTICAL LINES REPRESENT THE STANDARD DEVIATION AND THE HORIZONTAL LINE THE AVERAGE RX
[4] ... 49
FIGURE 18,RX AND TX MEASURED IN LTE TECHNOLOGY, BLACK LINE REPRESENTS THE MEAN VALUE, BLUE LINE THE STANDARD VARIATION, AND RED POINTS THE MINIMUM AND MAXIMUM MEASURED VALUES OF TX. ... 50 FIGURE 19,IMPLEMENTED SC ON TOP OF A BUS STATION IN AMSTERDAM [79]. ... 61 FIGURE 20,TX AND RX POWER VARIATIONS FOR TWO DIFFERENT LOCATIONS FOR LTE
DATA USAGE MEASURED IN BASEL. ... 65 FIGURE 21,THE DISTRIBUTION OF RX VALUES FOR TWO DIFFERENT LOCATIONS FOR LTE
DATA USAGE MEASURED IN BASEL. ... 66 FIGURE 22,CDF OF MEASURED RSRP FOR INDOOR AND OUTDOOR LOCATIONS IN BASEL
CAMPAIGN ... 66
FIGURE 23, CDF OF MEASURED LTE UPLINK EMITTED POWER BY UE FOR INDOOR AND OUTDOOR LOCATIONS IN BASEL TRIAL ... 67
FIGURE 24,UETX VS RSRP FOR LTE TECHNOLOGY IN BASEL CAMPAIGN, ON THE LEFT SCATTER PLOT AND ON THE RIGHT RED DOTS REPRESENT THE MINIMUM AND MAXIMUM VALUES, BLUE LINES REPRESENT THE STANDARD DEVIATION AND BLACK LINES REPRESENT THE AVERAGE VALUE... 68
FIGURE 25,PDF OF MEASURED UL EMITTED POWER FOR ALL MEASUREMENTS ... 69
FIGURE 26,SCS INSTALLED ON TOP OF BUS STOPS AND ADVERTISEMENT PANELS ... 69
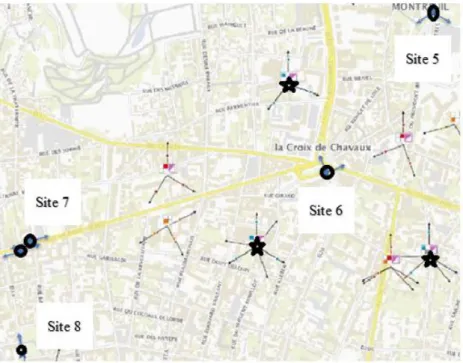
FIGURE 27,SCS IN ANNECY UNDER MEASUREMENT AND THE LOCATION OF MEASUREMENT ANTENNAS AT FIXED POSITIONS FOR STATIONARY MEASUREMENTS ... 72 FIGURE 28,ANNECY MEASUREMENT MAP.BLACK CIRCLES PRESENT THE LOCATION OF SCS, CROSS SHOWS THE NEAREST MC.THE TRACE MOBILE PHONE IS CONNECTED TO MC (RED) AND SCS (GREEN) DURING THE PATH. ... 73
FIGURE 29,MONTREUIL MEASUREMENT MAP, BLACK CIRCLES REPRESENT SCS AND BLACK STARS MCS OF THE SAME OPERATOR, ARROWS REPRESENT THE DIRECTION OF ANTENNAS ... 74
FIGURE 30, CDFS OF NORMALIZED MEASURED E-FIELD FOR STATIC MEASUREMENTS IN
ANNECY,E-FIELD VALUES ARE THE QUADRATIC SUM OF THE MEASURED FIELDS AT
800MHZ,1800MHZ AND 2600MHZ LTE BANDS. ... 75
FIGURE 31, CDF, MONTREUIL STATIONARY E-FIELD RESULTS FOR SC ON AND SCOFF SCENARIOS AT THE SAME LOCATIONS.E-FIELD VALUES ARE THE QUADRATIC SUM OF THE MEASURED FIELDS AT 800 MHZ,1800MHZ, AND 2600MHZ LTE BANDS. ... 75 FIGURE 32,ANNECY AND MONTREUIL STATIONARY MEAN E-FIELD COMPARISON.E-FIELD
VALUES ARE THE QUADRATIC SUM OF THE MEASURED FIELDS AT 800MHZ,1800MHZ AND 2600MHZ LTE BANDS. ... 76 FIGURE 33, CDF, SPATIAL MEASUREMENTS, LEFT ANNECY AND RIGHT MONTREUIL.
E-FIELD VALUES ARE THE QUADRATIC SUM OF THE MEASURED E-FIELDS AT 800MHZ,1800 MHZ, AND 2600MHZ LTE BANDS. ... 77 FIGURE 34,CDF,MEASURED RSRP VALUES FOR CLUSTER 1 AND 2 IN SCON AND SCOFF
SCENARIOS FOR SPATIAL MEASUREMENT ... 80
FIGURE 35,CDF OF MEASURED UETX POWER IN CLUSTER 1(LEFT) AND CLUSTER 2(RIGHT) FROM NEMO AND JDSU FOR SPATIAL TRACE MOBILE MEASUREMENTS... 80
FIGURE 36,RSRP VS TX POWER FOR SCON AND SCOFF SCENARIOS IN ANNECY TRIAL FOR ALL SITES FOR SPATIAL TRACE MOBILE MEASUREMENTS ... 81 FIGURE 37,SCON AND SCOFF THROUGHPUT RATIO FOR CLUSTER 1 AND 2 MEASURED BY
JDSU AND NEMO TRACE MOBILES ... 82
FIGURE 38,INDUCED EXPOSURE FOR EACH SCENARIO,ANNECY CLUSTER 1: SC ON CELL EDGE OF MC, ANNECY CLUSTER 2: SC NEAR MC, MONTREUIL: CROWDED URBAN ENVIRONMENT ... 85 FIGURE 39,SC-UE DOWNLINK LINK BUDGET ... 86 FIGURE 40,EXAMPLE OF PATH LOSS MEASUREMENT PATH,SC IS REPRESENTED AS THE BLUE
SQUARE.COLORS REPRESENT THE RSRP VALUES FROM BLUE (HIGHEST) TO ORANGE
xvi
FIGURE 41,PATH LOSS IN TERMS OF DISTANCE TO THE SC FOR FREQUENCY BANDS 1800
MHZ (LEFT) AND 2600MHZ (RIGHT) ... 89
FIGURE 42,PLE VS DISTANCE (M) BETWEEN UE AND SC AT 1800MHZ (LEFT) AND 2600
MHZ (RIGHT). ... 90
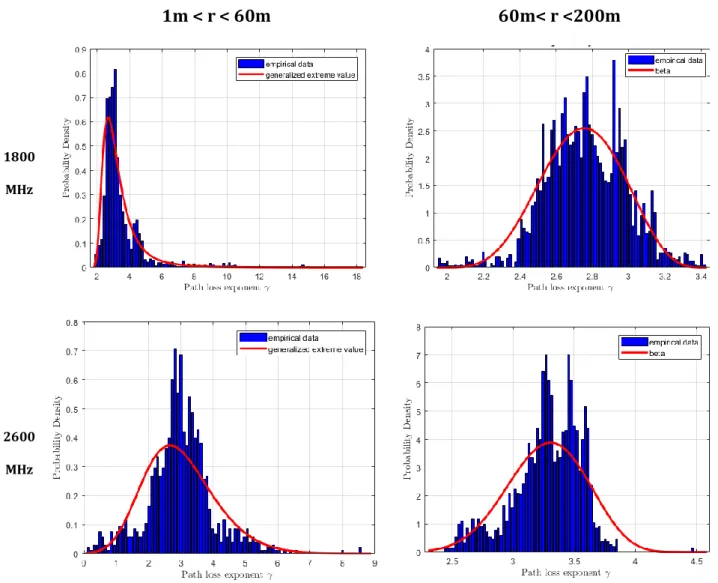
FIGURE 43,PDF, DISTRIBUTION OF MEASURED PLE FOR 1800 AND 2600MHZ FREQUENCIES AND FOR DISTANCES CLOSER THAN 60M AND FURTHER THAN 60M FROM THE SC .... 91
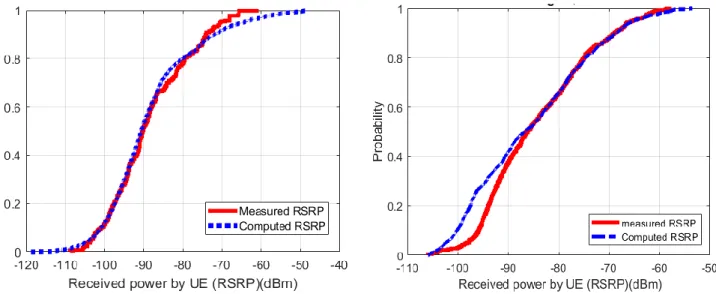
FIGURE 44,CDF,COMAPRAISON BETWEEN MEASURED AND COMPUTED RSRPS FOR 2600
MHZ (LEFT) AND 1800MHZ(RIGHT) FREQUENCY BANDS ... 92
FIGURE 45,COMPARISON BETWEEN MEASURED AND COMPUTED UETX POWER FOR 2600 MHZ (LEFT) AND 1800MHZ(RIGHT) FREQUENCY BANDS ... 93 FIGURE 46,LEFT: THE SCENARIO IS INSPIRED FROM A TYPICAL PARISIAN STREET.RIGHT: DISTRIBUTION OF OBSERVATIONS IN INDOOR (BLUE STARS) AND OUTDOOR (ORANGE STARS) AREAS.THE SC IS PLACED IN THE CENTER OF THE AREA (RED DOT). ... 94 FIGURE 47,ILLUSTRATION OF PRB ALLOCATION FOR A THIRD-PARTY VOIP APPLICATION
AND A NATIVE VOIP APPLICATION (VOLTE) IN LTE TECHNOLOGY... 105 FIGURE 48, CDF EMITTED UPLINK TX POWER FOR LTE TECHNOLOGY AND DIFFERENT
USAGES IN BASEL CAMPAIGN ... 108
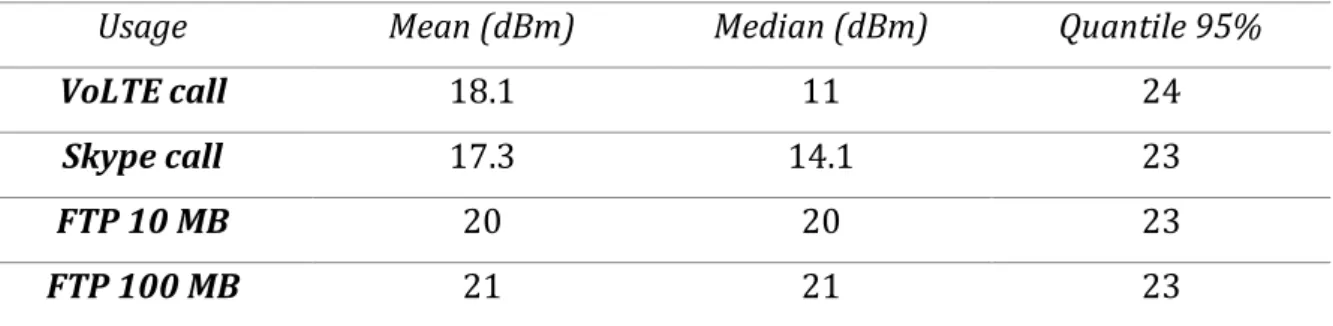
FIGURE 49, LTE TX POWER VS RX POWER FOR VOLTE, VOIP (SKYPE), 10 MB FILE TRANSFER, AND 100MB FILE TRANSFER IN BASEL CAMPAIGN.ON LEFT FIGURES, BLUE DOTS REPRESENT MEASUREMENT POINTS.ON RIGHT FIGURES, RED DOTS REPRESENT THE MINIMUM AND MAXIMUM MEASURED VALUES, BLUE LINES REPRESENT THE STANDARD DEVIATION AND BLACK LINE REPRESENTS THE MEAN VALUE. ... 109
FIGURE 50, CDF, DISTRIBUTION OF ALLOCATED UL PRBS FOR DIFFERENT USAGES IN
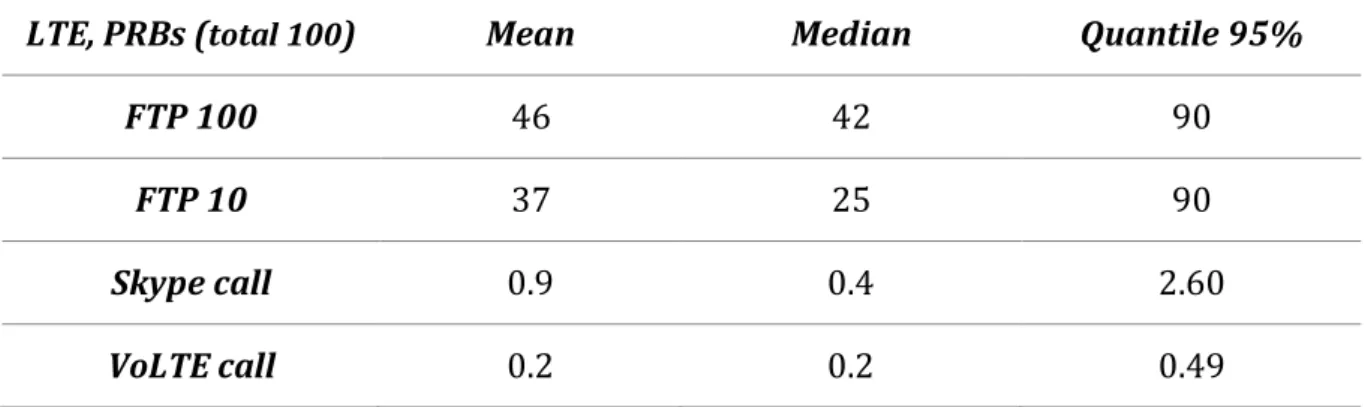
BASEL CAMPAIGN FOR LTE TECHNOLOGY ... 109
FIGURE 51,TEMPORAL UETX POWER MEASUREMENT CONFIGURATION ... 111
FIGURE 52, TEMPORAL VARIATION OF EMITTED POWER BY UE FOR DIFFERENT TECHNOLOGIES... 114 FIGURE 53, CDF, DISTRIBUTION OF UE TX POWERS FOR DIFFERENT USAGES IN BASEL
FIGURE 54,UMTSTX VS RX POWER FOR CS,VOIP(SKYPE),10MB FILE TRANSFER AND
100 MB FILE TRANSFER. BLUE DOTS ON LEFT FIGURES REPRESENT MEASUREMENT POINTS. ON THE RIGHT FIGURES, RED DOTS REPRESENT THE MINIMUM AND MAXIMUM MEASURED VALUES, BLUE LINES THE STANDARD DEVIATION AND BLACK LINE REPRESENT THE MEAN. ... 126
FIGURE 55,GSMTX VS RX POWER FOR CS.BLUE DOTS ON THE LEFT FIGURES REPRESENT MEASUREMENT POINTS. ON THE RIGHT FIGURES, RED DOTS REPRESENT THE MINIMUM AND MAXIMUM MEASURED VALUES, BLUE LINES THE STANDARD DEVIATION, AND BLACK LINES REPRESENT THE MEAN VALUE... 127
xviii
L
IST OF
A
BBREVIATIONS AND
A
CRONYMS
ANFR Agence National des Fréquences BS Base Station
EI Exposure Index EMF Electromagnetic Field
FDTD Finite-Difference Time-Domain GEV Generalized Extreme Value
GSM Global System for Mobile Communication
ICES International Committee on Electromagnetic Safety
ICNIRP International Commission on Non-Ionizing Radiation Protection IEEE Institute of Electrical and Electronics Engineers
LEXNET Low Electromagnetic Fields Exposure Network. LTE Long Term Evolution
MC Macro Cell
PLE Path Loss Exponent QoS Quality of Service RF Radio Frequency
SAM Specific Anthropomorphic Mannequin SAR Specific Absorption Rate
SC Small Cell UE User Equipment
UMTS Universal Mobile Telecommunication System PRB Physical Resource Block
20
Since the 1990s, wireless communication systems, particularly cellular networks, have experienced an exceptional development. This has resulted in the emergence of new technologies, such as smartphones and tablets. Global System for Mobile Communication (GSM), Universal Mobile Telecommunication Systems (UMTS), and Long-Term Evolution (LTE) network technologies are largely deployed all over the world to provide users with voice and data communication. This phenomenal progress in technologies, applications, and wireless devices has led to strong growth in data traffic over the last decade [1]. To respond to such demand, cellular network operators continuously try to improve the efficiency of their networks.
To face 5G ambitious aims which are to provide higher data traffic, lower latency, and support thousands of connections, operators came up with new solutions. One of the main steps toward these goals is to offload traffic from Macrocells (MC) by densifying current networks with Small cells (SC) which results in more coverage, capacity, and better performance. SC antennas are emitted low power and are often deployed at low heights, consequently, they are closer to the user and can be implemented massively. The latter can result in an important raise in public concerns.
Concerns about possible health effects of RF-EMF have arisen to the same extent as the growth of wireless telecommunication technologies. Thus far, the main health effects of EMF exposure in radiofrequency (RF) domain are recognized as thermal overheating of human tissues due to the penetration and absorption of EMF into the body. Concerning the non-thermal sanitary effects of EMF, research projects are taking place continuously to characterize these effects but they remain non-conclusive [2]. To guarantee protection for public and workers against EMF exposure, international organizations such as the International Commission for Protection against Non-Ionizing Radiation (ICNIRP) [3] have recommended a series of limits. While compliance testing and safety standards are based on the worst-case exposure assessment, epidemiological studies focus on the real case exposure evaluation.
Multiple metrics are introduced to assess the exposure depending on characteristics of the source such as output power, frequency, exposure duration, etc. Incident field metrics are used for electric and magnetic fields in terms of power density. Specific absorption rate (SAR) is used to assess the proportion of the absorbed energy in the human body. Dose metrics present a comparative quantity by combining the intensity of exposure (field strength or SAR) and the exposure duration.
22
Concerning cellular networks, people are mainly exposed by two types of sources: on the one hand from sources implemented by network operators such as base stations (BS) or picocell boxes (i.e. downlink exposure) and on the other hand from the user equipment (UE) (i.e. uplink exposure) such as mobile phones. Studies [4] have demonstrated that there is a strong correlation between the power received from a BS and the emitted power by the UE due to the downlink (DL) and uplink (UL) power control algorithms implements in cellular technologies which enable the UE to adapt its output power to the variations of the communication channel. In other words, when the UE experiences a good channel quality, it reduces the emitted power and vice versa. As a consequence, the DL and UL exposure are strongly related and should be assessed simultaneously. In this respect, Global exposure (i.e. exposure induced by mobile phone and base station antenna) [5], [6] has been introduced as a metric that combines the UL and DL doses which provide meaningful information about the actual exposure of a person (see 2.6.2). To assess the actual EMF exposure for a population, many exposure configurations should be taken into account due to the diversity of network technologies, sources, usages, environments, people’s lifestyles, etc. In this context, the Exposure Index (EI) metric is introduced which takes into consideration the Global exposure and a large number of parameters to assess the exposure of a given population in a geographical area by providing a comprehensible output (see Section 2.6.2) [6].
This thesis is composed of three main chapters. Chapter 2 introduces the state of art on RF-EMF exposure problematic as well as a brief explanation on existing protection limits (see Section 2.2) and frequently used methods and protocols to assess the normative and actual exposures induced by near field and far-field sources through numerical simulations and in situ measurements (Section 2.3). Variabilities related to SAR assessments and influencing parameters are discussed in Section 2.4.1.2. Global exposure and Exposure Index assessments are presented in Section 2.6. Finally, Section 2.7 and Section 2.8 focus on the influence of new network architectures and new usages on global exposure.
Chapter 3 presents the work carried out to characterize the exposure in a homogenous and multiple heterogeneous LTE networks through several measurement campaigns. Measurement results are analyzed in terms of UL emitted power and DL received power by UE, DL electric field, and throughput (see Section 3.3 and Section 3.4). To assess the Exposure Index for indoor population, the UL and DL exposures are modeled based on measurement results using
statistical modelling methods (see Section 3.5). Finally, using these models the Exposure Index is computed for a scenario including indoor and outdoor users in Section 3.6.
Chapter 4 is devoted to the characterization of the exposure for different types of usages in GSM, UMTS, and LTE technologies through several measurement campaigns. Results including the UL power emitted and DL received power density from BS for different technologies, usages, and environments are presented in Section 4.3. Section 4.4 focuses on the temporal variation of the UL emitted power by UE during voice communication in circuit-switched and packet-circuit-switched technologies.
2. H
UMAN EXPOSURE INDUCED BY
ELECTROMAGNETIC FIELDS
26
2.1. Human exposure to EMF
2.1.1 Electromagnetic Field
The EMF generated by RF sources is composed of correlated electric E and magnetic H fields having magnitude, phase, and direction. The relations and variations of these electric and magnetic fields, as well as, charges and currents associated with these EMFs are governed by the well-known Maxwell equations (1) and (2). Consider a media having respectively permittivity, permeability and conductivity equal to ε, μ, and σ, the Maxwell equations applied to the EMF induced by electric and magnetic currents 𝐽𝑖 and 𝑀𝑖 in frequency domain can be written as:
𝛻 × 𝑬 = −𝑴𝒊− 𝑗𝜔𝜇𝑯 (1)
∇ × 𝑯 = 𝑱𝒊+ 𝜎𝑬 + 𝑗𝜔𝜀𝑬 (2)
Where E (𝑉 𝑚⁄ ) and H (𝐴 𝑚⁄ ) are a complex spatial form of respectively electric and magnetic fields. 𝐽𝑖 (𝐴 𝑚⁄ 2) and 𝑀𝑖 (𝑉 𝑚⁄ 2) are the electric and magnetic currents supplied to the sources. The equation (3) representing the conservation of power law is obtained via equations (1) and (2): −𝛻 ∙ (1 2𝑬 × 𝑯 ∗) =1 2𝑯 ∗∙ 𝑴 𝒊+ 1 2𝑬 ∙ 𝑱𝒊 ∗+1 2𝜎|𝑬| 𝟐+ 𝑗2𝜔 (1 4𝜇|𝑯| 𝟐−1 4𝜀|𝑬| 𝟐) (3)
Stating that within the volume V bounded by surface S, the supplied power 𝑃𝑠 (4), is equal to the power 𝑃𝑒 existing in S plus the power 𝑃𝑎𝑏𝑠 absorbed within that volume plus the electric (𝑊𝑒) and magnetic (𝑊𝑠) energies stored within that same volume.
𝑃𝑠 = 𝑃𝑒 + 𝑃𝑎𝑏𝑠+ 𝑗2𝜔(𝑊̅𝑚− 𝑊̅𝑒) (4) Where : 𝑃𝑠 = −1 2∭ (𝑯 ∗∙ 𝑴 𝒊+ 𝑬 ∙ 𝑱𝒊∗)𝑑𝑣 𝑉 = 𝑠𝑢𝑝𝑝𝑙𝑖𝑒𝑑 𝑐𝑜𝑚𝑝𝑙𝑒𝑥 𝑝𝑜𝑤𝑒𝑟 (𝑊) (5)
𝑃𝑒 = ∯ (1 2𝑬 × 𝑯 ∗) ∙ 𝑑𝑠 𝑆 = 𝑒𝑥𝑖𝑡𝑖𝑛𝑔 𝑐𝑜𝑚𝑝𝑙𝑒𝑥 𝑝𝑜𝑤𝑒𝑟 (𝑊) (6) 𝑃𝑎𝑏𝑠= 1 2∭ 𝜎|𝑬| 𝟐𝑑𝑣 𝑉 = 𝑑𝑖𝑠𝑠𝑖𝑝𝑎𝑡𝑒𝑑 𝑟𝑒𝑎𝑙 𝑝𝑜𝑤𝑒𝑟 (𝑊) (7) 𝑊̅𝑚 = ∭ 1 4𝜇|𝑯| 𝟐𝑑𝑣 𝑽 = 𝑡𝑖𝑚𝑒 − 𝑎𝑣𝑒𝑟𝑎𝑔𝑒 𝑚𝑎𝑔𝑛𝑒𝑡𝑖𝑐 𝑒𝑛𝑒𝑟𝑔𝑦 (𝐽) (8) 𝑊̅𝑒 = ∭ 1 4𝜀|𝑬| 𝟐𝑑𝑣 𝑽 = 𝑡𝑖𝑚𝑒 − 𝑎𝑣𝑒𝑟𝑎𝑔𝑒 𝑒𝑙𝑒𝑐𝑡𝑟𝑖𝑐 𝑒𝑛𝑒𝑟𝑔𝑦 (𝐽) (9)
The integrand part of 𝑃𝑒 represents the time average Poynting vector (averaged power density). 𝒫 =1
2𝑅𝑒[𝑬 × 𝑯
∗] (10)
2.1.2 Exposure metrics: Specific Absorption Rate (SAR)
In the radiofrequency domain, between 100 kHz and 6 GHz, the human exposure to an EMF is quantified through the specific absorption rate (SAR) (11) which is the ratio of the absorbed electromagnetic power by the considered tissue and the mass of the tissue.
𝑆𝐴𝑅 =𝐴𝑏𝑠𝑜𝑟𝑏𝑒𝑑 𝑝𝑜𝑤𝑒𝑟 𝑖𝑛 𝑣𝑜𝑙𝑢𝑚𝑒 𝑉
𝑚𝑎𝑠𝑠 𝑜𝑓 𝑡ℎ𝑒 𝑣𝑜𝑙𝑢𝑚𝑒 𝑉 (11)
The average SAR in volume V is the absorbed power 𝑃𝑎𝑏𝑠 (7), dividing by the mass 𝑀𝑚𝑎𝑠𝑠 in
that volume and can be expressed as in equation (12):
𝑆𝐴𝑅 = 𝑃𝑎𝑏𝑠 𝑀𝑚𝑎𝑠𝑠 = 1 2 ∭ 𝜎𝑽 |𝑬|𝟐𝑑𝑣 ∭ 𝜌𝑑𝑣𝑉 (12)
For one tissue considering ρ and σ constant in volume V, the local SAR can be defined by equation (13):
28 𝑆𝐴𝑅 = 𝑃𝑎𝑏𝑠 𝑀𝑚𝑎𝑠𝑠 = 1 2 ∭ 𝜎𝑉 |𝑬|2𝑑𝑣 ∭ 𝜌𝑑𝑣𝑉 = 1 𝑉 ∭ 𝜎|𝑬|2 2𝜌 𝑑𝑣 𝑉 = 1 𝑉 ∭ 𝑆𝐴𝑅 𝑑𝑣𝑉 =𝜎|𝑬| 2 2𝜌 (13)
According to (13), the SAR value is directly linked to the electric field strength induced in the tissue.
The scientific community uses two basic types of quantifications to monitor and control exposure to electromagnetic radiation: the whole-body SAR, which measures the average of the power absorbed by the whole body defined as the total absorbed power by the body divided by the mass of the body and the local SAR which is used when the exposure is being assessed in a more local area of the body, for example, an organ. In this case, the local SAR is the total absorbed power by that organ divided by the mass of the organ. Local SAR can be also assessed by quantifying the absorbed power by a cube of 1g (SAR1g) or 10g (SAR10g) and dividing by masses of 1 or 10 grams respectively. The whole-body SAR is usually used to evaluate far-field induced exposure (e.g induced by base stations) and local SAR to evaluate near-field induced exposure (as induced by mobile phone).
2.2. Protection limits
To protect humans from health hazards linked to EMFs, international organizations such as International Commission on Non-Ionizing Radiation Protection (ICNIRP) [3] and International Committee on Electromagnetic Safety (ICES) [7] have set a series of exposure limits. At the European level, the council recommendation 1999/519/EC [8] on the limitation of exposure of the general public to electromagnetic fields is based on ICNIRP limits which are composed of a series of fundamental limits (the basic restrictions, BRs) and derived limits (the reference levels, RLs). These basic restriction values are presented in Table 1 for the occupational and general public for whole-body and local exposure.
SAR is directly linked to the electric field induced in the tissues and cannot be measured in situ. Thus quantities that are more easily evaluated, called ‘reference levels’ RLs have been derived from the BRs to provide a more practical means of compliance verification with the guidelines [9].
Table 1, Basic restrictions for time-varying electric, magnetic and electromagnetic fields from ICNIRP 1998 guidelines [9].
Exposure Scenario Frequency Range Whole-body average SAR (W/kg) Local head/torso SAR (W/kg)
Local Limb SAR (W/kg)
Occupational 100 kHz – 6 GHz 0.4 10 20
General Public 100 kHz – 6 GHz 0.08 2 4
Averaging time of 6 minutes for local SAR. Local SAR is averaged over the mass of 10g.
RLs are expressed in electric field strength (V/m) or magnetic field strength (A/m) or power density (W/m2) and they are defined to be conservative. The latter are derived such that under
worst-case exposure conditions they will result in similar exposures to those specified by BRs. The compliance to RLs implies necessarily to respect BRs. However contrary to BRs, the RLs are frequency dependent. As further presented in Section 2.3.1.2, RL values for different frequencies are deduced from numerical simulations by taking into account the SAR variabilities in terms of different factors such as frequency bands, human morphology, age, etc. E-field, H-field, and incident plane wave power density far-field restriction levels are presented for the occupational and general public for whole-body exposure in Table 2. It should be noted that a new version of ICNIRP guidelines has been published in March 2020 [10].
30
Table 2, reference levels for whole-body exposure to time-varying far-field electric, magnetic and electromagnetic fields, from 1 MHz to 300 GHz from ICNIRP 1998 guidelines [9] Exposure Scenario Frequency Range E-field strength (V/m) H-field strength (A/m) Incident plane wave power density (𝑺𝒊𝒏𝒄) (W/m2) Occupational 1 – 10 MHz 610/f 1.6/f --- >10-400 MHz 61 0.16 10 >400-2000 MHz 3f 0.5 0.0081f 0.5 f/40 >2-300 GHz 137 0.36 50 General Public 1 – 10 MHz 87/f 0.5 0.73/f --- >10-400 MHz 28 0.073 2 >400-2000 MHz 1.375f 0.5 0.0037f 0.5 f/200 >2-300 GHz 61 0.16 10 1. f is frequency in MHz
2. For frequencies between 100 kHz and 10GHz, 𝑺𝒊𝒏𝒄, E2 and H2 are to be averaged over 6 minutes.
3. “---“ indicates that this cell is not relevant to reference levels
4. For frequencies exceeding 10GHz, 𝑺𝒊𝒏𝒄, E2 and H2 are averaged over any 68/f 1.05-min period (f in GHz)
To evaluate the exposure induced by a device or an antenna, different protocols and methods have been established based on measurement or numerical computation. Through measurements it is possible to assess the field and the induced SAR, avoiding numerical modeling uncertainties. Numerical SAR assessment is useful when performing measurement is not possible or it is very difficult, for instance, to assess the exposure in a living body.
A series of methods and protocols have been developed to perform compliance tests and actual exposure evaluation. There are two main exposure evaluation categories:
1) Exposure induced by BS antennas 2) Exposure induced by UE
The next section is dedicated to different methods for exposure assessment through experimentation and measurement.
2.3. Exposure assessment for base stations antennas
2.3.1 Numerical assessment
2.3.1.1.SAR assessment
Numerical SAR assessment requests first to model sources and the human body and after that to perform numerical assessments using methods such as the finite difference in time-domain (FDTD)[11] or multilayer approaches which are largely used over the past decade to assess the EMF absorbed by the biological tissues [12]–[15]. These computational methods are based on realistic heterogeneous body and source models. Existing body models have been developed using Magnetic Resonance Imaging (MRI), computed tomography or anatomical images. These models are represented by voxel images of thin slices of the body. Each voxel corresponds to a type of body tissue with specific dielectric properties. In this regard, a series of human body models have been developed such as Virtual Family [16], ANR (Agence National de Recherche) project Kidpocket [17] and ANR project Fetus [17]. Examples of these human models are presented in Figure 1. Dielectric properties such as permittivity and conductivity of different tissues for each frequency band are measured [18] and used to assess the absorbed EMF by these tissues.
Numerical simulations such as FDTD method could also be used to assess the exposure in the far-field zone of an antenna. However, because of the limits of computational methods, it is quite impossible (due to the lack of memory and time-consuming computations) to compute the human exposure located far from the antenna. To overcome such limits, the equivalence principle [19] [20] and the relative Huygens box can be used. In the far-field zone of the antenna, the source of exposure can be approximated as a plane wave or a sum of multiple plane waves. The numerical simulation adapted to FDTD is done by inserting a human model into a virtual box (“Huygens box”) whose dimension is slightly larger than the model’s body.
32
Figure 1, Virtual Family human models [21]
The equivalent current corresponding to the plane wave around the virtual box can be computed through the equivalence principle. By exciting these equivalent currents, it is possible to evaluate the field in the entire Huygens box. Then the exposure (SAR) value to this field can be computed by FDTD method [22].
2.3.1.2.SAR transfer function
Since SAR assessment is a complex and time-consuming matter, studies were conducted to define transfer functions, assessing the absorbed power by the human body from the incident field. A series of advanced numerical methods and phantoms were used to characterize these transfer functions in terms of variabilities of SAR [22]–[24].
Considering the human body as an antenna, the equivalent surface of the body evolves with wavelength hence the rate of the absorbed power by the human body varies in terms of frequency. Figure 2 shows the whole-body SAR values in terms of frequency for different types of human bodies for standing position. As we can see, absorbed power by the human body in 60 MHz to 100MHz frequency band is higher since the average human body size (1.5 to 1.8 m) is close to the size of a dipole having its resonance in this frequency. Consequently, the human body shows a good efficiency for absorbing EMF energy at this frequency band [22]. This
dependency of the absorbed power to frequency has been taken into account while defining reference levels (see Table 2).
Figure 2, Whole-body SAR variation in terms of frequency for different human models for standing position [22]
In order to assess the influence of children's morphology on RF exposure, several children models at different ages have been studied [22]. As it is shown in Figure 3, the absorbed power in small-sized people can be higher than in larger people. Furthermore, the absorbed power in children is higher than adults due to their body size. This is due to the fact that the absorption cross-section and body surface area are strongly correlated [25].
34
Figure 3, SAR values in terms of frequency for different ages [22]
Another parameter that highly influences the absorbed power by a human body is the polarization and angle of arrival of the incident field. Figure 4 shows the amount of received power by a human body model assessed through FDTD and Huygens box methods at 2.1 GHz frequency in the standing position for different angles of arrival [26], [27]. The highest whole-body SAR values are induced by plane wave incident to the front and back of the model, while the lowest whole-body SAR values are induced by plane-wave incident to the sides of the model. According to [26] The whole-body SAR values induced by horizontal polarization are up to 30% higher than the case with vertical polarization.
Another factor that affects the amount of absorbed power is body posture. It is shown that a change in body posture can significantly affect the way that power is absorbed [28]. Figure 5 represents the variation of SAR in terms of frequency for different posture and wave polarizations.
Figure 4, Whole-body averaged SAR for polar-wave exposure from three elevations in both V and H-polarizations and from azimuth from 0° to 360° at 2100 MHz. The
incident power is 1W/m2[26]
Figure 5, Whole-body averaged SAR for different body postures and wave polarizations (hor: horizontal polarization)[28]
2.3.1.3.Source modeling for boundary compliance
Considering base station antennas, it is important to specify methods and protocols to check the compliance to the BRs or the RLs and if needed to specify the compliance boundaries (a.k.a. safety perimeter) that guarantee a human exposure below the limits outside these areas. One of the main difficulties is that compliance boundaries are not often in the far-field zone of the antenna therefore the far-field gain approximation formula is involving errors. Hence, in order
36
to assess the exposure in these compliance boundaries, several studies have been performed to define efficient models of base station antennas in the near-field zone. The method called synthetic modeling [29] is based on modeling the radiated near field of one unit cell of the antenna array computed in the volume of interest. The near field of the full antenna is derived by superposing horizontally shifted field contributions of the unit cell. The shift corresponds to the distances between cell units. This model is particularly precise when the coupling between cell units is minimized. In this case, the model approximates accurately the radiated nearfield at about two wavelengths away from the antenna as presented in Figure 6.
Figure 6, Electric field (V/m) in the E plane, computed by the synthetic model (solid line) and the gain based model (dashed line) [29]
Other methods can be used, for instance, in [30] the field is assessed in the vicinity of a collinear array antenna in terms of waves.
2.3.2 Experimental assessment
2.3.2.1.Extrapolation and averaging methods used to assess the far-field exposure
Experimental exposure assessment in the far-field zone of an antenna is based on E-field measurement and comparison to reference levels because as explained before in-situ SAR assessment is not possible. Generally, the field measured at one point in a complex environment is affected by shadowing and fast fading because of environment reflections, obstructions and diffractions [31], [32].
Shadowing is mainly linked to the environmental obstructions which affect wave propagation such as a building or a hill that obstructs the main wave path [33]. In complex environments, reflections and refractions can also affect the energy of waves due to constructive and destructive interferences. The fast fading effect is mainly due to reflection and refraction caused by objects in a complex environment which causes strong local fluctuations. Due to fast fading, a narrowband measurement performed at one point can vary from a measurement performed a few centimeters away. Thus in order to reduce uncertainties due to fading, standardization bodies have proposed different averaging methods in time and space as in CENELEC EN 50492 [34] or IEC-62232 [35] describing a protocol to estimate the incident field over a human body cross-section. On the one hand, a spatial averaging method is performed based on [36] which consists of averaging the electric field measured in a series of points placed on a grid with a specific distance between them, to reduce the measurement uncertainty. An example of a measurement grid is presented in Figure 7. It is noted that at least three points should be measured and by increasing the number of points the measurement uncertainty reduces. On the other hand, the ICNIRP defines 6 minutes time-averaging period for measuring the RMS field.
Figure 7, Example of measurement points location for spatial averaging [36]
In the case of cellular network antennas, another parameter that can affect the BS emitted power is the traffic supported by that BS as it is shown in Figure 8. It is important to note that the time of field measurement plays an important role in the E-field assessment of a cellular antenna. To check the compliance with regulatory limits, the maximum exposure conditions have to be
38
taken into account and the measurement result might have to be extrapolated to the worst-case scenario.
The extrapolation process is based on the measurement of time-dependent channels. For instance, GSM for 2G technology is based on time division multiple access (TDMA) and the downlink signal emitted by the BS is composed of a constant power signal called BCCH (Broadcast Common Channel) and a series of channels (TRX) dedicated to transporting users data. Thus for GSM, the extrapolated process consists of the BCCH signal and multiplying by the number of transmitters TRX.
Figure 8, the variation of the emitted field by a GSM antenna during 24-hour, normalized to its mean value at 1800 MHz
UMTS for 3G is based on the wideband code division multiple access code (WCDMA). All the users connected to the same BS are served at the same time and the BS communicates with UEs through a common channel called CPICH (Common Pilot Channel). In WCDMA the number of TRX is the proportion of common channel power to the maximum power delivered by the antenna.
LTE for 4G is using orthogonal frequency division multiple access (OFDMA). In LTE technology, reference signals are transmitted periodically with a constant power. Specific LTE measurement systems enable to decode LTE signals and to measure the level of reception of these reference levels. To avoid the use of LTE decoder, an alternative solution has also been
developed based on the measurement of the broadcast channel PBCH (Physical Broadcast Channel).
In the case of 5G, the NR (New Radio) is also using orthogonal frequency division multiple access and works are ongoing in standardization bodies to elaborate an extrapolation process. The use of beam steering antennas with high variability in time and space makes it very difficult to define an extrapolation process. The signalization data can be emitted with a different radiation pattern than the traffic data.
In France, Agence National des Fréquences (ANFR) is maintaining an up-to-date protocol to ensure compliance with the regulatory limits indicated in a French decree based on the 1999 EU recommendation. A national surveillance process allows requesting for free in situ exposure assessment in the residential area and any place accessible to the public. More than 3000 measurements are perfumed every year and the measurement results are accessible online [37].
The type of environment has an important effect on exposure. Regarding outdoors, exposure is mainly affected by the number of surrounding buildings and antennas. In indoors, exposure depends on outdoor sources as well as indoor sources such as wifi and Femtocells. Because of path loss due to walls or windows glasses the received power level from outdoor BSs in an indoor area is less than outdoor areas depending on the architecture of the indoor space, materials used in walls, number of windows and doors and also in buildings the exposure can vary from floor to floor. In the case of indoor sources, their number and their positions, the structure of rooms and furniture can affect the exposure. One of the main problems in assessing exposure in indoor areas is the lack of information about the position of sources or furniture and space architecture especially in private environments [38]. These mentioned aspects provide uncertainties on the assessment of exposure, however, since people spend about 70% of their time in indoor areas the assessment of exposure in indoor areas is crucial [39].
2.3.2.2.Measurement systems
The exposure to the incident field is mainly assessed by measurements via personal dosimeters, spectrum analyzers or field meters using wideband or frequency-selective filters and antennas (see Figure 9). Regarding the exposure assessment, two types of measurement exist in terms of frequency: Broadband measurements measure a wide range of frequencies (typically from 100 kHz to 6 GHz) via a field meter and a broadband antenna and a single value is obtained for the whole frequency band. Narrowband (frequency-selective) measurements consist of a very narrow frequency band dedicated to a service or technology, using an antenna and a spectrum
40
analyzer. In the end, for each frequency band, one E-field value is obtained. These measurements determine the influence of each technology or service on the total exposure value.
In order to verify compliance of exposure to RLs through measurement, international standards such as EN 62232 [35] set minimum requirements for measurement systems and complex and quite long protocols to assess the exposure. Alternatively, in epidemiological studies [40], a series of devices called Personal ExposiMeters (PEM)[41] are used to assess the narrowband measurements on different frequency bands at the same time. Due to its lightweight and its simple user interface, PEMs can be worn by a person to assess personal exposure to RF-EMF. PEMs have a limited dynamic range (typically between 0.05 to 5 V/m) thus very high and very low values cannot be measured by these devices. Moreover, since PMEs are worn by a person, the vicinity of the ExposiMeters to the body affects the measured values by the PME.
Figure 9, E-field measurement equipment, left: wideband field meter (Narda NBM 550), middle: Selective spectrum analyzer (Narda SRM-3006), right: Exposimeter (MVG Spy)
Until now the exposure induced by sources placed far from a person has been discussed. Regarding the recent types of network antennas such as small cells and Femtocells, where the distance between the antenna and the human body is in order of a few meters, we should take into consideration the proximity of the antenna and human body. In these cases, the human body is not placed very close to the antenna so modeling the source and human body together is quite impossible. Besides, the human body is not placed in the far-field zone of the antenna where we could consider plane wave approximation. Thus the source in the intermediate distance is modeled by the spherical wave expansion (SWE) method [20], [42], [43]. Since the distance between the human body and source is far enough to neglect the coupling, we can use
the equivalence principle to assess the exposure of the human body placed at an intermediate distance of the antenna through numerical methods such as FDTD.
Figure 10, Spherical wave coefficients can be measured by MVG “Starlab” near-field measurement system [44].
2.4. Exposure assessment for user device
2.4.1 Numerical assessment
2.4.1.1.Source modeling
When the EM source is located close to the body, the human body's biological tissues are in the near-field zone of the source. Consequently, there is a strong coupling between the source and biological tissues. In order to model a near-field EM source such as mobile phones or tablets, voxel digital models of the device are used to take into account the characteristics of the real device such as the size, battery, screen, and the antenna. On this matter, in IEC 62704 [45] a series of protocols have been developed to properly model a wireless communication system taking into account the necessary complexities. An example of a modeled mobile device is presented in Figure 11 [46]. This mobile phone of dimensions 5.4 * 1.6 * 1.5 cm is modeled with a 2 mm resolution with a dipole antenna at the bottom of the model operating at 1940 MHz band.
42
Figure 11, a 3D mobile phone model [46]
The SAR value in numerical human body models can be assessed using these near-field sources under different exposure conditions. The model of the handset does not have to be entirely identical to the real models and it can be simplified depending on the objective. Generally, the handset model should be identic the real one in terms of antenna shape, the position of RF energy input, and the characteristics of the antenna such as the return loss S11.
2.4.1.2.SAR variability
Despite the existence of BRs and compliance testing procedures, several studies have been carried out to assess the exposure for different conditions. The international epidemiological studies such as Cephalo, Interphone, Cosmos, Mobi-Kids, and Geronimo [47], [48] focus on brain exposure induced as a result of vicinity of the mobile phone during a voice call to the head tissues. In these studies, human brain exposure assessment has been carried out in different situations such as cheek and tilt positions [49], [50]. In order to assess the influence of phone antenna location, several studies have been carried out [24], [51] using Virtual Family head models and several types of phone models [46] with different antenna location. The exposure induced by these mobile phones has been computed by the FDTD method and the SAR value for different areas of head and brain has been concluded. These studies conclude that the position of the antenna in mobile phones and the number of antennas highly affect the induced exposure.
In addition to the source model and the location of the antenna, the emitted power by mobile phone influences the absorbed power. Concerning compliance testing, the mobile phone is forced to emit at its maximum power but the usual power emitted by mobile phones in real situations depends on network technology, environment, the quality of channel between mobile phone and BS, and also the body loss. Since the human body is placed in the near-field zone of
the mobile antenna, important coupling occurs between the body and the antenna which results in a strongly modified antenna pattern [52] (see Figure 12). This means that in different directions, the head-antenna radiation pattern is different hence the emitted power by mobile phone varies depending on the rotation of the user’s head in relation to the base station.
Figure 12, Radiation patterns of mobile phone in free space (blue) and with human body (red and green) to characterize the effect of coupling with head [52]
2.4.2 Experimental measurement for compliance testing in laboratory
The power emitted by the device can vary highly depending on network technology, handover procedures, adopted power control algorithms, etc [4], [53], [54]. In a compliance test point of view, these variabilities should be taken into account before putting the device to the market. In this regard, several methods and protocols are established to certify the level of exposure of the user device.
SAR measurement is performed by the E-field measurement inside the head phantom (SAM) or a phantom body filled with equivalent liquid. This setup consists of a robotically positioned probe and a SAR phantom filled with a tissue-equivalent simulating liquid. The robot is controlled by a computer to move the probe into the phantom’s head while measuring the E-field (see Figure 13).
The main advantage of performing measurements is the possibility to assess the SAR value without dealing with uncertainties related to the body and source modeling. However, SAR
44
measurement becomes impossible when dealing with heterogeneous tissues because of the modification in the tissues in the vicinity of the measurement probe. To overcome this limit, in case of compliance testing, using a phantom head with an equivalent head liquid designed to overestimate the exposure and forcing the device to emit at its maximum power during the measurement can be used to apply the worst-case scenario. In this context, national research projects such as Comobio, Merodas, Adonis and Multipass granted by ANR (Agence National de la Recherche) have investigated the required measurement equipment and measurement protocols to assess the human exposure for SAR assessment.
A large number of studies carried out investigating the measurement probes, the E-field scanning systems [55], [56] and dielectric properties of human tissues [18], [57], [58]. Several studies are also dedicated to analyzing, test positions, and SAM phantom shape to guaranty that the measured SAR on phantom is always higher than the real SAR induced in head. The equivalent liquid has also been designed to guaranty a conservative assessment of SAR [59].
Figure 13, SAR measurement setup
This SAR measurement method is very time consuming and the number of configurations to be tested is increasing with the last mobile phone generation. To reduce the measurement time and facilitate the measurement procedure an improved vector-based measurement approach has been developed [60], [61]. This method uses arrays of probes instead of one single probe to assess the field in phantoms head. In this method, arrays of fixed probes are placed in a head phantom and the device under measurement which is controlled by a robot is placed near the head to perform the measurement (see Figure 14). By using this method, a full field
measurement can be performed instantaneously. Therefore it is possible to perform a large number of measurements to assess the SAR values for different configurations in a short period of time. Standardization of vector-based measurements is recently published in IEC 62209-3:2019 [62].
Figure 14, Vector-based SAR measurement setup [60]
2.5. Actual exposure assessment
As mentioned before, worst-case scenarios are used to check the compliance of the level of exposure. In this case, the exposure assessment is conservative and can lead to an overestimation of the exposure. However, the levels of exposure assessed for the purpose of compliance are not representative of the actual exposure occurred daily. Actual exposure assessment is a very useful concept because, on the one hand, the general public can understand how they are exposed in day to day life and on the other hand it is useful for epidemiological studies to verify that no health effects are caused below the exposure levels.
Considering cellular networks, the downlink exposure is linked to the amount of power density received by the human body and the uplink exposure is linked to the amount of power emitted by users’ devices. In cellular networks the downlink exposure is continuous since the BSs emits all the time however the uplink exposure is induced only when the device is being used. For both cases, the exposure depends on the posture of the person. Two main postures are considered in the assessment of uplink and downlink exposures: standing and sitting. Generally, standing posture is used to assess the exposure of a person outdoor and the sitting posture for indoor environments.
46
Several projects and studies have been conducted to characterize the actual exposure induced by different wireless communication networks such as LEXNET and AMPERE projects. In [63] a series of sensors are implemented over an urban environment and performed temporal downlink E-field measurement over one year on GSM and UMTS technologies frequency bands. As presented in Figure 15, it can be observed that the measured total downlink E-field during one day varies highly depending on the time of the day. During the night the exposure is very low however during the day the exposure is higher because of the traffic variation. The total measured E-field for one week also shows the variability of the level of exposure during different days of a week for the same reason.
BS antennas are high powered transceivers which transmit continuously. However, the value of absorbed peak density power highly depends on the distance between the person and the BS antenna. Studies have demonstrated that more than 60% of measured total downlink EMF exposure values were below 0.003 W/m2 and less than 1% above 0.095W/m2 and all the values were below recommended exposure limits [64].
Considering the uplink exposure, for the compliance testing the user equipment is forced to emit at its maximum power during measurement. However, in real networks, the emitted power by the device depends on the power control algorithms that optimize the link between BS and the device.
Figure 15, Relative total electric-field strength measured during one week (a) and one day (b)[63]
Part of studies [65], [66] have shown that in GSM networks, handover procedure (the process of transferring an ongoing call or data session from one BS to another) has a great influence on the measured mean emitted power using Test Mobile Phones (TEMS) or software-modified phones (SMP). Once the handover procedure is finished, the network starts to adapt UE's power to the minimum necessary. Statistical analysis of uplink emitted power in a GSM network shows that the UE emits about 20-50% of its maximum transmission power (2W theoretically). In the case of UMTS, the handover procedure does not affect the emitted power by UE. Studies have shown that the mean power emitted by UMTS in voice call usage was close to 1% the maximum power (0.25W theoretically) [54]. However, in both cases, the emitted power by UE depends on the path loss between UE and BS.
The emitted power by UE depends also on usage. For instance, the exposure of a person using UE in voice circuit mode is linked to the mean power emitted by UE during the call duration, however, in data usage mode, the emitted power and the duration of power emission depends on throughput. As a result, it depends on available uplink resources and interferences. In LTE the emitted power by UE depends also on the number allocated uplink resources block to the UE.
48
Figure 16, The influence of handover on transmitted power for GSM (up) and WCDMA (down) In voice call mode. Instantaneous power (filled curve) and handover (dots)
2.6. Global Exposure
2.6.1 Relation between RX and TX
Studies have shown that when the received signal from the base station is higher, the emitted power by UE is lower and vice versa [54]. In 3G, due to its fast and efficient power adaptation algorithms, the emitted power depends highly on the received power from the BS and it varies from -60dBm to 23 dBm. In 2G, the same effect has been observed, however, because of the maximum emission during handover, less efficient power adaptation procedure and the limited power emission dynamic range in GSM [4] the negative correlation between the revived power density and the emitted power by UE is less obvious (see Figure 17).
Figure 17, the measured received power by UE in terms of uplink emitted power in GSM (blue curve), DCS (light blue) and UMTS (red), vertical lines represent the
standard deviation and the horizontal line the average RX [4]
LTE uses a very efficient power control algorithm (see Section 3.5). This power control algorithm depends on a series of parameters including the path loss between UE and BS measured by UE. Briefly, if the path loss between BS and UE is higher which means that the received power density by UE is lower, the emitted power by UE will be higher to compensate for the path loss. The correlation between TX and RX can be observed in Figure 18.
This strong correlation between the emitted power and the received power density by UE drives us to conclude that in case of actual exposure, the uplink and downlink exposure should not be assessed separately. Furthermore, the global exposure of a person induced by cellular networks is a combination of exposure induced by user’s devices and the exposure induced by the BSs.
![Table 2, reference levels for whole-body exposure to time-varying far-field electric, magnetic and electromagnetic fields, from 1 MHz to 300 GHz from ICNIRP 1998 guidelines [9] Exposure Scenario Frequency Range E-field strength](https://thumb-eu.123doks.com/thumbv2/123doknet/8276443.278698/31.892.96.780.209.816/reference-exposure-electric-electromagnetic-guidelines-exposure-scenario-frequency.webp)