HAL Id: hal-01004959
https://hal.archives-ouvertes.fr/hal-01004959
Submitted on 13 Jun 2019
HAL is a multi-disciplinary open access
archive for the deposit and dissemination of
sci-entific research documents, whether they are
pub-lished or not. The documents may come from
teaching and research institutions in France or
abroad, or from public or private research centers.
L’archive ouverte pluridisciplinaire HAL, est
destinée au dépôt et à la diffusion de documents
scientifiques de niveau recherche, publiés ou non,
émanant des établissements d’enseignement et de
recherche français ou étrangers, des laboratoires
publics ou privés.
A two-scale model predicting the mechanical behavior of
nanocrystalline solids
V. Peron-Luhrs, A. Jerusalem, F. Sansoz, Laurent Stainier, Ludovic Noels
To cite this version:
V. Peron-Luhrs, A. Jerusalem, F. Sansoz, Laurent Stainier, Ludovic Noels. A two-scale model
pre-dicting the mechanical behavior of nanocrystalline solids. Journal of the Mechanics and Physics of
Solids, Elsevier, 2013, 61 (9), pp.1895-1914. �10.1016/j.jmps.2013.04.009�. �hal-01004959�
A two-scale model predicting the mechanical behavior
of nanocrystalline solids
V.
Péron-Lührs
a,
A. Jérusalem
b,
F. Sansoz
c,
L. Stainier
d,
L. Noels
aaUniversity of Liege, Department of Aerospace & Mechanical Engineering - Computational & Multiscale Mechanics of Materials, ULg, B52, Chemin Des Chevreuils 1, B4000 Liége, Belgium
bDepartment of Engineering Science, Parks Road, University of Oxford, OX1 3PJ, UK cSchool of Engineering and Materials Science Program, University of Vermont, Burlington, USA
dInstitut de Recherche en Génie Civil et Mécanique (GeM, UMR 6183 CNRS), Ecole Centrale de Nantes, Nantes, France
Keywords: Nanocrystal
Grain boundary deformation Crystal plasticity
Quasicontinuum method Finite element method
Polycrystalline materials, with nanosized grains (o 100 nm), exhibit superior strength exceeding those of their coarse-grained counterparts. With such small grains, the deformation mechanisms taking place at grain boundaries (GBs) become dominant compared to the intragranular crystal plasticity. Recent studies have revealed that the deformation mechanisms are influenced by the GB network. For instance, a high yield stress in nanostructured metals can be obtained by choosing the relevant grain boundary character distribution (GBCD). In this paper we present an original numerical multiscale approach to predict the mechanical behavior of nanostructured metals according to their GBCD composed of either high angle (HA) GBs (HAB) or low angle (LA) GBs (LAB). Molecular simulations using the quasicontinuum method (QC) are performed to obtain the mechanical response at the nanoscale of GB undergoing simple shear (GB sliding behavior) and tensile loads (GB opening behavior). To simulate the grain behavior, a mechanical model of dislocation motions through a forest dislocation is calibrated using a nanoindentation simulation performed with QC. These QC results are then used in a finite element code (direct numerical simulation-DNS) as a GB constitutive model and as a grain constitutive model. This two-scale framework does not suffer from length scale limita-tions conventionally encountered when considering the two scales separately.
1. Introduction
The determination of the mechanical properties (e.g. materials strength, ductility, etc.) of nanocrystalline (nc) materials requires a detailed understanding of the associated deformation processes at the atomic scale. A material is generally considered to be nc if its mean grain size is smaller than ≈ 100 nm in at least one dimension (Gleiter, 1999). This class of materials behaves differently from their coarse-grained counterparts (Fougere et al., 1995;Gleiter, 1889). More specifically, their attractive advantageous mechanical and electrical properties (Kumar et al., 2003;Youngdahl et al., 1997;Agnew et al., 2000;Van Swygenhoven, 2002;Van Swygenhoven and Weertman, 2003;Jacobsen and Schiøtz, 2002;Schiøtz and Jacobsen, 2003) have received increasing attention in the scientific community in the last years. In particular, past experimental studies have focused on the influence of the grain boundary (GB) character distribution (GBCD) on the mechanical behavior
of nc materials. Severe plastic deformations (SPD) or electrodeposition processes, for examples, both enabling the presence of high-angle boundaries (HAB) and/or low-angle boundaries (LAB) (Valiev and Alexandrov, 2002;Erb et al., 1993), induce residual micro strains emergence in GBs depending on their misorientations (Lu et al., 2000), and are potentially responsible for the differentiated ductility of nc metals (Bringa et al., 2005). By carefully choosing the conditions that minimize the appearance of micro strains and by ensuring that a high proportion of low-angle boundaries is present,Lu et al. (2000)and
Dao et al. (2006)have shown that ductility of nc metals can be effectively improved. However, a predictive understanding remains elusive.
Special boundaries (Crawford and Was, 1992;Pan et al., 1996;Gertsman and Bruemmer, 2001;Alexandreanu et al., 2001;
King et al., 2008; Arafin and Szpunar, 2009) are, by definition, primarily of two classes: LAB and coincident site lattice boundaries (CSL). LAB are generally considered to have a misorientation angle lower than 101 (Sailor et al., 2000;Brewer et al., 2006), or between 9 and 141 (Shigematsu et al., 2006). The CSL type nomenclature is represented by sigma (Σ) followed by the reciprocal density of coincident atoms in the GB interface. It has been shown that the CSL boundaries having a special character are the only ones commonly termed as low-Σ boundaries while the remaining ones behave like the random HAB (Gertsman and Bruemmer, 2001;Lin and Pope, 1993). Moreover, some Σ boundaries in one material could possess completely different characteristics than in other materials. They may thus be considered to be material dependent. It is worth noting that a higher-Σ does not necessarily indicate poorer properties (Tsurekawa et al., 1994). In the present study, all misorientations lower than 91 will be considered as being LAB.
It is also well known that plastic deformations are commonly considered to change from intragranular to intergranular when the grain size is decreased below a given threshold (Jérusalem et al., 2007). In the past, molecular dynamics simulations (MD) have revealed unusual mechanisms at low temperatures, such as GB sliding and intragranular slip involving dislocation emissions and absorptions at GBs (Kumar et al., 2003;Van Swygenhoven et al., 2004;Wolf et al., 2005;
Sansoz and Dupont, 2006;Dupont and Sansoz, 2008;Sansoz and Stevenson, 2011). The essence of these slip mechanisms remains controversial (Van Swygenhoven et al., 2004) and it is assumed that the slip rate depends on both the grain size and the GB type involved (Van Swygenhoven et al., 1999). MD simulations have been particularly effective in highlighting the basic deformation mechanisms in nanostructured materials but suffer from the requirement to consider the dynamics of all atoms one by one, which imposes drastic limitations on the size of the sample simulated.
On the other hand, there have been efforts to describe deformation and failure mechanisms in nc metals using continuum models. Additional information in this area has been presented byMeyers et al. (2006). Continuum modeling approaches include the development of mixed-phase constitutive models considering the grain interior and boundary processes in a homogenized way (Kim et al., 2000; Fu et al., 2001), the explicit consideration of the GBs as a continuum region with different properties (Schwaiger et al., 2003;Wei et al., 2006) or the use of interface elements in the finite element mesh (Wei and Anand, 2004;Warner et al., 2006). These studies have been limited to two-dimensional analyzes focused on the ability of the continuum approach to describe the grain size dependency (Wei et al., 2006;Warner et al., 2006), the strain localization (Fu et al., 2004;Warner et al., 2006) and the failure process (Wei et al., 2006;Wei and Anand, 2004).
An attempt to determine the effective response of nc materials has been previously proposed byJérusalem et al., (2007). This approach was based on a finite element formulation of the continuum three-dimensional problem describing the deformation of polycrystal grains explicitly, and on the consideration of GBs as surfaces of discontinuities with a finite thickness embedded in the continuum. However, a unique arbitrary constitutive law was used to characterize all the GBs, despite the different behaviors described above, due to the lack of data available. Because of this, judicious distributions of properties in GBs based on statistics have been used to describe the mechanical behavior of GBs in polycrystalline materials (Kraft et al., 2008). As a consequence, the GB mechanical behavior description networks have been mainly studied through arbitrary or statistical techniques. A finer and more accurate description appears as a necessary step for an increased understanding of nanocrystalline materials deformation mechanisms.
The main objective of this paper is thus to predict polycrystalline solid's mechanical behaviors through a more accurate description of its GB network and of its grain texture by taking into account the specific orientations of the grains and GBs, including the grain size. To achieve this end, we conduct a two-scale study aiming at predicting the mechanical behavior of nc copper through a polycrystalline representative volume element (RVE) possessing both a specific GB network and a specific grain texture. First, we begin at the atomistic scale by using the quasicontinuum method (QC) developed by Tadmor and co-workers (Shenoy et al., 1999;Miller and Tadmor, 2002). Specific mechanical behaviors of GBs (sliding and opening or decohesion) are characterized through simple shear loads and tensile loads following the work of Sansoz and Molinari (2004,2005), so that the GB network crystallographic orientation is explicitly taken into account. Then, at the grain level, the critical resolved shear stress (CRSS) of each fcc slip system is determined by means of nanoindentation tests with QC. The size effect associated to the CRSS is captured by adding a GB in the vicinity of the indenter and by varying the distance GB-indented surface. At the mesoscopic scale, we introduce these atomistic laws in a finite element code (Jérusalem et al., 2007;Cuitiño and Ortiz, 1993). On the one hand the GB behavior is modeled using adequate interface elements, and on the other hand, we adopt the explicit formulation described byKuchnicki et al. (2006)for the intragranular fcc polycrystal plasticity constitutive model. In this framework, each grain is discretized with a fine mesh and its constitutive response is described with a forest dislocation-based hardening model. Consequently this allows for a prediction of the evolution of the texture to be captured.
To illustrate the ability of the method to capture the competition between intragranular and intergranular plastic deformations in nc metals, quasi-static tensile tests are then performed for two cases: nc copper with a 94% HAB texture,
and nc copper with a full LAB texture. Besides the fact that the polycrystalline aggregates have been found to behave differently depending on the texture (e.g. higher yield stress for LAB texture, presence/absence of competition between intragranular and intergranular plasticity, etc.), this two-scale method captures the reverse Hall-Petch effect in nc metals. Additionally, the method used here does not suffer from the length scales limitations encountered in MD frameworks, and could be used for larger representative elements whose mechanical behavior prediction remains unreachable today.
The overall computational framework is presented inSection 2 and the main results are followed by a discussion in
Section 3. Finally,Section 4intends to conclude this argument. 2. Computational method
2.1. Continuum formulation
In this section we expose first the governing equations and kinematic assumptions of the continuum with embedded GBs, following the study of Jérusalem et al. (2007). In particular the presence of embedded GB is accounted for by an adequate discretization (seeFig. 1c), and the governing laws of the GBs are described. Finally, the governing equations in the bulk material, based on model developed byKuchnicki et al. (2006),Zhao et al. (2007),Cuitiño and Ortiz (1993)are exposed. 2.1.1. Governing equations of the continuum model with embedded GBs
We assume that the kinematics of the deformation mechanisms taking place at the GBs can be described as surfaces of discontinuities embedded in a continuum medium. To this end, we use the continuum framework presented byOrtiz and Pandolfi (1999)that we summarize here. The polycrystalline aggregate initially occupies a region B0¼ ⋃gBg0⊂R3, where Bg0is
the region occupied by the grain g. The body undergoes a motion φ : B0" ½0; t$-R3, where [0, t] is the time interval
considered. In the continuous regions of the polycrystal, i.e., the grain interiors, local information about the material deformation is conveyed by the deformation gradient field ϵ, whereas the local stress state is described by the Cauchy stress tensor r.Fig. 1c shows a representative intergranular boundary surface ∂Bg
0, whose unit normal is N , including the externally
exposed ∂Bext
0 (if any) as well as the intergranular ∂Bgb0 portions of the grain boundary, i.e., ∂Bg0¼ ∂Bext0 ∪∂Bgb0. Regarding the
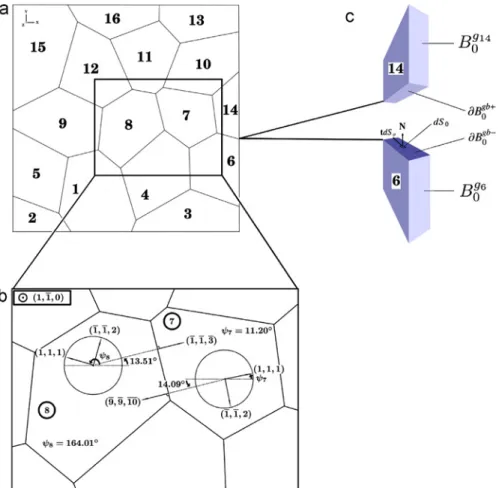
Fig. 1. (a) Numbering of the nc grains. (b) Illustration of the orientation approach to reconstruct nc GBCD. (c) Schematics of the geometric model of nc as a continuum with surfaces of discontinuities at GBs.
bulk part of the material description, we consider a body B0subjected to a force per unit mass b. Its boundary surface ∂B0is
partitioned into a Dirichlet contribution ∂DB0constrained by displacements φ and a Neumann contribution ∂NB0subjected
to surface tractions t . One always has ∂B0¼ ∂NB0∪∂DB0 and ∂NB0∩∂DB0¼ ∅. The momentum equation and boundary
conditions read
∇ % rTþ ρb ¼ ρ €φ in B ð1Þ
φ ¼ φ on ∂DB ð2Þ
r% n ¼ t on ∂NB ð3Þ
In these relations ρ is the current density, n is the unit surface normal in the current configuration and B is the body in the current configuration. It is important to note that we do not distinguish between N and n nor between B0and B under the
assumption of small deformations. The strong form(1)of the linear momentum balance is enforced in a weighted-average sense by being multiplied by a suitable test function δφ and integrated in the domain. However, since both test and trial functions are discontinuous due to the presence of GBs, the integration by parts is not performed over the whole domain, but on each element instead, leading to
∑ g Z Bg 0 ð∇ % rTÞ % δφ dV þ ∑ g Z Bg 0 ρb % δφ dV ¼ ∑ g Z Bg 0 ρ €φ % δφ dV ð4Þ
which can be rewritten as ∑ g− Z Bg 0 r: ð∇δφÞ dV þ ∑ gb 7 Z ∂Bgb 0 δφ % r % n dS þZ ∂NB0 δφ % r % n dS þ ∑ g Z Bg 0 ρb % δφ dV ¼ ∑ g Z Bg 0 ρ0φ % δφ dV€ ð5Þ
The 7 sign indicates that the surface integral has to be computed on both sides of the GBs. Finally, by using Eq.(3)
∑ g Z Bg 0 ρ €φ % δφ dV þ ∑ g Z Bg 0 r: ð∇δφÞ dV ¼ ∑ g Z Bg 0 ρ0b % δφ dV þ Z ∂NB0 t % δφn dS þ ∑ gb 7 Z ∂Bgb 7 0 δφ % r % n dS |fflfflfflfflfflfflfflfflfflfflfflfflfflfflfflfflfflfflfflffl{zfflfflfflfflfflfflfflfflfflfflfflfflfflfflfflfflfflfflfflffl} ∑gbR∂Bgb 0ðr % n|fflffl{zfflffl}Þ t %1δφU dS ð6Þ
This equation shows that, in this polycrystal modeling framework, the deformation power encompasses the contributions of the internal stresses inside each grain, as in conventional continuous solids, as well as those of the intergranular tractions, which are work-conjugated to the displacement jumps 1φU describing the deformation mechanisms at the GBs. The material models required to evaluate the Cauchy stress tensor r in the bulk as well as the surface traction t are defined below. In the last term of Eq. (6), the surface traction is computed on the "+" side of the GBs.
2.1.2. Grain boundary constitutive model
We define the mean deformation mapping as set byOrtiz and Pandolfi (1999)
~ φ ¼1
2ðφþþ φ−Þ ð7Þ
from which the original deformation mapping on both sides of the GB can be recovered as φ7¼ ~φ 71
2ðφþ−φ−Þ ¼ ~φ 712δ ð8Þ
where
δ ¼ 1φU ¼ φþ−φ− ð9Þ
Consequently, the deformed GB is defined as S≡ ~φðS0Þ. Starting from a parametrization ~φ ¼ ~φðxαÞ; α ¼ 1; 2, of S, it follows
that the initial surface normal N can be obtained directly from the covariant basis vectors aα¼ ~φ0;αas
N ¼ a1" a2
∥a1" a2∥ ð10Þ
The displacement jumps may then be decomposed into an opening separation vector and into a GB sliding vector, respectively as follows:
δn¼ ðδ % N ÞN ¼ ðN ⊗N Þ % δ ð11Þ
These kinematic assumptions lead to a constant state of deformations across the thickness h of the GB, which can be expressed in the local orthonormal reference frame ðN1; N2; N3Þ ¼ ðða1=ja1jÞ; ðN " a1=jN " a1jÞ; N Þ as
ϵ ¼δn% N3 h N3⊗N3 |fflfflfflfflfflfflfflfflfflfflfflffl{zfflfflfflfflfflfflfflfflfflfflfflffl} ϵn þδs% N1 h 1 2 ðN1⊗N3þ N3⊗N1Þ þ δs% N2 h 1 2 ðN2⊗N3þ N3⊗N2Þ |fflfflfflfflfflfflfflfflfflfflfflfflfflfflfflfflfflfflfflfflfflfflfflfflfflfflfflfflfflfflfflfflfflfflfflfflfflfflfflfflfflfflfflfflfflfflfflfflfflfflfflfflfflfflfflfflfflfflffl{zfflfflfflfflfflfflfflfflfflfflfflfflfflfflfflfflfflfflfflfflfflfflfflfflfflfflfflfflfflfflfflfflfflfflfflfflfflfflfflfflfflfflfflfflfflfflfflfflfflfflfflfflfflfflfflfflfflfflffl} ϵs ð13Þ
The expression(13)also shows that the strain tensor additively decomposes in a sliding part ϵs and a normal opening
part ϵn. It should be noted that h introduces a characteristic length scale in the model. Values ranging from 0.5 to 1 nm, or
about 2 to 5 atomic widths, are frequently chosen (Thomas et al., 1990; Kung et al., 1999). In our model, the GB width h¼1 nm is selected.
Finally the traction is expressed as follows:
t ¼ hr :∂ϵ∂δ ð14Þ
that can be simplified by using Eq.(13)as proposed byJérusalem et al. (2007)into
t ¼ r % N3 ð15Þ
As opposed to the work ofJérusalem et al. (2007), we assumed here that only the sliding component undergoes plastic deformation. However, in a more realistic way, the GB opening mechanical behavior now includes damage mechanisms (through a damage parameter D) but remains elastic. The sliding part rslof the effective stress tensor is computed from ϵ
s
using the elasto-plastic model characterized by: sp¼ s0 1 þϵϵp
0
" #1=M
ð16Þ
where spis the yield stress corresponding to the equivalent plastic strain ϵp, s0is the initial yield stress, and where M and ϵ0
are parameters of the model. The opening part ropof the effective stress tensor is computed from ϵ
n using a simple elastic
model. Then, the damage parameter D is evaluated from the normal opening δn% N . When this opening remains relatively
small, the opening stress ropremains smaller in norm than the critical stress s
cand D¼0. Once scis reached, D increases in
an irreversible way, and eventually reaches 1 for a critical opening δc. Finally the stress tensor is directly computed from
r¼ ð1−DÞðrslþ ropÞ ð17Þ
2.1.3. Governing equations in bulk
We adopt the explicit formulation described byKuchnicki et al. (2006)for a fcc polycrystal plasticity constitutive model. This formulation improves the original implicit formulation of the forest dislocation hardening model proposed inCuitiño and Ortiz (1993), enabling large scale computations. A summary of this formulation was proposed byZhao et al. (2007). We provide here the main assumptions of the model and highlight the relevant parameters calibrated with the QC method by nanoindentation tests. Note that the forest hardening mechanism and the evolution of the dislocation density is more appropriate for a metal with grain sizes larger than the ones considered in this paper. However, as it will be shown, for small grain sizes the mechanical response is dominated by plastic GB sliding, justifying this approximation for the crystal plasticity model (Jérusalem et al., 2008).
In this framework the following power-law is used to describe the shear rate deformation of the slip system α _γα¼ _γ0 τ α gα $ %1=m −1 & ' if τα≥0 0 otherwise 8 < : ð18Þ
where _γ0is the reference shear strain rate, m is the strain-rate sensitivity exponent, gαand ταare the CRSS and the resolved
shear stress on the slip system α, respectively. Based on statistical mechanics, the evolution of the flow stresses in the case of multiple slip systems is found to be governed by a diagonal hardening law
_ gα ¼ ∑ gh αα _γα ð19Þ
where hαα are the diagonal hardening moduli
hαα ¼ τ α c γα c " # gα τα c " #3 cosh ταc gα " #2 " # −1 ( ) ðno sum on αÞ ð20Þ where τα
cand γαc, the characteristic shear stress and strain for the slip system α, respectively, are given by
τα
c¼ rμbpffiffiffiffiffiffiffiffiπnα and γαc¼
bρα
In these expressions, for each slip system α, nαis the density of obstacle, ραthe dislocation density, b the Burgers vector, μ
the shear modulus and r a numerical coefficient equal to 0.3 that modulates the strength of an obstacle in a slip plane α given by a pair of forest dislocations separated by a distance l. This strength can be evaluated as follows:
sα
¼ rμbl ð22Þ
We also provide the evolution equations for ραand nα. Intuitively, we guess that nαdepends on the dislocation densities of
all the systems. According toFranciosi and Zaoui (1982,1983); Franciosi (1985,1988), this dependency takes the following form:
nα¼ ∑ α
aαβρβ ð23Þ
The interaction matrix aαβ has been determined experimentally byFranciosi and Zaoui (1982)for 12 slip systems (planes
{111}, directions [110]) in fcc crystals. In this last reference, interactions between dislocations are classified according to whether they belong to the same system (coefficient a0), fail to form junctions or form Hirth locks or co-planar junctions
(coefficient a1), glissile junctions (coefficient a2), or sessile Lomer–Cottrell locks (coefficient a3), with a0≤a1≤a2≤a3.
Finally, the evolution of ραcan be expressed analytically by
ρα¼ ρ sat 1− 1−ρρ0 sat " # e−γα=γ sat & ' ð24Þ
where ρsatis the saturation dislocation density and γsat the saturation shear slip.
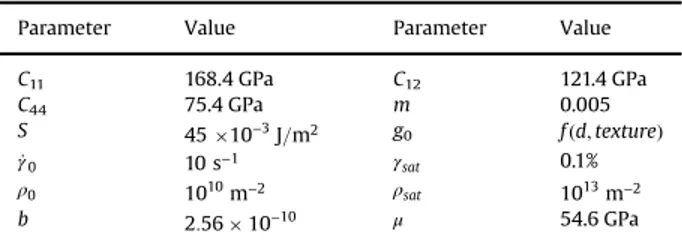
Table 1provides the constitutive model parameters used in our simulations for pure copper. The remaining parameter, g0, is the initial value for gα, and depends on the grain diameter d and on the texture type (HA or LA) considered. In this
paper, this key value is calibrated from nanoindentation QC simulations in the following. C11, C12and C44are the elastic
constants of the anisotropic model. 2.2. Quasicontinuum method simulations
Three categories of QC simulations are considered here: GB sliding, GB decohesion and interaction dislocation-GB. These simulations will be used to calibrate the models described inSection 2.1. Instead of assigning a unique arbitrary constitutive GB law that is independent of the crystal misorientation, as assumed byJérusalem et al. (2007),Warner et al. (2006), the shearing and decohesion behaviors of each GB are characterized here according to its structure using QC simulations of tilt bicrystals undergoing simple shear and tensile loads, respectively. The QC method was developed byShenoy et al. (1999),
Miller and Tadmor (2002),Tadmor et al. (1996)and is used here to simulate the GB behavior in shear and tension through Molecular Statics (MS) using an energy minimization scheme. The crystalline regions are treated as a continuum medium by the finite element method, while at the interface, a full resolution is kept by modeling all atoms. In this scheme, the connection between continuum and full atomistic scales is made in a seamless manner, i.e., there is no discontinuity in the energy state at the continuum/atomistic frontier (seeFig. 2).
FollowingSansoz and Molinari (2004,2005), the Embedded-Atom Method (EAM) potential provided byFoiles et al. (1986)for nc copper was used. A summary of the EAM potential characteristics was presented by inDaw et al. (1992).
The QC method software used in the present study (available onwww.qcmethod.com) was limited to 2D problems at 0 K. Every calculation was performed by a projection of the 3D crystallography orientations along the GB tilt axis. It is worth noting that only tilt boundaries have been used here because the QC software used was limited to 2D problems. This is consistent with nc materials with columnar grains such as in textured thin films and coating that should only be made of tilt GBs with random in-plane orientations. Further, even if fully 3D structures like ECAP nc metals do not only contain tilt GBs, it was demonstrated byRandle et al. (2008)that a large number of tilt GBs is statistically present anyway, in addition to more general GBs. However, the results of a previous work (Bringa et al., 2006), where a GB network resulting from Voronoï construction and random orientations, differ significantly from the one obtained with full tilt boundaries network ofWarner et al. (2006). Nevertheless, the 2-scale method developed in the present study, limited by the 2D nature of QC, can be adapted to 3D by using QC 3D. This adaptation in 3D should allow for a better understanding of the different behaviors of structures composed either of tilt or random orientations boundaries.
Table 1
Constitutive model parameters for pure copper.
Parameter Value Parameter Value C11 168.4 GPa C12 121.4 GPa C44 75.4 GPa m 0.005 S 45 "10−3J=m2 g0 f ðd; textureÞ _γ0 10 s−1 γsat 0.1% ρ0 1010m−2 ρsat 1013m−2 b 2:56 " 10−10 μ 54.6 GPa
2.2.1. GB simulations
Problem description: the mechanical response of GBs at the nanoscale, and particularly the maximum boundary strength, is strongly dependent upon the size of the computational cell under applied loading, especially for shear loading. This is due to the fact that boundary constraints play an important role on the deformation mechanisms triggered at the interface. Depending on the number of crystal lattice planes parallel to the GB, the loss of boundary strength can be accompanied by a change of the deformation mechanism ranging from quasi-cleavage fracture to GB atom shuffling process and, subsequently, to atom shuffling plus bulk crystal plasticity in the form of partial dislocations emitted from the GB (Sansoz and Molinari, 2005). In the present QC simulations, however, we ensure a GB atom shuffling-only regime by keeping a number of free atom planes near the GB between 7 and 12. Using more planes could enrich the model to dislocation emissions, but it would not improve the results of the mesoscopic studies (continuum) as shuffling at GBs always occurs before dislocation emissions during the QC simulations, thus not modifying the critical stress measured and used later in the mesoscopic simulations.
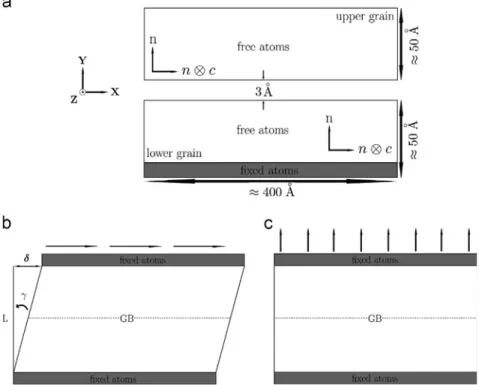
Atoms near the GB region were all represented within a distance from the GB plane equal to 7.5 times the potential cutoff distance 4.950 Å (at 0 K). A typical simulation was performed with less than 8000 nodes. The coincident site lattice (CSL) model and the Bravais lattice cell were used to construct each bicrystal. In the present version of the QC method, the box calculation has to be quasi-planar with only one repeated CSL along the tilt vector c (seeFig. 3). All GBs present in the microstructure, as simulated later in 3D, were tilt GBs with the same out of plane direction (c ¼ ½110$) for both HA or LA cases. The normal to the GB plane is noted n inFig. 3. The CSL cell was then periodically reproduced along the n and n⊗c directions. The size of each grain was kept between 50 and 70 Å. The mesh aspect ratio δX=δY of each bicrystal was close to 4 for each simulation and the minimum dimensions of the whole cell were 400 " 100 " 2.55619 Å (for δX " δY " δZ). We introduced a spacing on the order of 3 Å between the upper grain and the lower grain along the n-axis before relaxing the structure without applying any stress. This relaxation step enabled a GB volume expansion and a translation at the grain interface. The energy of the structure was minimized using a conjugate-gradient method until the out-of-balance forces were found to be lower than 10−3eV=Å. By using this computational technique, it is possible to obtain metastable structures. Therefore, all structures were tested by shifting the grains according to the displacement-shift-complete lattice (Brokman and Balluffi, 1981). Only GB configurations with the lowest energies were conserved. For fcc metals, this technique is in good agreement with similar simulations using the MD method (Rittner and Seidman, 1996;Farkas, 2000;De Koning et al., 2003). GB sliding: a simple homogeneous shear test was performed by straining the relaxed bicrystal in a series of incremental shear displacements, applied on the top line of atoms in the upper grain along the n⊗c direction. In the bottom line of the lower grain, all atoms were fixed in all directions in order to avoid crystal rotation (seeFig. 3b). The atoms on the left side and on the right side of the bicrystal were free of constraints. At every time step, the incremental strain was lower than 0.15% before a new energy minimization was accomplished. The displacement of all atoms was constrained along the tilt direction c. The shear strain γ is thus given by
γ ¼ arctan δL " #
ð25Þ
where δ is the imposed shear displacement and where L is the size of the unconstrained atomistic region. The GB energy was obtained by subtracting the bulk single crystal energy to the bicrystal energy and dividing the result by the GB area. Only 80% of the bicrystal was considered in the calculation in order to avoid free surface effects as suggested in earlier studies (Sansoz and Molinari, 2004). In this reference, it has been demonstrated that this approximation on the average stress calculation is in excellent agreement with MD studies of single crystals, which is also true for GB structures (Spearot et al., 2004). Note that at the mesoscopic scale of the model, the decohesion of GBs starts at triple junctions, where stress concentrations occur, and it has been assumed herein that GB sliding and GB decohesion are governed by the same mechanical laws far and near these triple junctions. Nevertheless, in our QC model, edge atoms were excluded from the Fig. 2. Quasicontinuum model of GB10−7in the HA texture. The continuum and the atomistic regions are indicated. The crystals orientations and GB position after relaxation are also shown. Atoms appearing in dark color present a perfect fcc stacking. Bright-colored atoms correspond to crystal defects.
force and energy calculations in the bicrystals, and thus the critical stresses for sliding and decohesion at GBs do not take into account the edge effects. However, this does not affect the accuracy of our model as it is reasonable to assume that the mesoscopic response is mainly governed by the GB sliding happening far away from these peculiar junctions, justifying our approach.
Results of the GB sliding simulations are provided inSection 3.1.
GB opening: the decohesion constitutive mechanical behavior is calibrated through tensile loads on a bicrystal with the boundary conditions represented inFig. 3c. In this set of simulations, the side atoms are fixed in the direction parallel to the GB. This last assumption coupled with the 2D nature of the modeling provides a good agreement with 3D molecular dynamic simulations applying periodic boundaries. The QC computational method applied to tensile loads was proposed by
Sansoz and Molinari (2004). These simulations allow for the critical stress scand the strain to failure δcof each GB to be
determined.
2.2.2. Interaction dislocation-GB: nanoindentation tests
Problem description: the yield and hardening behaviors of solids have been identified as being strongly dependent upon the interaction of dislocation motions with GBs. For instance, the well-known Hall–Petch (Hall, 1951) relationship which relates the yield stress to the grain size can be explained using a pile-up model if we assume that dislocations are stopped at the GBs (Hirth and Lothe, 1968). In their studiesShenoy et al., 1999;Tadmor et al., 1999have illustrated how the QC method can be used to build realistic models of the interaction of lattice dislocations with GBs by nanoindentation. For special GBs, they confirmed that a pile-up indeed occurs and that no-slip transmission takes place across the boundary.
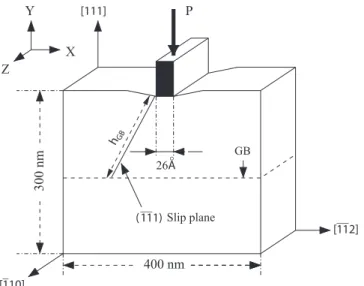
In the present part of this study, the aim is to relate the CRSS to the size of the grain and to the GB nature (HAB or LAB). We choose here to follow the approach presented byShenoy et al. (1999),Tadmor et al. (1999)and propose to depart from this study by varying the distance hGB, seeFig. 4, separating the indented surface from the GB. We can then obtain different
values of the CRSS for different pseudo grain sizes.
The indenter was a rigid rectangular block 26Å wide and was driven into a thin copper film. As in the GB simulations presented above, the EAM potential provided byFoiles et al. (1986)for nc copper was used. No significant discrepancies have been observed with the EAM potential for copper provided byMendelev et al. (2008), as shown later. The indenter geometry was modeled as a displacement boundary condition applied to the surface atoms lying beneath it. The substrate was modeled as a rigid surface allowing no displacements. The top surface was left free. Between the indenter and the crystal, both friction free and perfect stick conditions were applied. In practice, boundary conditions do not influence the results (Tadmor et al., 1999). The film was oriented so that the preferred slip system was f111g〈112〉 in order to facilitate partial dislocation nucleation, see Fig. 4, as proposed by Tadmor et al. (1999). In this way, the maximum value of the component of the stress tensor corresponding to the propagation direction 〈112〉, i.e., sf111g〈112〉, is also the resolved shear stress on the active slip system that controls dislocation emissions, as discussed byTadmor et al. (1999). Thus we assume
that a significant criterion (CRSS) controlling the dislocation emission is provided by the nanoindentation simulation. When this criterion is reached, the dislocation is emitted in the bulk. We propose to add an obstacle (GB) in the bulk, in the propagation direction, in order to evaluate its influence on this last criterion. If this obstacle is sufficiently far from the emission zone, the criterion is expected to be constant. In that case, the dislocation propagates into the bulk and this will continue until it is stopped by lattice friction, and, at the equilibrium depth, the force on the dislocation will be balanced by the lattice friction force. In contrast, if the distance to the obstacle is lower than this last equilibrium depth, the lattice friction value will change and the criterion is expected to be influenced. In this framework, for a given grain size, the CRSS needed to nucleate a dislocation from one of its GBs (indented surface) is assumed to be dependent upon the obstacle (GB on the other side of the assumed circular grain) encountered in the propagation direction. Moreover, the criterion is expected to behave differently depending on the obstacle nature (HAB or LAB) encountered during emission.
As for the GB simulations, we introduced a spacing of 3 Å between the upper grain and the lower grain before relaxing the structure without applying any stress. The energy of the structure was minimized using a conjugate-gradient method until the out-of-balance forces are lower than 10−6eV=Å. All structures were also tested by shifting the grains according to
the displacement-shift-complete lattice (Brokman and Balluffi, 1981) and only GB configurations with the lowest energies were conserved. This GB relaxation method can be used for both HAB and LAB no matter what the distance hGBis. By this
way, every dislocation emission interacts with the same GB structure. We then pushed the indenter into the [111] direction and, at each loading step, the indentation depth was increased by 0.1 Å for two representative cases HAB and LAB, see
Section 3.1. Other methods to determine the partial dislocation CRSS exist, for instance computed from GBs, but are extremely difficult to implement and the method used in the present study appears to be the simplest.
2.3. Two-scale numerical simulations
In this framework, the two scales considered were the atomistic (QC) and the mesoscopic (continuum) ones. The calibration of the mechanical behavior at GBs in a nc solid (mesoscopic scale) was reached through QC simulations (atomistic scale). As seen before, the GB strain can be decomposed into two components, a sliding part and an opening part. In order to determine the sliding part, we performed QC simulations of GBs undergoing simple shear loads. The opening part was calibrated from QC simulations by means of GBs undergoing tensile tests. In order to avoid precocious decohesion on the RVE edges, we imposed a larger critical stress on GBs the RVE near surfaces. Finally we performed QC nanoindentation tests to calibrate the grain mechanical behavior. Note that the intragranular decohesion was not allowed in the model. In fact, according to the studies ofSansoz and Molinari (2004)andHeino et al. (1998), for a free copper crystal, applying a displacement perpendicular to the {011} planes leads to a maximum tensile strength of 14.97 and 14.3 GPa, respectively. These last values are higher than all scobserved for the GB decohesion behavior predicted by QC simulations,
so that no intragranular decohesion should be a priori expected. The nc solid illustrated inFig. 5a, composed of 16 grains and 34 GBs, is the one used in this study. Because this nc was composed of 34 GBs, 136 QC simulations were performed to obtain the GBs mechanical behaviors, 34 for sliding and 34 for opening, times 2 for the HAB and LAB textures.
2.4. Continuum LAB and HAB finite element setups
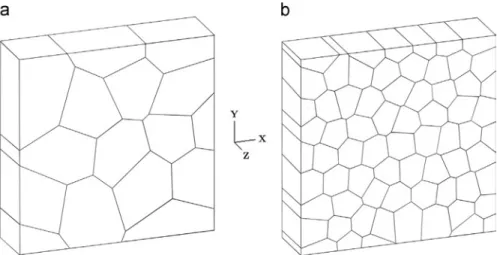
In order to construct nc textures finite element models we used a representative volume element (RVE) consisting of 16 grains (see Fig. 5a). This RVE (as the one with 70 grains) followed a Voronoï construction generated by an algorithm
ensuring the homogeneity of the grain sizes through a set of tolerance parameters. All grains were numbered as shown in
Fig. 1a so that each GB was fully determined by two numbers. For example, inFig. 1b, the interface between grains 7 and 8 is defined as GB7−8.
The aim of this part of the study is to illustrate the ability of this two-scale method to model complex material behaviors. We illustrate this ability through the study of two GBCDs. One contains only LAB and the other one 94% of HAB, the aim being to capture the mechanical behavior of nc metals according to their GBCD. Towards this end, a grain orientation was assigned to each grain and misorientation distributions were defined for the determination of LAB and HAB proportions.
Fig. 1b illustrates the orientation approach to reconstruct the nc HAB texture of the GB common to grains 7 and 8. The misorientation between grains 7 and 8 is thus given by Δψ7−8¼ jψ7−ψ8j with ψ7¼ 11:201 and ψ8¼ 164:011. ψ represents
the misorientation of the basis vectors ½1; 1; 1$½1; 1; 2$ around the out-of-plane axis ½1; 1; 0$. Rotations are positive in the counterclockwise sense and spread from 01 to 3601. The quantity Δψ represents the GB misorientation, which is here the criterion determining if the considered GB belongs either to the HA or to the LA type. Each grain orientation allows us to characterize his GBs normals. For instance, in the case of the GB7−8, the normals at the interface seen from 7th and 8th grain
points of view are represented by the Miller indexes (9; 9; 10) and (1; 1; 3), respectively.
The misorientations belonging to the four intervals: 91-811, 991-1711, 1891-2611, 2791-3511 are considered HAB, the other ones belong to the LAB class. This lies in the fact that the rotation around the tilt axis [1, 1; 0] presents a C4 symmetry so that the structure is the same by rotating it every 901. This symmetry allows us to present the misorientations distribution only from 01 to 901.Fig. 6shows the misorientation distributions for both of the textures eventually chosen as representative of HAB and LAB dominated nanostructures. For the LA texture, all misorientations belong to the interval from 01 to 91, so that we can consider a 100% LAB GBCD. In the HAB case, only two GBs are considered as low angles.
3. Results and discussion
3.1. Calibration of the GB elasto-plastic laws
The QC atomistic results (shear stress vs. shear strain) were fitted to determine the finite-element elasto-plastic parameters, which are then used for the GBs constitutive laws in the direct numerical simulations (DNS), namely, the shear
Fig. 6. Misorientations distributions for both HA and LA textures.
Fig. 5. (a) Mesh with 16 grains used for all simulations and discretized in 7.451 tetrahedral elements. (b) Mesh with 70 grains used to check mesh dependency and discretized in 26,985 tetrahedral elements.
modulus G and the yield stress s0. The coefficients ϵ0and M are also parameters but are kept constant for all GBs: 1.0 and
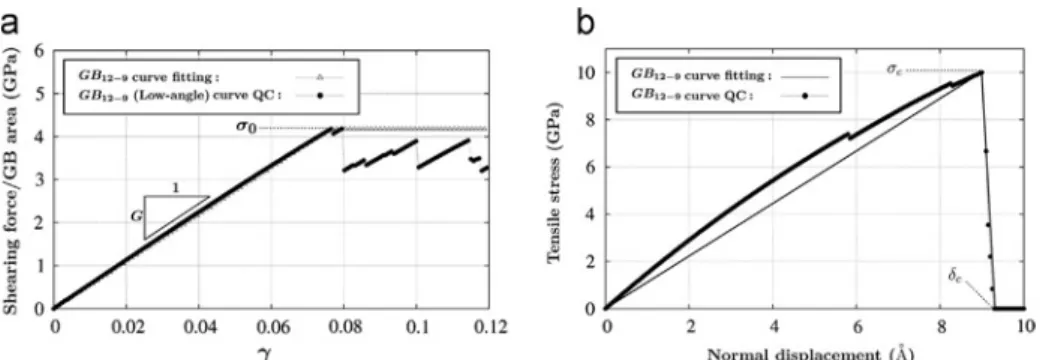
1000.02respectively. As an illustration, the corresponding results for GB
12−9(LAB texture) are given inFig. 7a. In this case,
the shear modulus is found to be G¼53 GPa and the maximum stress to be s0¼ 4:18 GPa. This fitting procedure was
employed for each GB of the two studied textures. The decohesion behavior of each GB was fitted as shown inFig. 7b, where the critical stress scand the strain to failure δcwere found to be equal to 10 GPa and 0.93 nm, respectively.
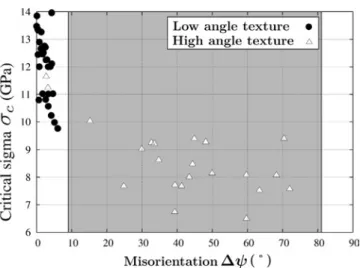
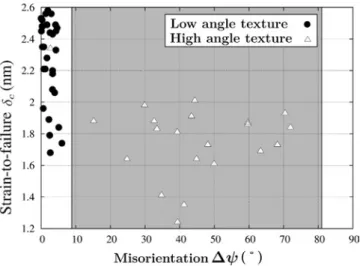
Fig. 8represents the GB energy after relaxation vs. misorientation Δψ. The interval 91-811 corresponds to the HAB. The other intervals (01-91, 811-901) correspond to LAB. We can identify a trend in this distribution of points. Low misorientations present lower energy compared to high ones, which highlight their higher stability.Figs. 9and10illustrate the sliding QC tests results. Low energy structures have on average higher yield stresses and higher shear moduli (naturally subjected to variations because of the elastic anisotropy of copper). Regarding the opening QC tests presented inFigs. 11and
12, it appears that LAB have higher critical stresses and strain-to-failures on average than in the HAB case.
Dislocation nucleation and CRSS: making use of the bicrystal nanoindentation setup described in Section 2.2.2, two representative cases (HA and LA) are chosen here to calibrate the CRSS as a function of the grain sizes. The HAB (43:311) was constructed such that the lower grain has a normal to the GB oriented along the direction [117]. In the LAB (3:241) case, it was oriented along the direction [889]. These GBs have been used in accordance with the common definition of LAB and HAB (LABo91, HAB491). Fig. 13 shows the shear stress field (sxy) located below the left part of the indented surface
immediately prior to (on the left) and after (on the right) the dislocation emission. A partial dislocation with a 1/6 [112] Burgers vector and a [110] dislocation line direction is nucleated beneath the indenter. The corresponding atomic structure of Shockley partial slip along the [112] direction is presented inFig. 13. As noticed byTadmor et al. (1999), the maximum shear stress is found near the surface. As the atomic level stresses are only rigorously defined in bulk regions, the maximum stress must be considered with caution.
Note that inFig. 13, the results were obtained using the potential proposed byFoiles et al. (1986). For comparison purpose, the same simulations were performed using the potential proposed byMendelev et al. (2008), and the results are reported inFig. 14. The shear stress distributions under the indenter before the nucleation events are similar for both cases: the CRSS is found to be 5.086 GPa in the first case and 5.083 GPa for Mendelev potential. Based on this finding, the first potential (Foiles et al., 1986) is used for all subsequent simulations.
Fig. 7. (a) Evolution of the shear stress as a function of the applied shear strain for GB12−9(LAB) fitted from QC simulation. (b) Normal displacement vs. tensile stress for a QC simulation.
Fig. 8. GB energy vs. misorientation.
Fig. 15shows the results of the nanoindentation QC tests for both LA and HA cases. The distance hGB(representative of
the grain diameter d) ranges from 3.28 nm to 6.56 nm. In both the HAB and LAB cases, when hGBis larger than 4 nm, the
dislocation is emitted without interacting with the GB and the CRSS remains constant (≈5:1 GPa). The discrepancy occurs for lower sizes when the dislocation interacts with the GB. Dislocations are, in both cases, transmitted to the lower grain. These CRSS values are ultimately used to calibrate the grain constitutive behavior for grain sizes between 2.0 and 6.56 nm.
Fig. 9. Yield stress vs. misorientation.
Fig. 10. Shear modulus vs. misorientation.
3.2. RVE results and mesh dependency
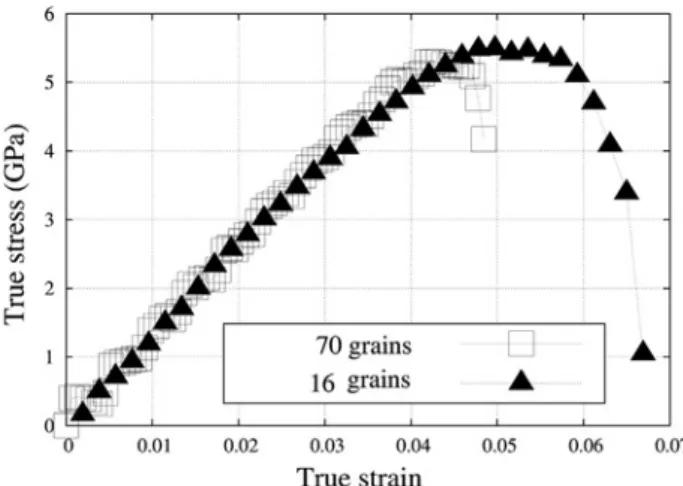
The aim of this part is to check whether the RVE of 16 grains is significantly representative, i.e., that the response does not change if the number of grains increases. The two RVEs illustrated inFig. 5a and b are subjected to tensile tests with the boundary conditions depicted inFig. 16. The nodes are constrained along the z-axis and the deformation is displacement-controlled.
The set of material parameters used is identical for the two simulations. The grain size is the same for both RVEs (6.56 nm) so that the RVEs widths and heights are equal to 23.26 nm and 48.64 nm for both the 16 grains and 70 grains setups, respectively. The same CRSS of 5.096 GPa is thus used for both simulations. The other constitutive model parameters for copper are presented inTable 1(Cuitiño and Ortiz, 1993). Each GB presents the same parameters. E, the Young modulus, is equal to 86.97 GPa. In the case of the GB sliding behavior, s0;slidingis equal to 3.36 GPa, M¼1000, ϵ0¼ 1 and h¼1 nm. The GB opening behavior is calibrated to sc¼ 9 GPa and δc¼ 1 nm.
Fig. 12. Strain-to-failure δcvs.misorientation.
Fig. 13. Shear stress (Pa) distribution beneath the rectangular indenter (left part) with a HAB in its vicinity (hGB¼ 5:345 nm) and with the potential proposed byFoiles et al. (1986). On the left: prior to dislocation emission. On the right: immediately after the nucleation event.
Fig. 14. Shear stress (Pa) distribution beneath the rectangular indenter (left part) with a HAB in its vicinity (hGB¼ 5:345 nm) and with the potential proposed byMendelev et al. (2008). On the left: prior to dislocation emission. On the right: immediately after the nucleation event.
Fig. 17shows that the results of the two simulations do not depend on the number of grains of the microstructure until the softening point is reached, i.e., both meshes used for this illustration show the same mechanical behavior until the localization bands form at the decohesion zone. However we need to keep in mind that, generally speaking, after the softening point, the studied cells loose their representative nature, and no convergence with respect to the cell size can be reached. The convergence for only 16 grains can then be assessed before localization, which is consistent with the results of
Fig. 15. CRSS evolution with hGBfor HA and LA GBs.
Fig. 17. Strain–stress curves for two RVEs consisting in 16 and 70 grains and with same mechanical laws.
Fig. 16. Tensile test boundary conditions. The vector displacement u! is imposed on the top face of the RVE in the y direction. All nodes are constrained along the z-axis.
a previous study on finite element RVE grains number convergence in nc metals performed byJérusalem, 2011. Focusing our attention only on the mechanical deformation mechanisms before softening, the RVE of 16 grains will be used for all subsequent simulations.
3.3. Mechanical responses of HA and LA textures
The microstructure inFig. 5a is subjected to tensile tests. The boundary conditions are those applied inSection 3.2(see
Fig. 16). During the tensile test, we calculate the average stress in the system as a function of the strain.Fig. 18shows the stress–strain curves of HA and LA textures with grain sizes ranging from 3.28 to 6.56 nm for three sets of parameters. The first set (set 1) considers only the GB sliding, GB opening and intragranular mechanical behaviors are totally elastic. The second set (set 2) takes into account both the GB sliding and the GB opening. In the third set (set 3), intragranular plasticity is added. In each case, the three sets of parameters produce the same elastic behavior. The discrepancies appear with the plastic behavior. We have determined the yield stress as being the stress at which the residual plastic strain is 0.002. The resulting yield stress decreases when going from sets 1 to 3. In fact, the higher the number of constitutive mechanical laws inducing plasticity in the model, the earlier the plasticity. Additionally, yield stresses in the HAB textures are always lower than in the LAB cases. A reduced material strength is also observed when the grain size decreases.
For a grain size equal to 6.56 nm and considering the third set of parameters, yield stresses of the HAB and the LAB textures are of the order of 4.45 GPa and 7.7 GPa, respectively, and the elastic deformations reached for these stresses are of the order of 3% and 6%, respectively. These results are in good agreement with previous MD results (Li and Ghoniem, 2008) for which a twin texture reaches more than 12 GPa before entering in the plastic region appearing for a 7% strain. This comparison with a twin texture confirms the hierarchy of textures strength based on the GBs, i.e., sy;LAosy;twin. Although we
find that this hierarchy is respected, a direct quantitative comparison of the LA texture yield stress for nc copper with the literature remains impossible because of the lack of study on the subject. Also, in the study byCao and Wei (2006), nc composed of HAB is found to exhibit a yield stress of 2.7–3 GPa for a 3% strain. The HA texture yield stress is slightly overvalued compared to MD simulations, due to the 2D nature of this framework. In fact, the inputs of the DNS model coming from 2D QC tests are overvalued because no out-of-plane accommodation can happen unlike to what can happen in Fig. 18. Stress–strain curves of the nc solid under tension for two grain sizes, two textures (HA or LA) and three sets of parameters. (a) HA, d¼3.28 nm. (b) HA, d¼6.56 nm. (c) LA, d¼3.28 nm. (d) LA, d¼6.56 nm. Set (1): sliding only. Set (2): sliding and opening. Set (3): sliding, opening and intragranular crystal plasticity.
MD simulations. Despite these yield stresses discrepancies, we nevertheless observe a definite trend in their mechanical behaviors in agreement with MD results.
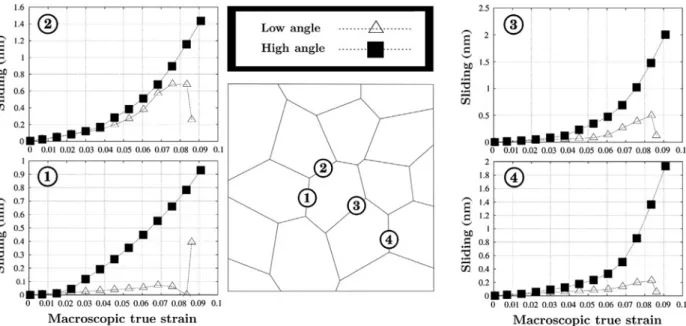
More quantitatively,Fig. 19shows the plastic part of sliding vs. total structure strain at four GB nodes for both HA and LA textures. For each node numbered from 1 to 4 and reported inFig. 19, we find that HABs slide more than LABs, in agreement with the longer elastic part of the strain in the LA case, seeFig. 18. In the HA case, the sliding of the four nodes increases regularly with the macroscopic true strain. For the other texture, LAB nodes do not present the same behavior. Here, a sliding inversion is observed when the macroscopic true strain is of the order of 0.08. The intragranular plasticity threshold is reached and this sliding inversion corresponds to a GB relaxation. This inversion is not observed for the HA texture because it is easier for the HAB to slide so that the intragranular plasticity threshold is never reached. Consequently, this highlights the absence (HA case) and the presence (LA case) of a competition between intragranular and intergranular plasticity at this grain size. We emphasize here that our finding concerning HABs, i.e., higher energies (see Fig. 8) and prominent/easier sliding Fig.(19) compared to LABs, has also been reported byWarner et al. (2006). Similar results are Fig. 19. Sliding vs. macroscopic true strain at four nodes numbered from 1 to 4 for both HA and LA textures under tension with grain sizes 6.56 nm.
observed with the opening part in Fig. 20. The decohesion appears faster and is much more marked in the HA case as expected given their lower strain-to-failures and yield stresses.
3.4. Reverse Hall–Petch effect
Polycrystals with grain sizes in the micron range have long been known to exhibit a strong dependency of the yield stress on the grain size. This dependency is well characterized by the Hall–Petch (Hall, 1951;Petch, 1953) relation
sy¼ s0þ kd−1=2 ð26Þ
where k is a positive multiplicative constant and s0the lattice friction stress. Based on this observation, a microstructure
refinement has been exploited as a means of producing materials with increased strength. However, past experimental evidences (Chokshi et al., 1989) have proved that the yield stress decreases when the grain size is reduced beyond a certain Fig. 21. Stress strain curves of the nc solid under tension for both HA and LA textures and for grain sizes ranging between 3.28 and 6.56 nm. (a) HA texture. (b) LA texture. (c) Zoom near the yield stress zone for the HA texture.
Fig. 22. Hall-petch plots for nc copper predicted by the model under quasi-static loading. (a) HA vs. LA textures. (b) Two-scale model vs. MS simulations (Schiøtz et al., 1999).
threshold (Song et al., 1999; Haque and Saif, 2002; Schuh et al., 2003). In particular, it has been suggested that the dependence of the yield stress on the grain size may follow an inverse square root relation, as in Eq.(26), but with a negative coefficient k. However, this aspect of the response of nc solids is still the subject of considerable debates (Meyers et al., 2006). As a result, there have been significant efforts to confirm and explain this inverse Hall–Petch effect in nc solids.
We show here that the two-scale model presented in this paper predicts the reverse Hall–Petch effect. To this end, we compare our results with past MS results obtained bySchiøtz et al. (1999). The tests considered here are tensile tests on nc copper with grain sizes ranging from 3.28 to 6.56 nm and for both textures. The dimensions of the microstructure seen on
Fig. 1a are changed for each size of grains in order to fit to the grain sizes studied bySchiøtz et al. (1999).Fig. 21represents the results when we consider only the set 3 of parameters (sliding, opening and anisotropic intragranular plasticity). Both textures present a softening when the grain size decreases.
The reverse Hall–Petch effect results are presented inFig. 22a and b. The LA texture yield stresses are roughly twice larger than their HA counterparts, as it could be expected. This apparent softening (albeit not converged) is due to the increased presence of GBs proportion (h, the width of GB being constant for all simulations), thus leading to a decrease of the yield stresses with the grain size.Fig. 22b compares the model (HA texture, set 3) against MS study (Schiøtz et al., 1999). A factor of 3 is observed while we were expecting similar results for both models. This last discrepancy is mainly due to the 2D nature of the quasicontinuum method used to calibrate our model. This induces the over-evaluation of the nanostructure yield stress.
However, despite the fact that the model captures the reverse Hall–Petch effect predicted by atomistic simulations with regard to the yield strength, this is not true with regard to the flow strength or peak strength that should follow inverse Hall–Petch scaling as reported for full atomistic simulations. Further some of the stress–strain curves seem much more brittle in the multiscale model compared to the atomistic simulations (Schiøtz et al., 1999). This discrepancy is due, as previously mentioned inSection 3.2, to the loss of representativeness of the RVE, near and during strain softening. Indeed, during the localizations stage, results are expected to depend on the RVE size, which is herein modified when the grain sizes change.
A direct quantitative comparison between the present simulations and experimental results has to be done carefully. The main difference between experiment results and these simulations lies in the fact that the level of the yield stress obtained by our model is overvalued for several reasons. Experimental nc samples typically contain voids and surface defects (Deng and Sansoz, 2009), reducing the strength of the material by at least a factor of 5 (Nieman and Weertman, 1991;Weertman, 1993). Second, because the QC method is—in this present version—a quasi-static technique, the procedure used here corresponds to a slow strain-rate at zero temperature. Therefore, there is no thermally activated process in our simulations, which also contributes to increase the nanostructure yield stress.
4. Conclusions
In this work, a two-scale method accounting for the specific GBCD of nc copper was developed. Such method does not suffer from the length scale limitations commonly encountered in atomistic simulations. Based on a statistically relevant sample of 136 QC simulations of shear and tension tests in copper bicrystals, we have found that the critical stresses for sliding and decohesion, as well as the strain-to-failure, are significantly higher in LAB than in HAB. Therefore we demonstrate that sliding and decohesion of random GBs in nc metals subjected to plastic deformation cannot be modeled by a unique constitutive law, unlike the prevailing assumption made in past studies. The model also captures precisely the reverse Hall–Petch effect predicted by atomistic simulations. This methodology can also be used for other materials such as brittle ceramics, where the GBs deformation plays an important role on their mechanical responses.
It must also be emphasized that the results are overvalued compared to dynamics simulations. The discrepancy can easily be rationalized by the 2D nature of the QC method but also by the fact that voids and surface defects and thermally activated processes are not accounted for in the simulations.
As a conclusion, a new multiscale continuum framework, more efficient than atomistic simulations and accounting for mechanical mechanisms until now unavailable to continuum frameworks, has been successfully proposed. Such a model opens the way to simulation frameworks able to automatically characterize GBs behaviors as a function of intergranular evolutions, while not necessarily fully modeling them. Such feature could be of drastic importance in the simulation of a recently discovered substitute for nanocrystals, namely nanotwinned ultrafine crystals.
Acknowledgments
A. J. acknowledges support from the Juan de la Cierva grant from the Spanish Ministry of Science and Innovation, from the Amarout grant from the European Union and from the ESTRUMAT-S2009/MAT-1585 grant (Madrid Regional Government). F. S. also gratefully acknowledges support from the National Science Foundation (Grant number DMR-0747658). The authors would like to thank Ronald E. Miller for his helpful comments.
References
Agnew, S.R., Elliott, B.R., Youngdahl, C.J., Hemker, K.J., Weertman, J.R., 2000. Microstructure and mechanical behavior of nanocrystalline metals. Mater. Sci. Eng. A A285, 391.
Alexandreanu, B., Capell, B., Was, G.S., 2001. Combined effect of special grain boundaries and grain boundary carbides on IGSCC of Ni16Cr9FexC alloys. Mater.
Sci. Eng. A 300, 94–104.
Arafin, M.A., Szpunar, J.A., 2009. A new understanding of intergranular stress corrosion cracking resistance of pipeline steel through grain boundary character and crystallographic texture studies. Corros. Sci. 51, 119–128.
Brewer, L.N., Othon, M.A., Young, L.M., Angeliu, T.M., 2006. Misorientation mapping for visualization of plastic deformation via electron back-scattered diffraction. Microsc. Microanal. 12, 85–91.
Bringa, E.M., Caro, A., Victoria, M., Park, N., 2005. The atomistic modeling of wave propagation in nanocrystals. J. Miner. Metal Mater. Soc. 57, 67–70.
Bringa, E.M., Caro, A., Leveugle, E., 2006. Pressure effects on grain boundary plasticity in nanophase metals. Appl. Phys. Lett. 89, 023101.
Brokman, A., Balluffi, R.W., 1981. Coincidence lattice model for the structure and energy of grain-boundaries. Acta Metall. 29, 1703.
Cao, A.J., Wei, Y.G., 2006. Formation of fivefold deformation twins in nanocrystalline face-centered-cubic copper based on molecular dynamics simulations. Appl. Phys. Lett. 89, 4.
Chokshi, A.H., Rosen, A., Karch, J., et al., 1989. On the validity of the Hall–Petch relationship in nanocrystalline materials. Scr. Metall. 1679, 23.
Crawford, D.C., Was, G.S., 1992. The role of grain boundary misorientation in intergranular cracking of Ni16Cr9Fe in 360 1C argon and high-purity water.
Metall. Mater. Trans. A 23, 1195–1206.
Cuitiño, A.M., Ortiz, M., 1993. Computational modelling of single crystals. Model. Simul. Mater. Sci. Eng. 1, 225–263.
Dao, M., Lu, L., Shen, Y., Suresh, S., 2006. Strength, strain-rate sensitivity and ductility of copper with nanoscale twins. Acta Mater. 54, 5421–5432.
Daw, M.S., Foiles, S.M., Baskes, M.I., 1992. The embedded-atom method: a review of theory and applications. Mater. Sci. Rep. 9, 251–310.
De Koning, M., Kurtz, R.J., Bulatov, V.V., Henager, C.H., Hoagland, R.G., Cai, W., et al., 2003. Modeling of dislocation-grain boundary interactions in fcc metals. J. Nucl. Mater. 323, 281.
Deng, C., Sansoz, F., 2009. Near-ideal strength in gold nanowires achieved through microstructural design. ACS Nano 3, 3001–3008.
Dupont, V., Sansoz, F., 2008. Quasicontinuum study of incipient plasticity under nanoscale contact in nanocrystalline aluminum. Acta Mater. 56, 6013–6026.
Erb, U., El-Sherik, A.M., Palumbo, G., Aust, K.T., 1993. Synthesis, structure and properties of electroplated nanocrystalline materials. Nanostruct. Mater. 2, 383.
Farkas, D., 2000. Atomistic theory and computer simulation of grain boundary structure and diffusion. J. Phys.: Conden. Matter 12, R497–R516.
Foiles, S.M., Baskes, M.I., Daw, M.S., 1986. Embedded-atom method functions for the fcc metals Cu, Ag, Au, Ni, Pd, Pt, and their alloys. Phys. Rev. B 33, 7983–7991.
Fougere, G.E., Weertman, J.R., Siegel, R.W., 1995. Processing and mechanical behavior of nanocrystalline Fe. Nanostruct. Mater. 5, 127–134.
Franciosi, P., 1985. The concepts of latent hardening and strain hardening in metallic single crystals. Acta Metall. 33, 1601.
Franciosi, P., 1988. On flow and work hardening expression correlations in metallic single crystal plasticity. Appl. Phys. Rev. 23, 383.
Franciosi, P., Zaoui, A., 1982. Multislip in fcc crystals: a theoretical approach compared with experimental data. Acta Metall. 30, 1627.
Franciosi, P., Zaoui, A., 1983. Glide mechanisms in bcc crystals: an investigation of the case of α-iron through multislip and latent hardening tests. Acta Metall. 31, 1331.
Fu, H.H., Benson, D.J., Meyers, M.A., 2001. Analytical and computational description of effect of grain size on yield stress of metals. Acta Mater. 49, 2567–2582.
Fu, H.H., Benson, D.J., Meyers, M.A., 2004. Computational description of nanocrystalline deformation based on crystal plasticity. Acta Mater. 52, 4413–4425.
Gertsman, V.Y., Bruemmer, S.M., 2001. Study of grain boundary character along intergranular stress corrosion crack paths in austenitic alloys. Acta Mater. 49, 1589–1598.
Gleiter, H., 1989. Nanocrystalline materials. Prog. Mater. Sci. 33, 223–315.
Gleiter, H., 1999. Nanostructured materials: basic concepts and microstructure. Acta Mater. 48, 1–29.
Hall, E.O., 1951. The deformation and ageing of mild steel: 3 discussion of results. Proc. Phys. Soc. Sect. B 64, 747.
Haque, M., Saif, M.T.A., 2002. Mechanical behavior of 30–50 nm thick aluminum films under uniaxial tension. Scr. Mater. 47, 863–867.
Heino, P., Hakkinen, H., Kaski, K., 1998. Molecular-dynamics study of mechanical properties of copper. Europhys. Lett. 41, 273–278. Hirth, J.P., Lothe, J., 1968. Theory of dislocations, McGraw-Hill, New York.
Jacobsen, K.W., Schiøtz, J., 2002. Nanoscale plasticity. Nat. Mater. J. 1, 15.
Jérusalem, A., 2011. Continuum modeling of the reverse Hall–Petch effect in nanocrystalline metals under uniaxial tension: how many grains in a finite element model?. Philos. Mag. Lett. 91 (9), 599–609.
Jérusalem, A., Stainier, L., Radovitzky, R., 2007. A continuum model describing the reverse grain-size dependence of the strength of nanocrystalline metals. Philos. Mag. 87, 2541–2559.
Jérusalem, A., Dao, M., Suresh, S., Radovitzky, R., 2008. Three-dimensional model of strength and ductility of polycrystalline copper containing nanoscale twins. Acta Mater. 56 (17), 4647–4657.
Kim, H.S., Estrin, Y., Bush, M.B., 2000. Plastic deformation of fine-grained materials. Acta Mater. 48, 493–504.
King, A., Johnson, G., Engelberg, D., Ludwig, W., Marrow, J., 2008. Observations of intergranular stress corrosion cracking in a grain-mapped polycristal. Sci. Mag. 321, 382–385.
Kraft, R.H., Molinari, J.F., Ramesh, K.T., Warner, D.H., 2008. Computational micromechanics of dynamic compressive loading of a brittle polycrystalline material using a distribution of grain boundary properties. J. Mech. Phys. Solid 56, 2618–2641.
Kuchnicki, S.N., Cuitiño, A.M., Radovitzky, R.A., 2006. Efficient and robust constitutive integrators for single-crystal plasticity. Int. J. Plast. 36, 1.
Kumar, K.S., Van Swygenhoven, H., Suresh, S., 2003. Mechanical behavior of nanocrystalline metals and alloys. Acta Mater. 51, 5743. Kung, H., Sanders, P.G., Weertman, J.R., 1999. The minerals, metals, and materials society. In: Advanced Materials for the 21st Century, p. 455.
Li, L., Ghoniem, N.M., 2008. Twin-size effects on the deformation of nanotwinned copper. Phys. Rev. B 79, 075–444.
Lin, H., Pope, D.P., 1993. The influence of grain boundary geometry on intergranular crack propagation in Ni3Al. Acta Metall. Mater. 41, 553–562.
Lu, L., Wang, L.B., Ding, B.Z., Lu, K., 2000. High-tensile ductility in nanocrystalline copper. J. Mater. Res. 15, 270–273.
Mendelev, M.I., Kramer, M.J., Becker, C.A., Asta, M., 2008. Analysis of semi-empirical interatomic potentials appropriate for simulation of crystalline and liquid Al and Cu. Philosophical Magazine 88, 1723–1750.
Meyers, M., Mishra, A., Benson, D., 2006. Mechanical properties of nanocrystalline materials. Prog. Mater. Sci. 51, 427.
Miller, R., Tadmor, E.B., 2002. The quasicontinuum method: overview, applications and current directions. J. Comput. Aided Mater. Des. 9, 203–239.
Nieman, G.W., Weertman, J.R., 1991. Mechanical behavior of nanocrystalline Cu and Pd. J. Mater. Res. 6, 1012–1027.
Ortiz, M., Pandolfi, A., 1999. Finite-deformation irreversible cohesive elements for three-dimensional crack-propagation analysis. Int. J. Numer. Methods Eng. 44, 1267.
Pan, Y., Adams, B.L., Olson, T., Panayotou, N., 1996. Grain-boundary structure effects on intergranular stress corrosion cracking of alloy X750. Acta Mater. 44, 4685–4695.
Petch, N.J., 1953. The cleavage strength of crystals. J. Iron Steel Inst. 174, 25–28.
Randle, V., Rohrer, G.S., Miller, H.M., Coleman, M., Owen, G.T., 2008. Five-parameter grain boundary distribution of commercially grain boundary engineered nickel and copper. Acta Mater. 56, 2363–2373.
Rittner, J., Seidman, D., 1996. 〈110〉 symmetric tilt grain-boundary structures in fcc metals with low stacking-fault energies. Phys. Rev. B 54, 6999.
Sailor, D.M., Morawiec, A., Adams, B.I., Rohrer, G.S., 2000. Misorientation dependence of the grain boundary energy in magnesia. Interface Sci. 8, 131–140.
Sansoz, F., Molinari, J.F., 2004. Incidence of atom shuffling on the shear and decohesion behavior of a symmetric tilt boundary in copper. Scr. Mater. 50, 1283–1288.
Sansoz, F., Molinari, J.F., 2005. Mechanical behavior of s tilt grain boundaries in nanoscale Cu and Al: a quasicontinuum study. Acta Mater. 53, 1931–1944.
Sansoz, F., Stevenson, K.D., 2011. Relationship between hardness and dislocation processes in a nanocrystalline metal at the atomic scale. Phys. Rev. B 83, 224101.
Schiøtz, J., Jacobsen, K.W., 2003. A maximum in the strength of in nanocrystalline copper. Sci. Mag. 301, 1357.
Schiøtz, J., Vegge, T., Di Tolla, F.D., Jacobsen, K.W., 1999. Atomic-scale simulations of nanocrystalline metals. Phys. Rev. B 60, 11971.
Schuh, C., Nieh, T., Iwasaki, H., 2003. The effect of solid solution w additions on the mechanical properties of nanocrystalline Ni. Acta Mater. 51, 431.
Schwaiger, R., Moser, B., Dao, M., 2003. Some critical experiments on the strain-rate sensitivity of nanocrystalline nickel. Acta Mater. 51, 5159–5172.
Shenoy, V.B., Miller, R., Tadmor, E.B., Rodney, D., Phillips, R., Ortiz, M., 1999. An adaptive finite element approach to atomic-scale mechanics: the quasicontinuum method. J. Mech. Phys. Solids 47, 611–642.
Shigematsu, N., Prior, D.J., Wheeler, J., 2006. First combined electron backscatter diffraction and transmission electron microscopy study of grain boundary structure of deformed quartzite. J. Microsc. 224, 306–321.
Song, H.W., Guo, S.R., Hu, Z.Q., 1999. A coherent polycrystal model for the inverse Hall–Petch relation in nanocrystalline materials. Nanostruct. Mater. 11, 203.
Spearot, D.E., Jacob, K.I., McDowell, D.L., 2004. Non-local separation constitutive laws for interfaces and their relation to nanoscale simulations. Mech. Mater. 36, 825–847.
Tadmor, E.B., Miller, R., Phillips, R., 1999. Nanoindentation and incipient plasticity. J. Mater. Res. 14 (6), 2233.
Tadmor, E.B., Ortiz, M., Phillips, R., 1996. Quasicontinuum analysis of defects in solids. Philos. Mag. A 73, 1529.
Thomas, G.J., Siegel, R.W., Eastman, J.A., 1990. Grain boundaries in nanophase palladium: high resolution electron microscopy and image simulation. Scr. Metall. Mater. 34, 2233.
Tsurekawa, S., Tanaka, T., Yoshinaga, H., 1994. Grain boundary structure, energy and strength in molybdenum. Mater. Sci. Eng. A 176, 341–483.
Valiev, R.Z., Alexandrov, I.V., 2002. Paradox of strength and ductility in metals processed by severe plastic deformation. J. Mater. Res. 17, 5.
Van Swygenhoven, H., 2002. Microstructure and mechanical behavior of nanocrystalline metals. Sci. Mag. 296, 66.
Van Swygenhoven, H., Weertman, J.R., 2003. Preface to the viewpoint set on: mechanical properties of fully dense nanocrystalline metals. Scr. Mater. 49, 625.
Van Swygenhoven, H., Spaczer, M., Caro, A., Farkas, D., 1999. Competing plastic deformation mechanisms in nanophase metals. Phys. Rev. B 60, 22–25.
van Swygenhoven, H., Derlet, P.M., Froseth, A.G., 2004. Stacking energies and slip in nanocrystalline metals. Nat. Mater. 3, 399–403.
Warner, D., Sansoz, F., Molinari, J., 2006. Atomistic-based continuum modeling of deformation mechanisms in nanocrystalline copper. Int. J. Plast. 22, 754.
Weertman, J.R., 1993. Hall–Petch strengthening in nanocrystalline metals. Mater. Sci. Eng. A 166, 161–167.
Wei, Y., Anand, L., 2004. Grain-boundary separation and sliding: application to nanocrystalline materials. J. Mech. Phys. Solid 52, 2587–2616.
Wei, Y.J., Su, L., Anand, C., 2006. A computational study of the mechanical behavior of nanocrystalline fcc metals. Acta Mater. 54, 3177–3190.
Wolf, D., Yamakov, V., Phillpot, S., Mukherjee, A., Gleiter, H., 2005. Deformation of nanocrystalline materials by molecular-dynamics simulation: relationship to experiments. Acta Mater. 53, 1–40.
Youngdahl, C.J., Sanders, P.G., Eastman, J.A., Weertman, J.R., 1997. Compressive yield strengths of nanocrystalline Cu and Pd. Scr. Mater. 37, 809.
Zhao, Z., Kuchnicki, S.N., Radovitzky, A.M., Cuitiño, R.A., 2007. Influence of in-grain mesh resolution on the prediction of deformation textures in fcc polycrystals by crystal plasticity fem. Acta Mater. 55, 2361–2373.