Auteurs:
Authors: Donya Farhanian, Gregory De Crescenzo et Jason Robert Tavares
Date: 2017
Type: Article de revue / Journal article
Référence:
Citation:
Farhanian, D., De Crescenzo, G. & Tavares, J. R. (2017). Kinetics, Chemistry, and Morphology of Syngas Photoinitiated Chemical Vapor Deposition. Langmuir, 33(8), p. 1780-1791. doi:10.1021/acs.langmuir.6b04151
Document en libre accès dans PolyPublie
Open Access document in PolyPublie URL de PolyPublie:
PolyPublie URL: http://publications.polymtl.ca/2789/
Version: Version finale avant publication / Accepted versionRévisé par les pairs / Refereed Conditions d’utilisation:
Terms of Use: Tous droits réservés / All rights reserved Document publié chez l’éditeur officiel
Document issued by the official publisher Titre de la revue:
Journal Title: Langmuir (vol. 33, no 8)
Maison d’édition:
Publisher: ACS Publications
URL officiel:
Official URL: https://doi.org/10.1021/acs.langmuir.6b04151
Mention légale:
Legal notice:
Ce fichier a été téléchargé à partir de PolyPublie, le dépôt institutionnel de Polytechnique Montréal
This file has been downloaded from PolyPublie, the institutional repository of Polytechnique Montréal
Kinetics, Chemistry and Morphology of Syngas
Photo-Initiated Chemical Vapor Deposition
Donya Farhanian, Gregory De Crescenzo, Jason R. Tavares*
Department of Chemical Engineering, École Polytechnique de Montréal, P.O. Box 6079, Station Centre-Ville, Montreal, Quebec, H3C 3A7, Canada.
KEYWORDS: photo-initiated chemical vapor deposition (PICVD), syngas, photo-polymerization, deposition rate, coating.
ABSTRACT: Syngas is the product of gasification processes and is used for the production of petrochemicals. Little attention has been given to its use for the production of oligomeric thin films at ambient conditions. Herein, the nature of photo-initiated chemical vapor deposition of films made from syngas using high wavelength ultraviolet light is discussed, including an exploration into the oligomeric films’ structure, synthesis mechanism and growth kinetics. Specifically, X-ray photoelectron spectroscopy and time-of-flight secondary ion mass spectrometry analyses provide insight into the chemical structure, illustrating the effect of photo-generated radicals in the formation of aliphatic, anhydride and cyclic structures. The films are covalently bonded to the substrate and chemically uniform. Electron and atomic force microscopy identify an island-like morphology for the deposit. These insights into to the mechanism and structure are linked to processing parameters through a study on the effect of residence time and treatment duration on deposition rate, determined through profilometry. 1 2 3 4 5 6 7 8 9 10 11 12 13 14 15 16 17 18 19 20 21 22 23 24 25 26 27 28 29 30 31 32 33 34 35 36 37 38 39 40 41 42 43 44 45 46 47 48 49 50 51 52 53 54 55 56 57 58 59
1. INTRODUCTION
Surface modification techniques have gained a lot of interest due to their ability to tailor surface properties without altering the bulk of the material. Hybrid organic-inorganic coatings are of interest in various fields such as optics, environmental sciences, energy, mechanics, catalysis and sensors, because they can tailor surface wettability as well as the chemical specifications of materials.1-5 Several techniques such as chemical vapor deposition (including plasma enhanced and thermally activated), atomic layer deposition and sol-gel techniques have been used for thin film synthesis.2,6 Among these techniques, photo-initiated chemical vapor deposition (PICVD) has considerable superiority given its simple reactor design, ease of use and control, scalability, versatility, affordability and low environmental footprint. The solvent-free deposition nature, as well as the ability to work without any high vacuum or high temperatures make this process an attractive alternative to other gas phase surface modification approaches.7-10
Most studies in this field use vacuum ultraviolet (VUV) lamps emitting at wavelengths shorter than 200 nm as initiation sources.11-19 However, despite the ability of light at these wavelengths to cleave most chemical bonds due to their high energy photons (5-15 eV),20 light transmission becomes prohibitive (i.e. specialized reactor windows, such as MgF2 and LiF, or designs are compulsory.2,21) Given these limitations, UVC light (200-280 nm),22 which can be transmitted through affordable quartz windows and generated via commercially ubiquitous germicidal lamps, merits investigation. Its application to PICVD requires the selection of appropriate precursors containing chemical bonds reactive at the wavelength of the UV source.
In general, precursor selection depends on (1) the modification technique, (2) the reactor type and (3) the required chemical and physical bulk properties corresponding to the application. In PICVD, precursors should either absorb UV or, in the case of precursor mixtures, react with the radical/excited species produced upon UV absorption of other monomers. Thus, absorption cross section, absorption
1 2 3 4 5 6 7 8 9 10 11 12 13 14 15 16 17 18 19 20 21 22 23 24 25 26 27 28 29 30 31 32 33 34 35 36 37 38 39 40 41 42 43 44 45 46 47 48 49 50 51 52 53 54 55 56 57 58
coefficient and ionization potential drive precursor selection.2,23 Window composition is one of the main features of reactor design. In PICVD processing with UVC lamps, there is no need for special materials and quartz windows are applicable. Many chemical compounds have been investigated for PICVD process such as methyl methacrylate, polyethyleneglycol diacrylate, trimethylolpropane tris(mercaptopropionate), ethylene, styrene, butadiene, etc.1,24-29 However, these need to be excited either in the presence of photoinitiators or photosensitizers, or with high energy UV lamps; this makes the process very expensive.
To overcome these issues, we looked to Fischer-Tropsh synthesis. In this process, catalysts are used to combine the binary mixture of CO and H2, known as synthesis gas or syngas, into hydrocarbons. Catalysts deactivate during this process, due to the formation of lightly polymerized carbon species.30-34 This surface fouling can be reimagined as surface engineering - this triggered us to consider syngas as an alternative reactive precursor in PICVD. Very few researchers have attempted to study the photo-polymerization of syngas components,9,35 and most have focused on carbon monoxide photochemical reactions in the early Earth's atmosphere or with low wavelength VUV lamps.35-37 Previously, our groupdemonstrated that syngas PICVD could be used to deposit thin films with various functionalities on copper substrates9 and nanomaterials,38-41 but the deposition mechanism and kinetics remain elusive. Herein, we report on the photochemical reaction of CO and H2 molecules to bring new insights into the mechanism and structure of the deposited film, and relate these features to key processing parameters. We present in terms of (i) chemical groups, (ii) density of generated products, (iii) morphology and topography of the deposited thin film, as well as (iv) film growth with respect to the irradiation time (and conversely, reagent residence time). These findings allow us to derive a reaction mechanism for the deposition process and a scheme for the chemical structure of the film, as well as kinetics to explain the deposition rate of the oligomeric film.
1 2 3 4 5 6 7 8 9 10 11 12 13 14 15 16 17 18 19 20 21 22 23 24 25 26 27 28 29 30 31 32 33 34 35 36 37 38 39 40 41 42 43 44 45 46 47 48 49 50 51 52 53 54 55 56 57 58 59
2. EXPERIMENTAL
2.1. Sample preparation:
Substrates were type N, orientation 110 silicon wafers with silicon oxide on the top surface (University Wafer), cut into 1 cm × 1 cm coupons. Before experiments, the coupons were cleaned by soaking in isopropanol (Fisher, 99.9% purity) in an ultrasonic bath for 10 minutes, and dried with compressed air.
2.2. Experimental methodology:
Before mounting onto a sample holder, we masked one side of the silicon coupon with Kapton tape to serve as a reference (Kapton® Polyimide for soldering and splicing; 7648A73 McMaster-Carr). The sample was inserted into the PICVD reactor (Figure 1S), which consists of a 225 cm3 plug flow quartz tube reactor with standard 24/40 taper joints (Montreal Glassblowing Inc.), surrounded by 28 UVC mercury (germicidal) lamps mounted in a UV-cabinet (custom made by Daavlin Co.). The UVC lamps have a main emission peak at a wavelength of 253.7 nm (measured via Ocean Optics Spectrometer/USB4000-XR1-ES), with a light intensity of 0.012 W/cm2 at the reactor distance of 33 cm (measured via ILT1700 Research Radiometer coupled with a SED240/QNDS2/ W254 nm sensor, International Light Technologies).
Before experiments, the reactor was purged for 5 minutes with 0.4 L/min of argon (Air Liquide, 99.99%). The prescribed amount of syngas (CO and H2, Air Liquide, 99.99%) was then fed to the reactor at an inlet pressure of 40 psi. The reactor was maintained at atmospheric pressure. The UV cabinet was then turned on and treatment duration time was set according to the experimental plan (Table 1S). Experiments were initiated at room temperature (~22 °C). However, over the course of treatment (2h), the temperature increased to 48 0C because of the heat given off by the UV lamps. Each experiment was repeated 3 times to ensure reproducibility.
1 2 3 4 5 6 7 8 9 10 11 12 13 14 15 16 17 18 19 20 21 22 23 24 25 26 27 28 29 30 31 32 33 34 35 36 37 38 39 40 41 42 43 44 45 46 47 48 49 50 51 52 53 54 55 56 57 58
2.3. Characterization techniques:
Elemental analysis of deposited films was done via a VG ESCALAB 3 MKII X-ray photoelectron spectroscope (XPS) equipped with a non-monochromatic Mg-Kα radiation source, operated at 300 W (15 kV, 20 mA). Survey scans were conducted at an X-ray incident angle of 15° with a penetration depths of ∼10 nm. The pass energy was 100 eV for survey scans and 20 eV for high-resolution scans in 1.00 eV and 0.05 eV increments, respectively. Pressure during analysis was kept under 5×10⁻⁹ Torr and the analyzed surface was 2 mm × 3 mm. Samples were stored under vacuum overnight prior to analysis. The XPS spectra were acquired normal to the sample surface and analyzed via the Avantage XPS software package. The elemental distribution of the samples was determined based on the peak area comparison (C1s, O1s, etc.), normalized to their corresponding sensitivity factors, after removal of the scattered electrons background. In the case of high-resolution spectra, binding energies were referenced to the C1s peak at 285.0 eV to adjust for possible charging effects, and the Shirley method was applied for background noise subtraction. According to the data trend for each distribution of binding energy, the baseline was manually placed. Each curve is represented by its maximum BE in this discussion. Species elemental distribution is obtained via Gaussian/Lorentzian curve fitting on the original curve. The number of sub-curves and their corresponding species were obtained with full width at half maximum (FWHM) = 1.6, 1.8, 2.2 and 2.7 eV for C, O, Si and Fe respectively These are the most frequent FWHM that we observed with this machine for each elements and normally have been used for all samples.
Static time-of-flight secondary ion mass spectrometry (TOF-SIMS) analysis was carried out with a ION-TOF SIMS IV (from ION-TOF GmbH, Germany) equipped with a 25 keV Bi3 liquid metal ion source as the primary ion beam source, in high current bunched mode. A bunching system gives pulse durations of 21.9 ns with a mass resolution M/∆M better than 8,000 around m/z 100 in positive and negative SIMS modes. Depth profiling (10 Ǻ maximum) was performed in non-interlaced mode, where
1 2 3 4 5 6 7 8 9 10 11 12 13 14 15 16 17 18 19 20 21 22 23 24 25 26 27 28 29 30 31 32 33 34 35 36 37 38 39 40 41 42 43 44 45 46 47 48 49 50 51 52 53 54 55 56 57 58 59
the analysis and sputtering occurred with a 50 µm × 50 µm analysis area confined within a 500 µm × 500 µm sputter area, keeping the total dose below 5 × 10¹² ions cm-2 (so called static conditions). Imaging of the samples was also performed in high mass resolution mode over an area of 500 µm × 500 µm with an imaging pixel density of 128 pixels × 128 pixels. Three measurements at adjacent spots were performed on the samples and positive and negative ion spectra were compared to confirm uniformity. Ion spectra were internally calibrated using H+, H2+, CH3+, C2H2+, C3H5+ and H−, C−, CH−, C2H−, and C4H− peaks, respectively.
Surface morphology of the deposited film was examined with a Hitachi ultrahigh-resolution cold field emission scanning electron microscope (Hitachi SU8230), equipped with an X-ray energy-dispersive spectroscope (EDS) (Bruker® Quad detector-Bruker® 4SD Argus system) operated at an accelerating voltage of 1-2.5 kV. Samples were mounted on metal stubs using conductive double-sided carbon tape.
Topography was investigated via a Multi-Mode 3 Atomic Force Microscope (Bruker AS-130) (AFM) operated in tapping mode. Microfabricated V-shaped silicon cantilevers (Applied Nano Inc.) with a theoretical spring constant of 37 N/m, a resonance frequency of ~300 kHz and a silicon conical tip (radius = 6 nm) were used. Squares of 5 µm in size were scanned in air under constant applied force conditions at a 0.8-1 Hz scan rate. Nanoscope analysis software was used for image processing and data analysis; images with 512 × 512 pixel resolution were obtained.
The film thicknesses were measured using stylus profilometry with a Veeco Dektak 150 surface profiler. In order to confirm the profilometry measurements, a few samples were measured by an ex situ M44 variable angle spectroscopic ellipsometer at angles of 65°, 70°, 75° in the wavelength range of 200-1000 nm. The applied optical model consisted of three components: the silicon substrate, the native SiO2 layer and the film bulk layer. The Cauchy function with Urbach tail was incorporated for
1 2 3 4 5 6 7 8 9 10 11 12 13 14 15 16 17 18 19 20 21 22 23 24 25 26 27 28 29 30 31 32 33 34 35 36 37 38 39 40 41 42 43 44 45 46 47 48 49 50 51 52 53 54 55 56 57 58
bulk components modulation. The model also took into account possible thickness inhomogeneity within the sampled area.
3. RESULTS AND DISCUSSION
3.1. Chemical characterization of deposited films
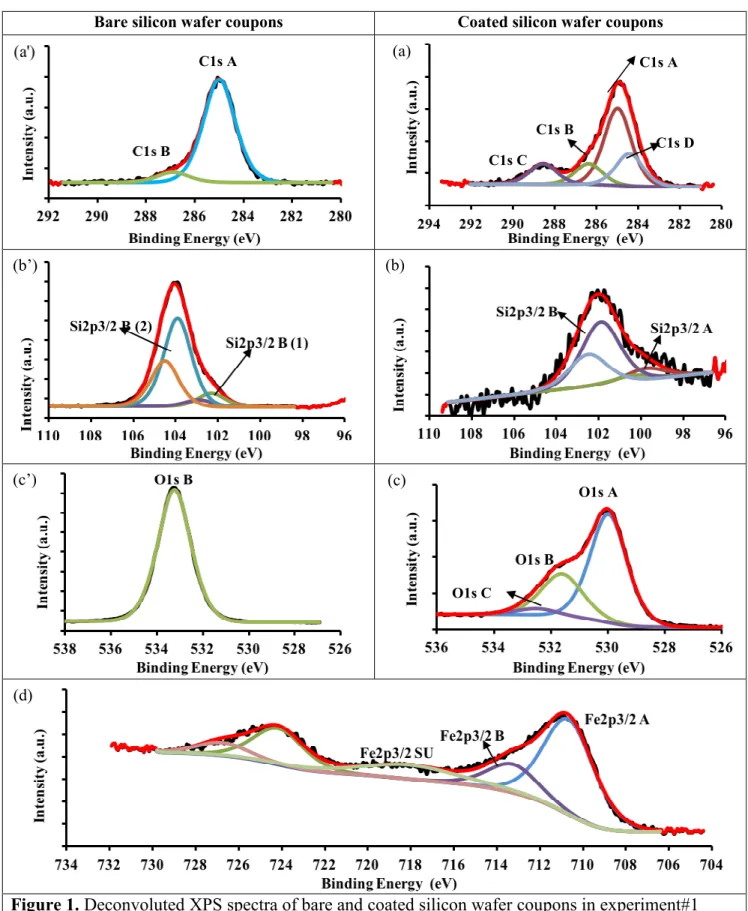
High resolution X-ray photoelectron spectroscopy (XPS) and time-of-flight secondary ion mass spectrometry (TOF-SIMS) analyses provided insight into the chemical composition of the deposited films. In order to gain information on the chemical bonding states and structure of the film, the XPS peaks for bare and coated silicon samples were deconvoluted (Figure 1). A summary of the high-resolution spectral deconvolutions along with their possible structure assignment and At % is presented in Table 1.
Table 1. XPS high-resolution spectral deconvolution peaks and their origins.
Peak Name Centered Binding Energy [eV] Possible Structure (1) Elemental atomic % Area Bare sample Coated sample(2) C1s A 285.0 *C–*C,* C–H,*C=*C, etc. 6.4 15.0 C1s B 286.4 *C–O–*C,*C–O–Fe, 1.2 2.4 C1s C 288.6 O–*C–O, O=*C–O,O=*C–O–Fe - 3.0 C1s D 284.4 Si–*C - 1.9 O1s A 530.0 Fe–*O - 36.7
O1s B 531.6 Fe–*O–H, C=*O, Si–*O–H 64.1 8.6
O1s C 532.5 C–*O–Fe, *O=C–*O–Fe - 6.4
Si2p3/2 A 99.8 *Si–*Si, *Si–Fe - 1.1
Si2p3/2 B Si2p3/2 B (1) Si2p3/2 B (2) 101.9 102.4 103.9 H3C–*Si(O)–CH3 Si+2 Polycrystalline Si in Si-Ox Si+4 Polycrystalline Si in Si-Ox - 4.5 23.8 2.0 - -
Fe2p3/2 A 710.7 *Fe–O, O=C–O–*Fe - 13.5
Fe2p3/2 B 713.3 C–O–*Fe - 4.8
Fe2p3/2 SU 718.0 C–O–*Fe, O=C–O–*Fe - 4.6
(1) *shows the elements correspond to that binding energy.
(2) Elemental atomic % correspond to the experiment #1 (Table 1S).
1 2 3 4 5 6 7 8 9 10 11 12 13 14 15 16 17 18 19 20 21 22 23 24 25 26 27 28 29 30 31 32 33 34 35 36 37 38 39 40 41 42 43 44 45 46 47 48 49 50 51 52 53 54 55 56 57 58 59
Bare silicon wafer coupons Coated silicon wafer coupons
Figure 1. Deconvoluted XPS spectra of bare and coated silicon wafer coupons in experiment#1
C1s A C1s A C1s B C1s C C1s D Si2p3/2 B (2) O1s A O1s C (a) (b’) (b) (c’) (c) (d) 1 2 3 4 5 6 7 8 9 10 11 12 13 14 15 16 17 18 19 20 21 22 23 24 25 26 27 28 29 30 31 32 33 34 35 36 37 38 39 40 41 42 43 44 45 46 47 48 49 50 51 52 53 54 55 56 57 58
(Table 1S)
Before treatment, the silicon wafer surface was mainly composed of silicon, oxygen and contained a small amount of carbon, most likely due to contaminants42,43 (~7.6%, Table 1). These contaminants (Figure 1a’) exhibited a high-resolution Cls peak at binding energy BE ≅ 285.0 eV and 286.9, which were assigned to C–C and C–H bonds (such as –CH, –CH2, –CH3 and C2H2, C2H5,...) and C–O–C bonds, respectively. Silicon sub-oxides such as SiO (Si2+), Si2O3 (Si3+) and SiO2 (Si4+) were assigned to BE of 101.4-102.0, 102.1-102.7 and 103.5-104.1 eV within the Si2p peak, respectively.45,46 Thus, the broad distribution of Si2p spectra at 102.2–104.2 eV was attributed to the various Si–Ox species (Figure 1b’). The oxygen peak at BE ≅ 533.3 eV represented oxygen in the oxide form (Figure 1c’). High-resolution spectral deconvolution of Si2p and O shows that the atomic percentage of oxygen, and silicon did not match. Indeed, in terms of stoichiometry, the Si/O ratio should be ½, but the amount of oxygen was determined to be higher (for 28.3 At % Si, the corresponding atomic percentage for oxygen should be 56.6% (Table 1). The observed higher oxygen amount (+7.5%, Table 1) was attributed to surface hydroxyl groups (Si-OH).45,47
After PICVD treatment, the C1s peak increased significantly, and the Si2p peak was attenuated, which was in agreement with survey results (Figures 2S and 3S). The C1s spectrum (Figure 1a) showed a group of overlapping peaks with BE from 282 to 292 eV, attributed to four significantly different surface carbon phases (identified as A, B, C and D). The dominant Phase A peak (C1s A, BE ≅ 285.0 eV) was attributed to aliphatic carbon (e.g. –CH, –CH2, –CH3), as well as polymerized CnHm chains (e.g. C≡C, C=C, C–C). Phase B (C1s B, BE ≅ 286.4 eV) contained C=CO–C and C–O–C, though it also could be assigned to C–O–Fe. Phase C (C1s C, BE ≅ 288.6 eV) could correspond to O=C–C, O–C–C, and also O=C–O–Fe.6 This range of BE (286.0–289.0 eV) is generally attributed to carbonates. Phase D (C1s D, BE ≅ 284.4 eV) was designated as a carbidic carbon layer, in the form of Si–C bonds. This means that the organic films we deposited had bonded with the silicon substrate
1 2 3 4 5 6 7 8 9 10 11 12 13 14 15 16 17 18 19 20 21 22 23 24 25 26 27 28 29 30 31 32 33 34 35 36 37 38 39 40 41 42 43 44 45 46 47 48 49 50 51 52 53 54 55 56 57 58 59
covalently. Since there is no C1s peak on the untreated sample at BE ≤ 284.4 (Figure 1a’), this covalent bond was formed during the PICVD process, which was confirmed by the Si2p spectrum: in Figure 1c, the attenuation of the doublet Si2p3/2 and Si2p1/2 in Si-Ox (102-104 eV) was observed after the organic grafting. In grafted silicon samples, the Si2p spectrum consisted of two main peaks and their doublet (A, B) located at BE ≅ 99.7 eV, and BE ≅ 101.8 eV. The first peak and its corresponding doublet exhibited the characteristic of Si2p3/2 with BE ≅ 99.7–99.9 eV and Si2p1/2 with BE ≅ 100.2–100.7 eV. This corresponded to elemental silicon in the form of Si–Si or even Fe–Si bond in the structure of the deposited film.46,48 The second peak was more alike to the binding energy in organic silicon ~102 eV (Si2p3/2 and Si2p1/2 of 101.7 eV and 102.4 eV respectively).46 Based on the elemental atomic percentage (Table 1), we propose the H3C–Si(–O)–CH3 structure for this peak. Other researchers have shown that such covalent bonding is possible through plasma polymerization under low pressure conditions.49 Here, we demonstrate the formation of a strong covalent bond under gentler, atmospheric PICVD processing conditions.
Using Gaussian fitting and literature reports,46,50 the O1s spectrum (Figure 1b) can be divided into three peak areas: A, B and C. A (BE ≅ 530 eV) is attributed to oxide species. B (BE ≅ 531.6 eV) is assigned to hydroxyl groups such as H–O–Fe, H–O–Si, –O=C, and C–O–O agents in ether and alcohol. C (BE ≅ 532.5 eV) corresponds to C–O–Fe, O=C–O–Fe species.
Peaks in the BE range of 705 to 740 eV have been attributed to iron.46 In syngas PICVD, Fe can come from carbon monoxide cylinders, in the form of iron pentacarbonyl (Fe(CO)5). This compound is generated in small concentrations over extended periods in CO cylinders51,52 and happens to be photo-active in the UVC range.53 The peak deconvolution of the Fe2p spectrum (Figure 1d) showed two main phases. Phase A was composed of Fe2p3/2 (BE ≅ 710.2 eV) and Fe2p1/2 (BE ≅ 724.5 eV); these were assigned to iron oxide, either in the free state or in chemical bonds with the organic film (e.g. O–Fe, and O=C–O–Fe), with satellite peaks at BE ≅ 718.3 eV (Fe2p3/2 satellite) and BE ≅ 732.5
1 2 3 4 5 6 7 8 9 10 11 12 13 14 15 16 17 18 19 20 21 22 23 24 25 26 27 28 29 30 31 32 33 34 35 36 37 38 39 40 41 42 43 44 45 46 47 48 49 50 51 52 53 54 55 56 57 58
eV (Fe2p1/2 satellite). Based on the literature,46,54-57 for iron sub-oxides such as FeO (Fe2+), Fe2O3 (Fe3+) and Fe3O4 (Fe8/3+), binding energy of Fe2p3/2 spectra are 709.1-710.7, 710.6-711.5 and 707.90-710.7 eV, respectively. Thus, the binding energies in phase A corresponded to either Fe3+ in Fe2O3 or Fe8/3+ in Fe3O4. Phase B corresponded to the Fe2p3/2 and Fe2p1/2 peaks located at BE ≅ 713.4 and 726.3 eV, which can be assigned to Fe–O–C and Fe–(OH)3. This indicates that Fe(CO)5 is fully decomposed and converted to iron oxide which had been incorporated in the chemical structure of deposited film.
A complementary characterization of chemical bonds between the silicon wafer and the carbon film was then performed by TOF-SIMS analysis. The latter provided more chemical information on the deposited film and further supported our XPS results (Figure 2).
(a)
(b)
Figure 2. TOF-SIMS spectra for coated coupons in experiment #1 (Table 1S): (a) Positive ion and (b) negative ion. 1 2 3 4 5 6 7 8 9 10 11 12 13 14 15 16 17 18 19 20 21 22 23 24 25 26 27 28 29 30 31 32 33 34 35 36 37 38 39 40 41 42 43 44 45 46 47 48 49 50 51 52 53 54 55 56 57 58 59
TOF-SIMS results can be divided into three main categories:
(1) Hydrocarbons: Both in the acquired positive and negative spectra, the expected CnHm fragments of light polymer-like species were detected. Positive ion spectra suggested that a great number of C2H2+, C2H3+, C2H5+, C3H3+, C3H7+, C4H9+, C5H9+, C6H5+, C6H6+, C7H7+, C8H7+, C8H13+, C9H7+, C9H15+, C10H8+, C11H9+, up to C12H8+ ions at m/z = 26, 27, 29, 39, 43, 57, 69, 77, 78, 91, 103, 109, 115, 123, 128, 141, and 152, respectively, were generated by the PICVD treatment. These fragments could be either linear or cyclical. Similar observations have been made in the negative iron spectrum at m/z = 24, 37, 48, 49, 51, 60, 61, 64, 65, 72, 78, 83, and 96 corresponding to C2-, C3H-, C4-, C4H-, C4H3-, C5-, C5H-, C5H4-, C5H5-, C6-, C6H6-, C7-, and C8- ions, respectively. Moreover, some fragments with O in CnHmOy formula like COOH-, C3H3O2-, C5H5O-, C6H5O-, and C7H6O- were detected at m/z = 44, 71, 81, 93, and 106, respectively. These species were related to the carboxylic acid, anhydride and ketone (Figure 4S).
(2) Iron: The spectrum obtained from the positive ions was dominated by peaks representing iron ions. The strongest peaks at m/z = 56 corresponded to Fe+; whereas, the other peaks at m/z = 57, 68, 69, 70, 71, 72, 73, 80, 84, 85, 86, 89, 96, 101, 112, 124, 128, 132, and 136 in the positive ion spectrum corresponded to different species in the form Fe+, FeH+, and FexOyHmCn+, e.g., FeH+, CFe+, FeCH+, CH2Fe+, FeCH3+, FeO+, FeOH+, C2Fe+, COFe+, FeCOH+, CH2OFe+, FeCOH3+, C2OFe+, FeCOOH+, Fe2+, CFe2+, Fe2O+, C5OFe+, and C2Fe2+, respectively. Despite these peaks, there was no peak related to the Fe(CO)5 in the negative/positive ion spectra of TOF-SIMS confirming our XPS results indicating this compound was fully decomposed. Several combinations of iron oxide species (e.g. Fe2O2+, Fe3O+, Fe3O2+, Fe4O2+) were also found at m/z ranging from 148 to 503. These fragments were also observed in the negative ion mode, as well as fragments in the form of FeOH−, FexOyHmCn− and OH− species.
(3) Silicon: The relevant negative and positive ions spectra for silicon showed the presence of Si+, SiC+, SiHO+, SiOCH3+, SiOC2H6+ (m/z = 28, 44, 45, 59, 74, respectively) and their relevant negative
1 2 3 4 5 6 7 8 9 10 11 12 13 14 15 16 17 18 19 20 21 22 23 24 25 26 27 28 29 30 31 32 33 34 35 36 37 38 39 40 41 42 43 44 45 46 47 48 49 50 51 52 53 54 55 56 57 58
ions such as SiCO-, SiC2O-, SiC2OH-( at m/z = 56, 68, 69, respectively). These results corroborated the suspected structure obtained from XPS.
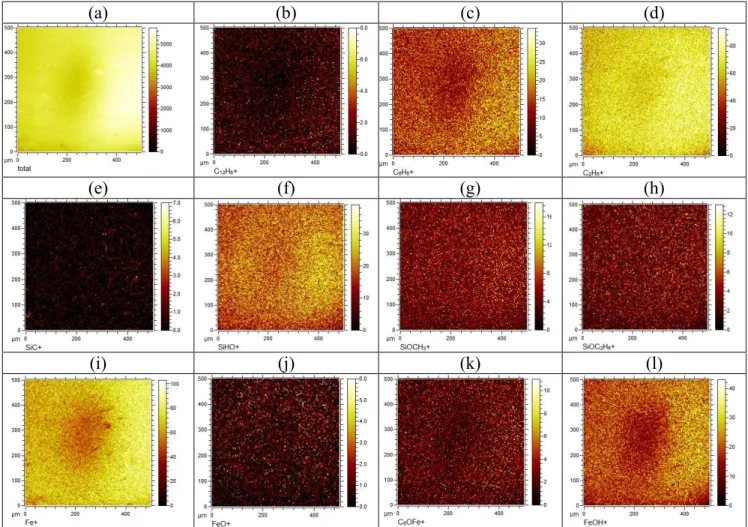
In addition, to confirm the chemical structure of the thin film, TOF-SIMS helped us to investigate the abundance and homogeneity of deposited chemical moieties. Thus, ion imaging was carried out on a deposited film (experiment #1, Table 1S) to identify the ion fragments in the film and their micro-scale spatial distribution (Figure 3). We have applied a pixel-by-pixel normalization with respect to the total ion counts. Integrated mass spectrum at each pixel (Figure 3a) for all images has been performed. This removed any effect of preferential sputtering and secondary ion yield effects due to topography.
Figure 3b-d show the spatial distribution of some light hydrocarbons. C2H2+, C2H5+, C3H3+, … C12H8+ were observed with dominant distribution of C2 > C3 > C4 aliphatic branches. The maximum number of carbon in the polymer reached C12. Also, aromatic structures were detected in the deposited film, most likely phenol, which is in agreements with previous results.9 Results from these images and TOF-SIMS ion spectra showed formation of acid anhydride, aldehyde, ketones, carboxylic, and hydroxyl groups as well.
Figure 3e-h are representative of the spatial distribution of Si ions at the interface between the deposited film and substrate. The SiC distribution images corroborated the formation of covalent bonds between the oligomeric film and the substrate, previously identified by XPS. Moreover, the structures of these covalent bonds are mainly in the form of SiOCH3 and SiO(CH3)2 at the silicon wafer/deposited film interface. Considering the presence of SiHO+ but not SiO2 in the sample, the interface consisted mainly of SiOH groups.
Figure 3i-l represent some of the iron fragments in the deposited film. Most of the iron in the film was in the form of iron oxide (especially Fe+) and iron hydroxyl (FeOH). Moreover, some iron was in the form of COFe+, C3OFe+, C5OFe+, etc. while the ion spectra detected Fe bonding to carbon (FeC+ and CH2Fe+, etc.).
1 2 3 4 5 6 7 8 9 10 11 12 13 14 15 16 17 18 19 20 21 22 23 24 25 26 27 28 29 30 31 32 33 34 35 36 37 38 39 40 41 42 43 44 45 46 47 48 49 50 51 52 53 54 55 56 57 58 59
(a) (b) (c) (d)
(e) (f) (g) (h)
(i) (j) (k) (l)
Figure 3. A series of positive ion spatially maps showing a 250 µm × 250 µm area of the coated surface normalized pixel by pixel with respect to the total counts images (a) (experiment #1-Table 1S). (a) total counts, (b) C12H8+, (c) C6H5+, (d) C2H5+, (e) SiC+, (f) SiHO+ , (g) SiOCH3+, (h) SiOC2H6+, (i) Fe+, (j) FeO+, (k) C5OFe+, (l) FeOH+.
3.2. Proposed mechanism
Based on the in-depth characterization of the chemical structure of the deposited films, we can shed a light on their growth mechanism. Based on the chemical characterization, C, O, H, Fe, Si are the elements existing in the samples. Si and partial O are from the substrate, while the other elements C, H,
1 2 3 4 5 6 7 8 9 10 11 12 13 14 15 16 17 18 19 20 21 22 23 24 25 26 27 28 29 30 31 32 33 34 35 36 37 38 39 40 41 42 43 44 45 46 47 48 49 50 51 52 53 54 55 56 57 58
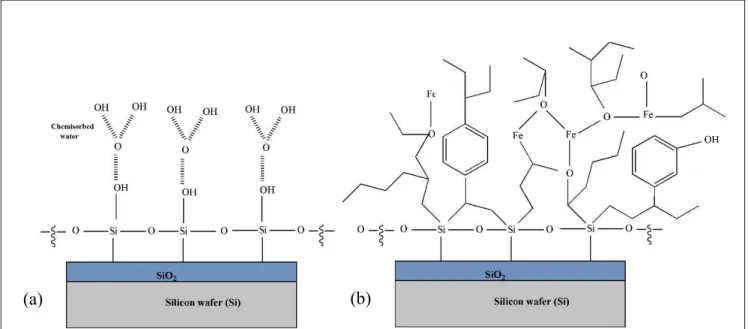
Fe and partial O are mainly coming from the reactive species. Figure 4a shows the chemical structure ofthe outmostlayer ofthesilicon wafersubstrate, which mainlyconsists of SiO2 and SiOH, and chemisorbed water. Since the reaction depends on the UV lamps, the absorption cross sections of the participating reactive species areinvestigated.
Hydrogen(H2) hasanionization potential of 15.42eVanda dissociationenergy of 4.52eV.37,58 Thus, photons at wavelengths below 80.4 nm and 274.3 nm are capable ofionizing and dissociating H2, provided they can be absorbed. However, H2 does not absorb light above 110.8 nm.37 Given that the UVC lamps used in this study emit at 253.7 nm (secondary peak at 185 nm), there will be no energy absorption. In other words, hydrogen cannot participateinthe reaction, unless excited by other molecules and radicals.
Carbon monoxide has an ionization potential of 14.01 eV59 and a dissociation energy of 11.14 eV.58 This correspondsto a potential forionization and dissociation at wavelengths below 88.5 nm and 112.3 nm,respectively. COcanabsorblightat wavelengthsshorterthan 200 nm,37 which means that the secondaryemission peakat 185 nmcantransmit 6.7 eV ofenergytothe molecule. Whilethisis insufficient forionization or full dissociation,itis enoughto dissociate a constituent π bond (3.7 eV)in CO or cause COto activatethrough vibrational excitation.35
Iron pentacarbonyl(Fe(CO)5)fedconcurrently withthe CO gas,51,52 has an ionization potential of 8.35 eV and dissociation energy of 0.37 eV,60,61 correspondingto wavelengths of 148.5 nm and 3350.5 nm,respectively. Fe(CO)5 has strong absorption at 253.7 nm wavelength. It istherefore ableto dissociate, resultinginthe formation of extra radicals.53,62
Thus,the main reactive components following UVirradiation are vibrationally excited CO (CO*), or CO radicals (CO•) with dissociated π bonds and CO• stemming from Fe(CO)
5 dissociation. Based on these postulations, two colliding CO* molecules will form a highly unstable unit. Once excess energy has been dissipated via collisions ofthe nascent cluster with H2 molecules,lightly polymerized carbon
1 2 3 4 5 6 7 8 9 10 11 12 13 14 15 16 17 18 19 20 21 22 23 24 25 26 27 28 29 30 31 32 33 34 35 36 37 38 39 40 41 42 43 44 45 46 47 48 49 50 51 52 53 54 55 56 57 58 59
species (mostly consisting of aliphatic chains with C2>C3>C4) will be formed.35,36,63 Iron pentacarbonyl can also play a catalytic role for isomerization of olefins and can increase the formation of alcohols on the film instead of carboxylic groups.64
Based on the previously identified chemical bonds, as well as the existing Fisher-Tropsch literature,35,36,53,64 we present a series of possible chemical reactions. Initiation mechanisms are based on the absorption cross section, while propagation and termination are based on the structure we obtained and known syngas chemical reactions:
Initiation Propagation (9) (10) Termination Paraffins (18) Olefins (19) Water-gas shift (20)
Reaction (7) is endothermic (16.4 kcal mol-1), which makes this reaction most likely irreversible. It needs 20 kcal mol-1 activation energy, provided mostly through exothermic reactions (such as (4), which gives off 17 kcal mol-1).35 On the other hand, for most free-radical polymeric chain reactions,
1 2 3 4 5 6 7 8 9 10 11 12 13 14 15 16 17 18 19 20 21 22 23 24 25 26 27 28 29 30 31 32 33 34 35 36 37 38 39 40 41 42 43 44 45 46 47 48 49 50 51 52 53 54 55 56 57 58
vibrational excitation is key to provide the driving force for propagation step. As such, reaction (13) must maintain this driving force by transferring vibrational energy to CO, otherwise the reaction would move towards termination.35 These pathways are based on observations by Roussel and Back, who had conducted research on the photochemistry of CO/H2 mixtures irradiated with light at 193.3 nm (similar to the secondary emission peak of our Hg lamps).
This proposed series of reactions leads to the formation of light paraffins, olefins and iron oxide on the surface of the Si substrate (with water as an expelled by-product) (Figure 4b). Most reactive species are bonded to iron and also can react with either hydroxyl groups on the Si surface or directly with Si to bond covalently. XPS and TOF-SIMS results indicate that the film is composed of aliphatic branches and aromatic structure (most likely phenol, given the presence of C6H5O- at m/z = 93, supported by previous analyses9), as well as acid anhydride, ketones, carboxylic, and hydroxyl moieties.
Figure 4. Schematic of (a) bare silicon wafer (b) deposited oligomeric film on silicon wafer.
(a) (b) 1 2 3 4 5 6 7 8 9 10 11 12 13 14 15 16 17 18 19 20 21 22 23 24 25 26 27 28 29 30 31 32 33 34 35 36 37 38 39 40 41 42 43 44 45 46 47 48 49 50 51 52 53 54 55 56 57 58 59
Chemical characterization results showed uniform distribution of chemical bonds in the deposited film. These observations triggered us to explore if we have same uniformity in the morphology and texture of the deposited film.
3.3. Surface morphology and topography
The electron micrographs of a coated silicon substrate (Figure 5b, 5c) reveal the formation of a textured, particle-like morphology with many micro patterns and trenches along the deposited film. This surface morphology is corroborated by AFM (Figure 5d), showing that the features have a trench size on the order of 40 nm. Such island-like deposition is consistent with previous investigations on PICVD.9 This textured morphology is observed even for very low film thickness (treatment duration t = 30min). The trenches are filled in as treatment duration increases, leading to a more uniform film (see Supplementary Figure 5S profilometry results).
This kind of trench morphology of film formation is common especially in the case of transient metals,65 and can be explained in our case by the involvement of iron and iron oxide in the deposition reaction. Film deposition in this case follows the Volmer–Weber (VW) growth mode (3D morphology, island growth) and allows us to gain information on the surface tension of the film through Bauer’s criterion (γfilm >> γsubstrate, γsubstrate = 44.16 mJ/m2, Figure 5e).66 Control of the film morphology (and therefore macroscopic properties such as wettability) is the focus of on-going work, namely through the action of treatment pressure.
Through energy-dispersive X-ray spectroscopy (EDS), SEM measurements allowed us to further confirm the uniform elemental distribution and composition of the films (Figure 6S). Bare silicon substrates show mainly Si and O, with some C (Figure 6Sa) – C attributable to contamination,42,43 while the coated sample (Figure 6Sb) exhibits an increase in the C peak and the presence of an Fe peak in the deposited film. The mapping analyses of bare and coated samples in Figures 6Sc-f confirm the
1 2 3 4 5 6 7 8 9 10 11 12 13 14 15 16 17 18 19 20 21 22 23 24 25 26 27 28 29 30 31 32 33 34 35 36 37 38 39 40 41 42 43 44 45 46 47 48 49 50 51 52 53 54 55 56 57 58
formation of a film (clear contrast with the reference area covered with Kapton tape during treatment). As we move further to the right-hand side, the amounts of Fe and C increase.
The film also exhibits stability to solvent attacks, resisting immersion for 1 hour in chloroform (Table 2S), in agreement with previous work showing stability with respect to solvents. 9
(a) (b)
(c) (d)
(e)
Figure 5. (a) Coated silicon coupon, (b) and (c) FESEM images of deposited film, (d) 3D AFM image of deposited thin film in experiment #1, (e) Bauer’s thermodynamic film growth study with respect to surface tensions.
Si wafer covered with Kapton tape Deposited film
Si wafer covered with Kapton tape Deposited film γfilm >> γsubstrate γfilm ≤ γsubstrate 1 2 3 4 5 6 7 8 9 10 11 12 13 14 15 16 17 18 19 20 21 22 23 24 25 26 27 28 29 30 31 32 33 34 35 36 37 38 39 40 41 42 43 44 45 46 47 48 49 50 51 52 53 54 55 56 57 58 59
3.4. Processing parameters
In an effort to control the thickness of the films deposited through syngas PICVD, we conducted a series of experiments focusing on two main parameters (i) residence time and (ii) treatment duration of experiments.
The time during which the interactions between the UV light and the gas precursors occur, resulting in the production of reactive species, depends on the gas residence time (τ). It can be calculated from Equation 1, in which V stands for the reactor volume and Q for the gas precursors volumetric flow rate. For a constant reactor volume, decreasing the flow rate leads to longer precursor residence time and saves consumption of gas precursors, which can be important from an operational point of view.
Equation 1
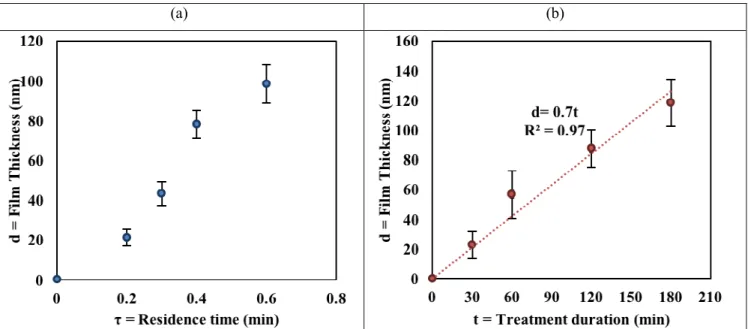
Using a constant gas feed pressure (40 psi), a volumetric precursor ratio (CO/H2) of 1 and a total gas flow rate varying from 0.4 to 1 L/min for a 120 min treatment duration, we varied the reactor residence times from 0.6 to 0.2 min (Table 1S). Film thickness (assessed through profilometry) and elemental distribution (determined from XPS measurements) are given as a function of residence time in Figures 6a and 2S.
As deduced from Figure 6a, the film thickness increased with residence time. Linear regression (R2 = 0.95) indicates accumulation at a rate of approximately 165 nm of film per minute of residence time (note that τ = 0 corresponds to an untreated, bare substrate), though the shape of the curve more closely resembles a sigmoid (indicating diminishing returns at longer residence times). The bare substrate was composed primarily of Si and O, along with some C attributable to contaminants42,43 (Figure 2S). For coated substrates (τ = 0.2 – 0.6 min), the C atomic percentage increased to a uniform value of approximately 30%, while Si decreases significantly, indicating that the substrate was masked. The
1 2 3 4 5 6 7 8 9 10 11 12 13 14 15 16 17 18 19 20 21 22 23 24 25 26 27 28 29 30 31 32 33 34 35 36 37 38 39 40 41 42 43 44 45 46 47 48 49 50 51 52 53 54 55 56 57 58
elemental distribution did not vary as a function of τ, indicating that film composition and thickness were independent. Also, despite XPS’ shallow probing depth (∼10 nm), Si remained visible on the thicker films which is explained by the morphology of the film (see section 3.3).
In order to increase the thickness of the deposited films while decreasing precursor consumption (i.e. at longer residence time), we increased the treatment duration. Figure 6b shows the effect of treatment duration (30 to 180 min treatment duration, at a fixed residence time of τ = 0.6 min) on film thickness. Full thickness profiles are available in Supplementary Figure 5S. As expected, film thickness increased linearly with treatment duration,18,44at a rate of 0.7 nm/min for τ = 0.6 min.
(a) (b)
Figure 6. (a) Profilometry film growth results vs. residence time (experiments # 1 to # 4, Table 1S; error bars indicate the 95% confidence interval (95%CI)); (b) Variation of film thickness as a function of treatment duration (Data correspond to experiments # 5 to # 8, Table 1S; error bars indicate the 95%CI).
As already noted for residence time experiments, the amount of Si significantly decreased in the treated samples compared to the bare one. Furthermore, the Si At % decreased with increasing deposition time until 120 min, where it reached a plateau (Figure 3S). This would warrant that by
1 2 3 4 5 6 7 8 9 10 11 12 13 14 15 16 17 18 19 20 21 22 23 24 25 26 27 28 29 30 31 32 33 34 35 36 37 38 39 40 41 42 43 44 45 46 47 48 49 50 51 52 53 54 55 56 57 58 59
increasing the treatment duration, trenches are masked in the deposited film and a more uniform film is achieved, which is confirmed by profilometry analyses (Supplementary results, Figure 5S).
These findings are important in two respects: first, both the residence time and treatment duration affect the film growth and thickness. Second, lower treatment duration or residence times lead to a less homogeneous film texture (Si visible at low t and low τ). Finally, combining longer residence time and varying treatment duration allows for control over the thickness of the film while limiting gas precursor consumption. After 60 min of treatment, there is no statistically significant evolution in the elemental composition of the film (Figure 3S). We suspect that, before 60 min, the observed difference is attributed to the fact that the substrate is not completely covered (trenches in the film).
These treatment duration experiments also provide insight into the reaction mechanism. As described in the experimental section, temperature increases as a function of time during treatment, because of heat given off by the UVC lamps. The fact that the deposition rate does not decrease as a function of time (and therefore increasing temperature, and correspondingly decreased reagent adsorption) may indicate that the overall reaction mechanism is kinetically limited. However, there is also evidence to suggest that mass transport may be limiting the overall mechanism, given that one key reagent (iron pentacarbonyl) is present at very low concentrations. On-going work is focusing on decoupling time and temperature to better assess this phenomenon.
We have shown that film composition is independent of residence time and treatment duration, at a fixed precursor ratio. Given the insights gained from the reaction mechanism, there is reason to believe that varying the precursor ratio may alter the composition and/or growth of the organic film. To investigate this, the gas ratio (CO/H2) was varied from 0.3 to 3, while the residence time and treatment duration were kept constant at 0.3 min and 2h respectively (Table 1S). Figures 7S and 8S show that the variation of gas ratio does not a significant effect both in terms of film growth and chemical composition. The absence of a measurable chemical change after changing the precursor ratio is
1 2 3 4 5 6 7 8 9 10 11 12 13 14 15 16 17 18 19 20 21 22 23 24 25 26 27 28 29 30 31 32 33 34 35 36 37 38 39 40 41 42 43 44 45 46 47 48 49 50 51 52 53 54 55 56 57 58
intriguing, as our previous work had indicated changes in macro-level properties (wettability) as a function of ratio.9 To confirm, we tested three samples with CO/H2 ratio = 0.3, 1 and 3 (minimum, middle, and maximum) with TOF-SIMS. Three spots were analyzed on each sample and their spectra were compared to ensure they were representative the whole sample (Figures 9S and 10S); these corroborate the high resolution XPS results. Based on these findings, we can conclude that any wettability change previously observed is not likely to be a result of a chemical change, but rather a morphology change on the surface.
4. CONCLUSIONS
Through this work, we have gained insight into the growth mechanism of a novel deposition approach (syngas PICVD) and proposed a reaction scheme. Both XPS and TOF-SIMS reveal the formation of covalently bonded oligomeric film with aliphatic branches and aromatic structure (most likely phenol), as well as acid anhydride, ketones, carboxylic, and hydroxyl moieties. Moreover, we have shown that film thickness can be controlled through treatment duration (as expected), but also through residence time (a feature specific to atmospheric pressure deposition processes). This gives us an ability to control thickness while minimizing precursor consumption. Interestingly, altering the precursor gas ratio does not affect the final composition of the film. However, equal parts seem best suited to provide a slightly thicker film.
Despite these significant findings, a number of potential challenges still exist and are the focus of on-going work, including: (i) the control over Fe contaminants and their role in dictating the reaction regime, (ii) understanding the effect of operating pressure, (iii) relating macroscopic surface properties (wettability) to the observed microstructure, and (v) enhancing functional moieties through additives (H2O2, NH3, etc.). Overall, the development of syngas PICVD shows promise for application in the coatings industry. 1 2 3 4 5 6 7 8 9 10 11 12 13 14 15 16 17 18 19 20 21 22 23 24 25 26 27 28 29 30 31 32 33 34 35 36 37 38 39 40 41 42 43 44 45 46 47 48 49 50 51 52 53 54 55 56 57 58 59
! ASSOCIATED CONTENT Supporting Information
The Supporting Information is available free of charge on the ACS Publications website at DOI: The profilometry thickness profiles, XPS survey results vs. residence time and treatment duration, as well as TOF-SIMS results due to the ratio variation and EDS micrographs of treated sample.
! AUTHOR INFORMATION Corresponding Author
*Corresponding author. Tel.: +1 514 340 4711 Ext. 2326; fax: +1 514 340 4159. E-mail address: jason.tavares@polymtl.ca (J.R. Tavares).
Author Contributions
The manuscript was written through contributions of all authors: Donya Farhanian. Author-One, Prof. Gregory De Crescenzo. Author-Two, Prof. Jason R. Tavares. Corresponding Author*. All authors have given approval to the final version of the manuscript.
Funding Sources
- Fonds de Recherche du Québec en Nature et Technologies (FRQNT) and Hydro-Québec (D. Farhanian)
- Natural Sciences and Engineering Research Council of Canada (NSERC), Canadian Foundation for Innovation (CFI) and École Polytechnique de Montréal (J.R. Tavares)
- Canada Research Chairs program (CRC) (G. De Crescenzo)
1 2 3 4 5 6 7 8 9 10 11 12 13 14 15 16 17 18 19 20 21 22 23 24 25 26 27 28 29 30 31 32 33 34 35 36 37 38 39 40 41 42 43 44 45 46 47 48 49 50 51 52 53 54 55 56 57 58
Notes
The authors declare no competing financial interest.
! ACKNOWLEDGMENT
The authors gratefully acknowledge funding support from the Fonds de Recherche du Québec en Nature et Technologies (FRQNT), the Natural Sciences and Engineering Research Council of Canada (NSERC), Hydro-Québec, the Canadian Foundation for Innovation (CFI), the Canada Research Chairs program (CRC), as well as École Polytechnique de Montréal. The authors further acknowledge the collaboration of Dr. H. Monajati from École de technologie supérieure (ETS), Dr J. Lefebvre (École Polytechnique de Montréal) and Mr. C. Clement (Université de Montréal) for SEM, XPS and profilometry measurements. Furthermore, the authors thank the Centre for Characterization and Microscopy of Materials (CM2) of École Polytechnique de Montréal, Prof. C. Pellerin and Dr. X. Wang from the Chemistry Department of Université de Montréal for kind help for FTIR measurement. Special thanks goes to Ms. M. Xu for support during the experiments and members of the photochemical surface engineering laboratory (PhotoSEL) for their valuable discussions and comments.
REFERENCES
(1) Deng, J. P.; Wang, L. F.; Liu, L. Y.; Yang, W. T. Developments and New Applications of UV-Induced Surface Graft Polymerizations. Prog. Polym. Sci. 2009, 34, 156-193.
(2) Vossen, J. L.; Kern, W. In Thin Film Processes II; Academic Press, the University of Michigan, US, 1991; Vol. 2, pp. 443-500.
1 2 3 4 5 6 7 8 9 10 11 12 13 14 15 16 17 18 19 20 21 22 23 24 25 26 27 28 29 30 31 32 33 34 35 36 37 38 39 40 41 42 43 44 45 46 47 48 49 50 51 52 53 54 55 56 57 58 59
(3) S. B. Herner, In Handbook of Thin Film Deposition, Third Edition; Macleod, A.; Petti, C. J.; Hilali, M. M.; Prabhu, G., Eds.; William Andrew Publishing: Oxford, UK, 2012; pp. 361-381.
(4) Macleod, A. 9 - Optical Thin Films A2 -, In Handbook of Thin Film Deposition, Third
Edition; Krishna, S. Eds.; William Andrew Publishing: Oxford, 2012; pp. 271-311.
(5) Petti, C. J.; Hilali, M. M.; Prabhu, G. 10 - Thin Films in Photovoltaics A2 - In Handbook of
Thin Film Deposition, Third Edition; Krishna, S. Eds.; William Andrew Publishing: Oxford,
2012; pp.313-359.
(6) Kango, S.; Kalia, S.; Celli, A.; Njuguna, J.; Habibi, Y.; Kumar, R. Surface Modification of Inorganic Nanoparticles for Development of Organic-Inorganic Nanocomposites-A Review.
Prog. Polym. Sci. 2013, 38, 1232-1261.
(7) Broer, D. J.; Mol, G. N.; van Haaren, J. A. M. M.; Lub, J. Photo-Induced Diffusion in Polymerizing Chiral-Nematic Media. Adv. Mater. 1999, 11, 573-578.
(8) Chan, K.; Gleason, K. K. Photoinitiated Chemical Vapor Deposition of Polymeric Thin Films using a Volatile Photoinitiator. Langmuir. 2005, 21(25), 11773-11779.
(9) Dorval Dion, C. A.; Raphael, W.; Tong, E.; Tavares, J. R. Photo-Initiated Chemical Vapor Deposition of Thin Films using Syngas for the Functionalization of Surfaces at Room Temperature and Near-Atmospheric Pressure. Surf. Coat. Technol. 2014, 244, 98-108.
(10) Lau, K. K. S.; Gleason, K. K. Initiated Chemical Vapor Deposition (iCVD) of Copolymer Thin Films. Thin Solid Films. 2008, 516, 678-680.
1 2 3 4 5 6 7 8 9 10 11 12 13 14 15 16 17 18 19 20 21 22 23 24 25 26 27 28 29 30 31 32 33 34 35 36 37 38 39 40 41 42 43 44 45 46 47 48 49 50 51 52 53 54 55 56 57 58
(11) Elsner, C.; Naumov, S.; Zajadacz, J.; Buchmeiser, M. R. 172 nm Excimer VUV-Triggered Photodegradation and Micropatterning of Aminosilane Films. Thin Solid Films. 2009, 517, 6772-6776.
(12) Prager, L.; Wennrich, L.; Heller, R.; Knolle, W.; Naumov, S.; Prager, A.; Decker, D.; Liebe, H.; Buchmeiser, M. R. Vacuum-UV Irradiation-Based Formation of Methyl-Si-O-Si Networks from Poly(1,1-Dimethylsilazane-Co-1-Methylsilazane). Chemistry. 2009, 15, 675-683.
(13) Ruiz, J. C.; Girard-Lauriault, P. L.; Truica-Marasescu, F.; Wertheimer, M. R. Plasma- and Vacuum-Ultraviolet (VUV) Photo-Polymerisation of N- and O-Rich Thin Films. Radiat. Phys.
Chem. 2010, 79, 310-314.
(14) Scherzer, T. VUV-Induced Photopolymerization of Acrylates. Macromol. Chem. Phys. 2012,
213, 324-334.
(15) Skurat, V. Vacuum Ultraviolet Photochemistry of Polymers. Nucl. Instr. Meth. Phys. Res. B. 2003, 208, 27-34.
(16) Truica-Marasescu, F.; Guimond, S.; Wertheimer, M. R. VUV-Induced Nitriding of Polymer Surfaces: Comparison with Plasma Treatments in Nitrogen. Nucl. Instr. Meth. Phys. Res. B. 2003, 208, 294-299.
(17) Truica-Marasescu, F.; Pham, S.; Wertheimer, M. R. VUV Processing of Polymers: Surface Modification and Deposition of Organic Thin Films. Nucl. Instr. Meth. Phys. Res. B. 2007, 265, 31-36. 1 2 3 4 5 6 7 8 9 10 11 12 13 14 15 16 17 18 19 20 21 22 23 24 25 26 27 28 29 30 31 32 33 34 35 36 37 38 39 40 41 42 43 44 45 46 47 48 49 50 51 52 53 54 55 56 57 58 59
(18) Truica-Marasescu, F.; Ruiz, J. C.; Wertheimer, M. R. Vacuum-Ultraviolet (VUV) Photo-Polymerization of Amine-Rich Thin Films from Ammonia-Hydrocarbon Gas Mixtures. Plasma
Process. Polym. 2012, 9, 473-484.
(19) Truica-Marasescu, F.; Wertheimer, M. R. Vacuum-Ultraviolet Photopolymerisation of Amine-Rich Thin Films. Macromol. Chem. Phys. 2008, 209, 1043-1049.
(20) Kogelschatz, U.; Esrom, H.; Zhang, J. Y.; Boyd, I. W. High-Intensity Sources of Incoherent UV and VUV Excimer Radiation for Low-Temperature Materials Processing. Appl. Surf. Sci. 2000, 168, 29-36.
(21) Elsner, C.; Lenk, M.; Prager, L.; Mehnert, R. Windowless Argon Excimer Source for Surface Modification. Appl. Surf. Sci. 2006, 252, 3616-3624.
(22) Kowalski, W. In Ultraviolet Germicidal Irradiation Handbook: UVGI for Air and Surface
Disinfection; Springer Berlin Heidelberg, 2010; p. 17.
(23) Okabe, H. Photochemistry of small molecules; Wiley: New York, US, 1978; Vol. 431, pp. 37-58.
(24) Evans, R. C.; Douglas, P.; Burrow, H. D. Foundations of Photochemistry: A Background on the Interaction Between Light and Molecules. Applied Photochemistry; Springer Netherlands, 2014.
(25) Wang, H. L.; Xu, S. P.; Shi,W. F. Photopolymerization Behaviors of Hyperbranched Polyphosphonate Acrylate and Properties of the UV Cured Film. Prog. Org. Coat. 2009, 65, 417-424. 1 2 3 4 5 6 7 8 9 10 11 12 13 14 15 16 17 18 19 20 21 22 23 24 25 26 27 28 29 30 31 32 33 34 35 36 37 38 39 40 41 42 43 44 45 46 47 48 49 50 51 52 53 54 55 56 57 58
(26) Yagci, Y. New Photoinitiating Systems Designed for Polymer/Inorganic Hybrid Nanocoatings. J. Coating. Tech. Res. 2009, 9, 125-134.
(27) Allen, N. S. J. Photoinitiators for UV and Visible Curing of Coatings: Mechanisms and Properties. Photoch. Photobio. A. 1996, 100, 101-107.
(28) Decker, C. Photoinitiated Crosslinking Polymerisation. Prog. Polym. Sci. 1996, 21, 593-650.
(29) Kasparek, E.; Tavares, J. R.; Wertheimer, M. R.; Girard-Lauriault, P.-L. Sulfur-Rich Organic Films Deposited by Plasma- and Vacuum-Ultraviolet (VUV) Photo-Polymerization. Plasma
Process. Polym. 2016, 13. 888–899.
(30) Van Steen, E.; Schulz, H. Polymerisation Kinetics of the Fischer–Tropsch CO Hydrogenation using Iron and Cobalt Based Catalysts. Appl. Catal. A. 1999, 186, 309-320.
(31) Vosloo, A. C. Fischer-Tropsch: a Futuristic View. Fuel Process. Technol. 2001, 71, 149-155.
(32) Yao, Y.; Liu, X.; Hildebrandt, D.; Glasser, D. Fischer–Tropsch Synthesis using H2/CO/CO2 Syngas Mixtures: a Comparison of Paraffin to Olefin Ratios for Iron and Cobalt Based Catalysts. Appl. Catal. A. 2012, 433-434, 58-68.
(33) Zhang, C. H.; Zhao, G. Y.; Liu, K. K.; Yang, Y.; Xiang, H. W.; Li, Y. W. Adsorption and Reaction of CO and Hydrogen on Iron-Based Fischer-Tropsch Synthesis Catalysts. J. Mol.
Catal. A: Chem. 2010, 328, 35-43.
(34) Zhang, Y. Q.; Jacobs, G.; Sparks, D. E.; Dry, M. E.; Davis, B. H. CO and CO2 Hydrogenation Study on Supported Cobalt Fischer-Tropsch Synthesis Catalysts. Catal. Today. 2002, 71, 411-418. 1 2 3 4 5 6 7 8 9 10 11 12 13 14 15 16 17 18 19 20 21 22 23 24 25 26 27 28 29 30 31 32 33 34 35 36 37 38 39 40 41 42 43 44 45 46 47 48 49 50 51 52 53 54 55 56 57 58 59
(35) Roussel, P. B.; Back, R. A. Photochemistry of CO-H2 Mixtures Irradiated at 193.3 nm. J.
Photochem. Photobiol. A. 1990, 52, 235-239.
(36) J. S. Wen, J. P. Pinto, Y. L. Yung. Photochemistry of CO and H2O: Analysis of Laboratory Experiments and Applications to the Prebiotic Earth's Atmosphere. J. Geophys. Res. 1989, 94, 14957.
(37) Yung, Y. L.; De More, W. B. In Photochemistry of Planetary Atmospheres, Oxford University Press, 1999; p. 37-40.
(38) Farhanian, D.; Dorval Dion, C. A.; Raphael, W.; De Crescenzo, G.; Tavares, J. R. Combined Extraction and Functionalization of Low-Cost Nanoparticles from Municipal Solid Waste Fly Ash through PICVD. J. Environ. Chem. Eng. 2014, 2, 2242-2251.
(39) Javanbakht, T.; Raphael, W.; Tavares, J. R. Physicochemical Properties of Cellulose Nanocrystals Treated by Photo-Initiated Chemical Vapour Deposition (PICVD). Can. J. Chem.
Eng. 2016, 94, 1135-1139.
(40) Javanbakht, T.; Laurent, S.; Stanicki, D.; Raphael, W.; Tavares, J. R. Charge Effect of Superparamagnetic Iron Oxide Nanoparticles on their Surface Functionalization by Photo-Initiated Chemical Vapour Deposition. J. Nanopart. Res. 2015, 17, 1-11.
(41) Labonté, V.; Marion, A.; Virgilio, N.; Tavares, J. R. Gas-Phase Surface Engineering of Polystyrene Beads Used to Challenge Automated Particle Inspection Systems. Ind. Eng. Chem.
Res. 2016, 55 (27). 1 2 3 4 5 6 7 8 9 10 11 12 13 14 15 16 17 18 19 20 21 22 23 24 25 26 27 28 29 30 31 32 33 34 35 36 37 38 39 40 41 42 43 44 45 46 47 48 49 50 51 52 53 54 55 56 57 58
(42) Robinson, R. E.; Sandberg, R. L.; Allred, D. D.; Jackson, A. L.; Johnson, J. E.; Evans, W.; Doughty, T.; Baker, A. E.; Adamson, K.; Jacquier, A. Removing Surface Contaminants from
Silicon Wafers to Facilitate EUV Optical Characterization, Society of Vacuum Coaters, 2004.
(43) Robinson, R. degree of Bachelor of Science in Department of Physics and Astronomy, Brigham Young University, August, 2003.
(44) Stewart, T. B.; Arnold, G. S.; Hall, D. F.; Marten, H. D. Absolute Rates of Vacuum Ultraviolet Photochemical Deposition of Organic Films. J. Phys. Chem. 1989, 93, 2393-2400.
(45) Deal, B. E.; Helms, C. R. In The Physics and Chemistry of SiO2 and the Si-SiO2 Interface; Springer: US, 2013.
(46) Briggs, D. In Handbook of X-ray Photoelectron Spectroscopy; Wanger, C. D.; Riggs, W. M.; Davis, L. E.; Moulder, J. F.; Muilenberg, G. E., Eds.; Perkin-Elmer Corp., Physical Electronics Division, Eden Prairie: Minnesota, USA, 1979; pp. 190- 195.
(47) Yoshimizu, M.; Kobayashi, R.; Saegusa, M.; Takashima, T.; Funakubo, H.; Akiyama, K.; Matsumoto, Y.; Irie, H. Photocatalytic Hydrogen Evolution Over β-Iron Silicide Under Infrared-Light Irradiation. Chem. Commun. (Camb) 2015, 51, 2818-2820.
(48) Rugner, K.; Reuter, R.; Ellerweg, D.; de los Arcos, T.; von Keudell, A.; Benedikt, Insight into the Reaction Scheme of SiO2 Film Deposition at Atmospheric Pressure. J. Plasma Process.
Polym. 2013, 10, 1061-1073.
(49) Cao, Q.; Sylvain, C. Organic Layer-Coated Metal Nanoparticles Prepared by a Combined Arc Evaporation/Condensation and Plasma Polymerization Process. Plasma Sources Sci. Technol. 2007, 16, 240. 1 2 3 4 5 6 7 8 9 10 11 12 13 14 15 16 17 18 19 20 21 22 23 24 25 26 27 28 29 30 31 32 33 34 35 36 37 38 39 40 41 42 43 44 45 46 47 48 49 50 51 52 53 54 55 56 57 58 59
(50) López, G. P.; Castner, D. G.; Ratner, B. D. XPS O 1s Binding Energies for Polymers Containing Hydroxyl, Ether, Ketone And Ester Groups. Surf. Interface Anal. 1991, 17, 267-272.
(51) Tepe, R. K.; Vassallo, D.; Jacksier, T.; Barnes, R. M. Iron Pentacarbonyl Determination in Carbon Monoxide. Spectrochim. Acta, Part B. 1999, 54, 1861-1868.
(52) Williams, T. C.; Shaddix, C. R. Contamination of Carbon Monoxide with Metal Carbonyls: Implications for Combustion Research. Combust. Sci. Technol. 2007, 179, 1225-1230.
(53) Kotzian, M.; Roesch, N.; Schroeder, H.; Zerner, M. C. Optical Spectra of Transition-Metal Carbonyls: Chromium Hexacarbonyl, Iron Pentacarbonyl, and Nickel Tetracarbonyl. J. Am.
Chem. Soc. 1989, 111, 7687-7696.
(54) Descostes, M.; Mercier, F.; Thromat, N.; Beaucaire, C.; Gautier-Soyer, M. Use of XPS in the Determination of Chemical Environment and Oxidation State of Iron and Sulfur Samples: Constitution of a Data Basis in Binding Energies for Fe and S Reference Compounds and Applications to the Evidence of Surface Species of an Oxidized Pyrite in a Carbonate Medium.
Appl. Surf. Sci. 2000, 165, 288-302.
(55) Grosvenor, A. P.; Kobe, B. A.; Biesinger, M. C.; McIntyre, N. S. Investigation of Multiplet Splitting of Fe 2p XPS Spectra and Bonding in Iron Compounds. Surf. Interface Anal. 2004, 36, 1564-1574.
(56) Fujii, T.; de Groot, F. M. F.; Sawatzky, G. A.; Voogt, F. C.; Hibma, T.; Okada, K. In Situ XPS Analysis of Various Iron Oxide Films Grown by NO2-Assisted Molecular-Beam Epitaxy. Phys.
Rev. B: Condens. Matter. 1999, 59, 3195-3202. 1 2 3 4 5 6 7 8 9 10 11 12 13 14 15 16 17 18 19 20 21 22 23 24 25 26 27 28 29 30 31 32 33 34 35 36 37 38 39 40 41 42 43 44 45 46 47 48 49 50 51 52 53 54 55 56 57 58
(57) Yamashita, T.; Hayes, P. Analysis of XPS Spectra of Fe2+ and Fe3+ Ions in Oxide Materials.
Appl. Surf. Sci. 2008, 254, 2441-2449.
(58) Darwent, B. d. In Bond Dissociation Energies in Simple Molecules [electronic resource]: U.S. Dept. of Commerce, National Bureau of Standards, US. 1970.
(59) Erman, P.; Karawajczyk, A.; Rachlewkallne, E.; Stromholm, C.; Larsson, J.; Persson, A.; Zerne, R. Direct Determination of the Ionization-Potential of Co by Resonantly Enhanced Multiphoton Ionization Mass-Spectroscopy. Chem. Phys. Lett. 1993, 215, 173.
(60) Junk Gregor, A.; Svec Harry, J. Energetics of the Ionization and Dissociation of Ni(CO)4, Fe(CO)5, Cr(CO)6, Mo(CO)6 And W(CO)6. in Zeitschrift für Naturforschung B, 1968, 23, 1.
(61) Distefano, G. Photoionization Study of Fe (CO)5 And Ni (CO)4. J. Res. Natl. Bur. Stand. Sect.
A. 1970, 74, 233-239.
(62) Harvey, J. N.; Aschi, M. Modelling Spin-Forbidden Reactions: Recombination of Carbon Monoxide with Iron Tetracarbonyl. Faraday. Discuss. 2003, 124, 129.
(63) Filseth, S. V. In Advances in Photochemistry; Pitts, J. N.; Hammond, G. S.; Gollnick, K.,Eds.; John Wiley & Sons, Ltd: New York, US, 2007; Vol. 10, pp. 12-17.
(64) Kummer, R. In New Synthesis with Carbon Monoxide; Springer-Verlag Berlin Heidelberg, 1982; Vol. 11, pp.156.
(65) Chambers, S. A. Epitaxial Growth and Properties of Thin Film Oxides. Surf. Sci. Rep. 2000,
39, 105. 1 2 3 4 5 6 7 8 9 10 11 12 13 14 15 16 17 18 19 20 21 22 23 24 25 26 27 28 29 30 31 32 33 34 35 36 37 38 39 40 41 42 43 44 45 46 47 48 49 50 51 52 53 54 55 56 57 58 59
(66) Brune, H. In Surface and Interface Science; Wiley-VCH Verlag GmbH & Co. KGaA, 2013; Vol. 4, pp 421.
Table of Contents/Abstract Graphic
Graphical abstract or TOC
1 2 3 4 5 6 7 8 9 10 11 12 13 14 15 16 17 18 19 20 21 22 23 24 25 26 27 28 29 30 31 32 33 34 35 36 37 38 39 40 41 42 43 44 45 46 47 48 49 50 51 52 53 54 55 56 57 58