HESSD
7, 7809–7838, 2010 Groundwater contribution to river flows – southern Quebec aquifer M. Larocque et al. Title Page Abstract Introduction Conclusions References Tables Figures J I J I Back CloseFull Screen / Esc
Printer-friendly Version Interactive Discussion Discussion P a per | Dis cussion P a per | Discussion P a per | Discussio n P a per |
Hydrol. Earth Syst. Sci. Discuss., 7, 7809–7838, 2010 www.hydrol-earth-syst-sci-discuss.net/7/7809/2010/ doi:10.5194/hessd-7-7809-2010
© Author(s) 2010. CC Attribution 3.0 License.
Hydrology and Earth System Sciences Discussions
This discussion paper is/has been under review for the journal Hydrology and Earth System Sciences (HESS). Please refer to the corresponding final paper in HESS if available.
Groundwater contribution to river flows –
using hydrograph separation,
hydrological and hydrogeological models
in a southern Quebec aquifer
M. Larocque1, V. Fortin2, M. C. Pharand1,*, and C. Rivard3
1
Centre de recherche pour l’ ´Etude et la Simulation du Climat `a l’ ´Echelle R ´egionale (ESCER), D ´epartement des sciences de la Terre et de l’atmosph `ere, Universit ´e du Qu ´ebec `a Montr ´eal, C.P. 8888, succ. Centre-Ville, Montr ´eal, Qc, Canada
2
Division de la recherche en m ´et ´eorologie, Environnement Canada, Centre M ´et ´eorologique Canadien, Dorval, Qu ´ebec, Canada
3
Geological Survey of Canada, 490 de la Couronne, Qu ´ebec, Qc, Canada
*
now at: Arrakis Consultants Inc., Sainte-Foy, Qc, Canada
Received: 15 September 2010 – Accepted: 30 September 2010 – Published: 8 October 2010 Correspondence to: M. Larocque ([email protected])
HESSD
7, 7809–7838, 2010 Groundwater contribution to river flows – southern Quebec aquifer M. Larocque et al. Title Page Abstract Introduction Conclusions References Tables Figures J I J I Back CloseFull Screen / Esc
Printer-friendly Version Interactive Discussion Discussion P a per | Dis cussion P a per | Discussion P a per | Discussio n P a per | Abstract
Groundwater contribution to river flows, generally called base flows, often accounts for a significant proportion of total flow rate, especially during the dry season. The ob-jective of this work is to test simple approaches requiring limited data to understand groundwater contribution to river flows. The Noire river basin in southern Quebec is 5
used as a case study. A lumped conceptual hydrological model (the MOHYSE model), a groundwater flow model (MODFLOW) and hydrograph separation are used to provide estimates of base flow for the study area. Results show that the methods are comple-mentary. Hydrograph separation and the MOHYSE surface flow model provide similar annual estimates for the groundwater contribution to river flow, but monthly base flows 10
can vary significantly between the two methods. Both methods have the advantage of being easily implemented. However, the distinction between aquifer contribution and shallow subsurface contribution to base flow can only be made with a groundwater flow model. The aquifer renewal rate estimated with the MODFLOW model for the Noire River is 30% of the recharge estimated from base flow values. This is a significantly 15
difference which can be crucial for regional-scale water management.
1 Introduction
Providing accurate estimates of groundwater contribution to river flows is important to anticipate possible low flow periods and to evaluate aquifer renewal rates. In temper-ate and humid climtemper-ates, groundwtemper-ater contribution to river flow, generally called base 20
flow, often accounts for a significant proportion of total flow rate, especially during the dry season. Base flows must be estimated to find a compromise between river basin development and maintenance of river ecology (Smakhtin, 2007). Conceptually, a river catchment can be perceived as a series of interlinked reservoirs, each of which has components of recharge, storage and discharge (Smakhtin, 2001). It is very difficult 25
HESSD
7, 7809–7838, 2010 Groundwater contribution to river flows – southern Quebec aquifer M. Larocque et al. Title Page Abstract Introduction Conclusions References Tables Figures J I J I Back CloseFull Screen / Esc
Printer-friendly Version Interactive Discussion Discussion P a per | Dis cussion P a per | Discussion P a per | Discussio n P a per |
to adequately represent the dynamics and exchanges between these reservoirs. In regional scale aquifers, groundwater contribution to river flow is often considered equal to recharge and therefore influenced by climate, geology and topography (e.g. T `oth, 1963). Land use, soil type and hydrostratigraphy are also important local scale factors determining the volumes of water which can infiltrate, percolate through the unsatu-5
rated zone, reach the water table and eventually outcrop in rivers (e.g. Cherkauer and Ansari, 2005).
Field measurements such as those performed with seepage meters, surface water and groundwater level measurements, as well as geochemical analysis of river water during flood events are among the most frequently used techniques for the quantifica-10
tion of river-aquifer exchanges (see Ruehl et al., 2006). These field methods are highly valuable since they provide direct estimates of groundwater contribution to river flow. However, they can require extensive instrumentation and analytical means (e.g. geo-chemical analysis of flood events water) or include large uncertainties on exchanged flows at the catchment scale (e.g. seepage meter). Catchment-scale hydrological mod-15
els (e.g. SWAT, Neitsch et al., 2002 or HYDROTEL, Fortin et al., 2001) are also par-ticularly useful in partitioning flows between runoff, hypodermic flow and groundwater contribution to rivers (e.g. Arnold et al., 2000). In these models, processes related to groundwater flow are, however, usually not explicitly represented. Groundwater flow models simulate heads in the aquifer and provide estimates of groundwater discharg-20
ing in rivers and streams at boundaries. They most often do not simulate the dynam-ics of surface water bodies and, therefore, require that recharge, not precipitation, be used as input. Fully-coupled surface/subsurface models (e.g. MIKE-SHE, Refsgaard, 1997 or HydroGeoSphere, Therrien et al., 2005) simulating the entire water cycle are conceptually appealing but extensive parameter requirements and high computational 25
costs restrain their use. Hydrograph separation techniques (e.g. Chapman, 1991; Sloto and Crouse, 1996; Eckhardt, 2005) are often used to quantify aquifer contribution to river flow at the outlet of a watershed and are probably the most easily implemented techniques for base flow estimation. Halford and Mayer (2000) recommend the use
HESSD
7, 7809–7838, 2010 Groundwater contribution to river flows – southern Quebec aquifer M. Larocque et al. Title Page Abstract Introduction Conclusions References Tables Figures J I J I Back CloseFull Screen / Esc
Printer-friendly Version Interactive Discussion Discussion P a per | Dis cussion P a per | Discussion P a per | Discussio n P a per |
of multiple, alternative methods to estimate groundwater discharge and recharge be-cause of the uncertainty associated with different techniques.
Over the last decade, a number of southern Quebec aquifers have been the subject of regional scale characterization studies. These studies have provided excellent data to understand groundwater flow in the Portneuf, Mirabel and Chateauguay aquifers 5
(see Fagnan et al., 1999; Nastev et al., 2005; Cloutier et al., 2006; Croteau, 2006; Nastev et al., 2008). Groundwater characterization studies are currently under way in seven other Quebec regions. Because this type of study is highly time consuming, it is unlikely that all aquifers in Quebec, Canada or anywhere else will be characterized in the near future, leaving many peripheral aquifers uncharacterized and with little or no 10
understanding on groundwater contribution to river flows.
There is obviously a need to test and use simple approaches requiring limited data to understand groundwater contribution to river flows. This is the objective of this work which focuses on modeling approaches with limited parameter requirements. The Noire River basin in southern Quebec is used as a case study. This basin is typi-15
cal of regions located south of the St. Lawrence River, in the Piemont and Appalachian Mountains region, where the river network is well organized and topography varies sig-nificantly over short distances. In this paper, a lumped conceptual hydrological model is used to simulate river flow and estimate base flows on the Noire River basin. In par-allel, a groundwater flow model is developed and calibrated to determine the renewal 20
rate of the deep bedrock aquifer. Hydrograph separation is also used to provide a third estimate of base flows on the Noire River basin. The three approaches are compared in their capacity to evaluate the time-varying contribution of groundwater to surface flow.
2 The study area 25
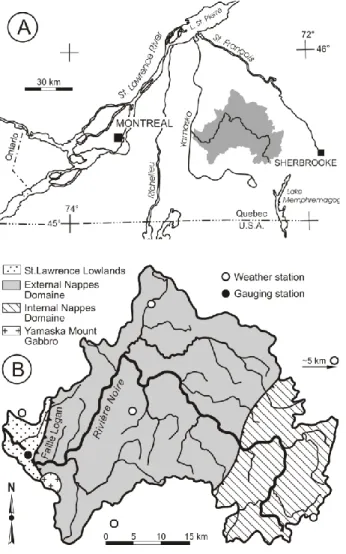
The study area is the Noire River watershed, a regional scale (1580 km2) sub-basin of the Yamaska River located 100 km southeast from Montreal, Quebec (Fig. 1a). Six
HESSD
7, 7809–7838, 2010 Groundwater contribution to river flows – southern Quebec aquifer M. Larocque et al. Title Page Abstract Introduction Conclusions References Tables Figures J I J I Back CloseFull Screen / Esc
Printer-friendly Version Interactive Discussion Discussion P a per | Dis cussion P a per | Discussion P a per | Discussio n P a per |
weather stations and one gauging station were operational on the basin during the 1990–2004 period (Environment Canada, 2006; see Fig. 1b for station locations). The average annual precipitation is 1156 mm (ranging from 920 to 1344 mm). The January average temperature is −10.8◦C and the July average temperature is 19.8◦C. Below zero temperatures and snow accumulation extend from early December to the end of 5
March. Evapotranspiration is estimated as the difference between precipitation and mean annual flow at the basin outlet. The average annual evapotranspiration for the study period is 621 mm and varies from 531 to 784 mm.
The river network is well developed and consists of the Noire River (∼100 km in length) and 14 main tributaries. Topography data, available from 1:50 000 maps (NRC, 10
1998, 2000, 2002, 2003), varies from 30 m at the basin outlet to 480 m in the southeast area. According to land use data from 1996 (LANDSAT5-TM image from August 1996), intensive crops (mainly corn, but also soybean and cereals) dominate the lower portion of the basin while forest and perennial crops (hay and pasture) are more frequent in the upper portion (Larocque and Pharand, 2010).
15
The Noire River basin is located on the Appalachian piedmont and uplands. It in-cludes on its western side rocks of the St. Lawrence Lowlands, with shale and sand-stone of the Nicolet Formation and slate and dolomite from the Ste-Sabine and de Les Fonds formations. East from the Logan Line, formations of the Appalachians, more folded and faulted rocks, are present. The underlying bedrock is Lower Cam-20
brian to Middle Ordovician in age. The central part of the basin is occupied by the external nappes domaine of the Humber Zone (Cook et al., 1962; Clark, 1977). From west to east: limestone, clayey carbonate, sandstone, red slate and conglomerates of the Bourret Formation; blocky schists from the Drummondville Olistostrome For-mation; sandstones, conglomerates, red and green slates from the Shefford Group; 25
carbonates and slates from the Stanbridge Group. The internal nappes domaine are found in the highest portion of the basin to the southeast with more intensively folded slate, dolomite and quartzites from the Oak Hill Group (Fig. 1b). During the Late Wis-consinan deglaciation and early Holocene time, various discontinuous sedimentary
HESSD
7, 7809–7838, 2010 Groundwater contribution to river flows – southern Quebec aquifer M. Larocque et al. Title Page Abstract Introduction Conclusions References Tables Figures J I J I Back CloseFull Screen / Esc
Printer-friendly Version Interactive Discussion Discussion P a per | Dis cussion P a per | Discussion P a per | Discussio n P a per |
deposits accumulated over bedrock (Prichonnet et al., 1982). These include predom-inantly lodgement and melt-out till sheets, ice-contact bodies of sand and gravel and a suite of marine sediments, including clayey silt. These deposits are discontinuous and generally of limited thickness: the till blanket (maximum depth 5 m) with scattered bedrock outcrops is present almost everywhere in the study area; sand and gravel de-5
posits (maximum depth 15 m), either fluvial sediments in the lower reaches of the Noire River or as glaciofluvial sediments in upland valleys and concealed or partly concealed below marine clays in the piedmont; Champlain Sea clayey silt (maximum depth 20 m), occur mainly in the lower part of the basin, downstream of Roxton Pond (Bolduc et al., 2006). The main aquifer is located in the fractured bedrock. Hydraulic conductivi-10
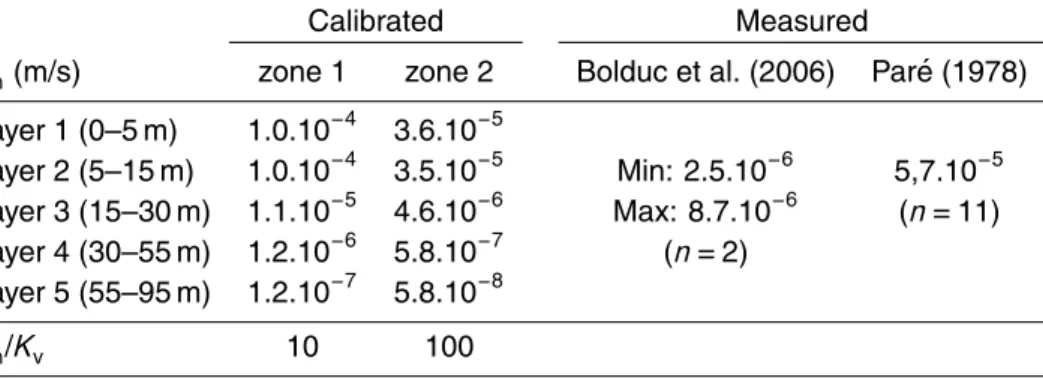
ties of the bedrock aquifer are available for the entire watershed from Par ´e (1978) and from short term (two hours) pumping tests performed by Bolduc et al. (2006) near the watershed outlet part of the basin (Table 1).
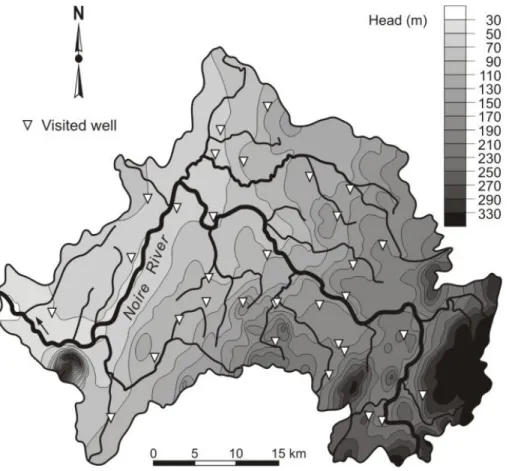
A piezometric map (Fig. 2) was drawn by Larocque and Pharand (2010) using 34 groundwater levels measured in private wells visited in May 2003 and 3985 ground-15
water levels from the SIH (MDDEP, 2006), a well-drillers’ database. Uncertainty on the provincial database groundwater levels (resulting from measurement errors, well loca-tion errors, varying measurement periods, varying well depths and associated mean values obtained over the entire uncased bedrock wells, etc.) may range from a few centimeters to several meters. When a surfaces-groundwater link was evident, ur-20
face water elevations in the Noire River and in its tributaries were also incorporated to draw the piezometric map. The general groundwater flow direction is from southeast to northeast with the highest gradients being observed in the upstream portion of the basin, where the topography of the Appalachian Mountains is more abrupt. The Noire River influences local flow directions but the tributaries appear to have only a limited 25
influence on the piezometric map, probably due to the generally limited depth of their channels. The water table is on average 2.5 m below the surface. According to the SIH database, the average well depth is 40 m, 52% of the wells are more shallow than 40 m and only 3% have deeper than 100 m. This confirms that groundwater flows more
HESSD
7, 7809–7838, 2010 Groundwater contribution to river flows – southern Quebec aquifer M. Larocque et al. Title Page Abstract Introduction Conclusions References Tables Figures J I J I Back CloseFull Screen / Esc
Printer-friendly Version Interactive Discussion Discussion P a per | Dis cussion P a per | Discussion P a per | Discussio n P a per |
easily in the top portion of the aquifer, probably because deeper fractures are filled with mineral cement (calcite or quartz).
3 Methods
3.1 The hydrological model
Hydrological models are useful tools to partition total flow in the river between runoff 5
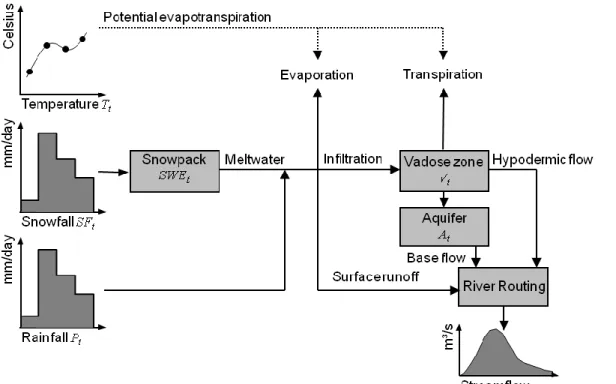
and base flow. In the current study, flows in the Noire River were simulated using the MOHYSE v1b3 model (Fortin and Turcotte, 2007). MOHYSE is a lumped conceptual model of surface flow processes (Fig. 3) using four reservoirs which include the main processes found in more complex models (snow accumulation and melt, evaporation and transpiration, surface runoff, infiltration, subsurface flow, groundwater recharge, 10
base flow and river routing). For each of these processes a simple, and in most cases linear, representation of the process is used. MOHYSE has three inputs: daily rain-fall RFt, daily snowfall SFt (in water equivalent), and daily mean temperature Tt. It also has three state variables: snow water equivalent on the ground SWEt, the level of the reservoir representing the unsaturated zone Vt, and the level of the reservoir 15
representing the saturated zone (or aquifer) At. There is no infiltration when the soil is frozen.
Potential evapotranspiration is estimated to be the product of the duration of day-light, the saturation vapour pressure value corresponding to the daily mean tempera-ture and a coefficient of evaporation (CE). Snowfall accumulates and melts according 20
to a degree-day model with a constant threshold temperature (TM) and melt rate (MR). Meltwater is added to rainfall to obtain the daily water input. This daily input of water evaporates at the potential evapotranspiration rate. If this rate is larger than the input of water, a fraction of the difference is removed from the reservoir modelling the unsat-urated zone Vt to represent transpiration by the vegetation. This fraction is given by the 25
HESSD
7, 7809–7838, 2010 Groundwater contribution to river flows – southern Quebec aquifer M. Larocque et al. Title Page Abstract Introduction Conclusions References Tables Figures J I J I Back CloseFull Screen / Esc
Printer-friendly Version Interactive Discussion Discussion P a per | Dis cussion P a per | Discussion P a per | Discussio n P a per |
is smaller than the input of water, a fraction of the difference becomes surface runoff. This fraction is given by the product of a runoff coefficient (CR) and Vt. The rest infil-trates into the unsaturated zone if the air temperature is above TM. Hypodermic flow is estimated by the product of a coefficient of infiltration (CI) and Vt, and base flow is estimated by the product of a base flow coefficient (CB) and At. Water also percolates 5
from the unsaturated zone to the saturated zone, at a rate given by the product of a percolation coefficient (CP) and Vt. The sum of runoff, hypodermic flow and base flow is then routed through a synthetic unit hydrograph defined by two calibration parame-ters (A and B) and multiplied by the basin area to obtain a simulation of streamflow at the outlet of the basin.
10
The ten model parameters (CE, TM, MR, CT, CR, CI, CB, CP, A, and B) are cali-brated automatically using the Shuffled Complex Evolution method (Duan et al., 1992) within preset intervals representing physical constraints and a range of expected val-ues. A calibration period of at least five years is usually recommended in hydrological modeling. For this study, the parameters were calibrated based on the flow rate data 15
from November 1989 to April 1997 (see Table 2 for calibrated parameters). A simulation using the same parameter set was then performed from May 1997 to October 2004. The model’s accuracy with respect to measured flow rates was evaluated according to the Nash-Sutcliffe coefficient (NSC) (Nash and Sutcliffe, 1970), the Root Mean Square Error (RMSE) and the bias (difference between observed and simulated mean flow 20
rates).
In the current study, the MOHYSE model is used to simulate rapid flows traveling at the surface as runoff or immediately under the surface, as well as slower flow traveling in the aquifer and emerging in the river as base flow. The main advantage of this ap-proach lies in the simplicity of the model implementation and its physical representation 25
HESSD
7, 7809–7838, 2010 Groundwater contribution to river flows – southern Quebec aquifer M. Larocque et al. Title Page Abstract Introduction Conclusions References Tables Figures J I J I Back CloseFull Screen / Esc
Printer-friendly Version Interactive Discussion Discussion P a per | Dis cussion P a per | Discussion P a per | Discussio n P a per |
3.2 The groundwater flow model
In this study, groundwater flow is simulated using the MODFLOW model (McDonald and Harbaugh, 1988), assuming that the bedrock aquifer is sufficiently fractured to be-have as a porous media at the regional scale. This hypothesis is justified in part by the fact that pumping tests could be interpreted using the Theis method (cf. Bolduc, 2004). 5
The simulated aquifer covers the entire surface watershed. The digital elevation model was extracted from 1:50 000 topography maps. The model contains 500 m × 500 m cells and five layers (5, 10, 15, 25 and 40 m thickness). The Noire River is represented using the River module and its 14 main tributaries are represented using the Drain module. Water elevations for the Noire River and for the tributaries were extracted from 10
the 1:50 000 topography maps. Flow simulations were performed in steady-state. Hydraulic conductivities were calibrated with a manual trial and error procedure to simulate the available head data (measured and from the SIH database). The domain was divided in two zones corresponding to the External Nappes Domain (zone 1) and to the Internal Nappes Domain (zone 2). A distinct hydraulic conductivity was calibrated 15
for each zone and each layer (Table 1), with systematically lower values for zone 2. The calibrated hydraulic conductivities are within the range of K values identified by Bolduc et al. (2006) and Par ´e (1978). Decreasing K values from layer 2 to 5 corre-spond to unpublished field observations from electrical resistivity which indicate that dynamic groundwater flow occurs within the uppermost 30 m of the aquifer. Kh/Kv ra-20
tios are 10 and 100 in zones 1 and 2 respectively. A higher ratio was required in zone 2 to simulate heads close to the land surface in the south-eastern portion of the basin. This is justified by the fact that in this area, topography and fracturing enhances shal-low subsurface fshal-low, driving groundwater fshal-low laterally more easily than in the vertical direction.
25
Larocque and Pharand (2010) used a soil water budget model based on soil use and Quaternary deposits to estimate a 215 mm/year average infiltration over the Noire River basin. These authors simulated spatially varying recharge related to the type of
HESSD
7, 7809–7838, 2010 Groundwater contribution to river flows – southern Quebec aquifer M. Larocque et al. Title Page Abstract Introduction Conclusions References Tables Figures J I J I Back CloseFull Screen / Esc
Printer-friendly Version Interactive Discussion Discussion P a per | Dis cussion P a per | Discussion P a per | Discussio n P a per |
Quaternary deposits: limited recharge (< 50 mm/year) in localized areas of the down-gradient portion of the basin where clayey silts are found; high recharge (reaching 300 mm/year) where sand and sandy till dominates in most of the central portion of the basin. In the current study, the large uncertainty associated with target heads, has mo-tivated the use of a constant recharge for the entire study area. The calibrated recharge 5
is 224 mm/year, i.e. similar to the average value from Larocque and Pharand (2010). It will be shown later that only a fraction of this flux probably reaches the regional aquifer. 3.3 Hydrograph separation
Many digital and graphical methods have been developed to separate base flow from total streamflow (see Gonzales et al., 2009). All separation techniques are more or 10
less subjective. The advantages of these methods is that they require only daily stream flows, they are easily implemented and they provide a rapid estimate of groundwater contribution to river flow. Hydrograph separation techniques distinguish high frequency events from low frequency events. Flood events have a high frequency and conceptu-ally represent a combination of true surface flow and hypodermic flow. Low frequency 15
events are usually associated with a groundwater contribution or base flow. This is based on the hypothesis that after having travelled through the aquifer, the pulses cor-responding to flood events have a much lower frequency. During low-flow periods, when groundwater nearly provides the only contribution to the river flow, hydrograph separation usually gives a good estimate of base flow. However, it is very difficult to 20
verify the runoff to base flow ratio during other periods.
In the current study, the Chapman (1991) digital filter is used to partition total stream-flow into surface runoff and base flow. This filter is based on the following equations:
BFt = Qt − Rt (1) f (t) = 3 α − 1 3 − α f (t − 1) + 3 3 − α (Qt − α Qt) (2) 25
HESSD
7, 7809–7838, 2010 Groundwater contribution to river flows – southern Quebec aquifer M. Larocque et al. Title Page Abstract Introduction Conclusions References Tables Figures J I J I Back CloseFull Screen / Esc
Printer-friendly Version Interactive Discussion Discussion P a per | Dis cussion P a per | Discussion P a per | Discussio n P a per |
where BFt is base flow at time t[L3T−1], Qt is the total flow rate at time t[L3T−1], Rt is the filtered quick response (i.e. runoff) at time t[L3T−1] and α is the filter parameter or recession coefficient [−]. For average size watersheds, Chapman (1991) recommends using α between 0.9 and 0.95 (smaller α lead to larger base flows). Because it is difficult to determine α without field calibration, these values are used to quantify a 5
range of possible base flows.
4 Results and discussion
4.1 Calibrated hydrological model and groundwater flow model
Figure 4 shows that the surface flow model provides acceptable results for the 1989–1997 calibration period (NSC= 0.72, RMSE = 24.2 m3/s, bias= −0.7 m3/s) and 10
somewhat less good results for the 1997–2004 verification period (NSC= 0.60, RMSE= 23.8 m3/s, bias= −2.5 m3/s). The RMSE values indicate that some peak flow rates are not adequately simulated for both the calibration and validation periods. The bias is negative for the calibration and validation periods, reflecting a general overes-timation of the measured flow rates by MOHYSE especially for the validation period. 15
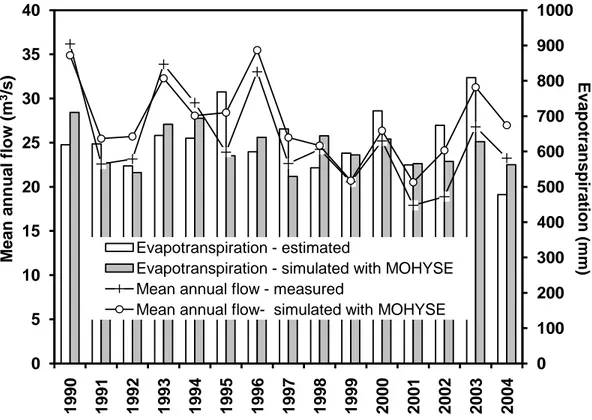
Figure 5 shows that the model reproduces the general annual variations but tends over-estimate flow, especially at the end of the simulation period (2001–2004). This could be due to lower average precipitation and higher air temperature in at the end of the validation period (1099 mm and 6◦C) compared to the 1989–1996 calibration period (1213 mm and 5.6◦C). Evapotranspiration estimated from measurements (i.e. precip-20
itation minus the mean annual flow) and simulated by the MOHYSE model are also illustrated in Fig. 5. The surface flow model reproduces generally well annual evap-otranspirations throughout the simulation period. The adequate simulation of snow accumulation and melting (results not shown) are additional indications that the model is reasonably calibrated for the basin. When additional data become available, a more 25
HESSD
7, 7809–7838, 2010 Groundwater contribution to river flows – southern Quebec aquifer M. Larocque et al. Title Page Abstract Introduction Conclusions References Tables Figures J I J I Back CloseFull Screen / Esc
Printer-friendly Version Interactive Discussion Discussion P a per | Dis cussion P a per | Discussion P a per | Discussio n P a per |
variations, for example with the HYDROTEL model (Fortin et al., 2001) or the WAT-FLOOD model (Kouwen et al., 1993). Preliminary tests conducted with the HYDROTEL model have shown that the simpler MOHYSE model provides similar performances at the basin scale with the currently available data.
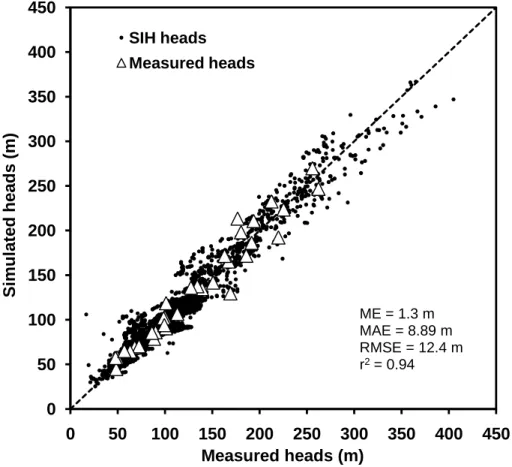
Available head measurements are relatively well simulated with the groundwater flow 5
model (Fig. 6). The mean error (ME) on simulated heads is 1.3 m which means that heads are slightly overestimated. The mean average error (MAE) is 8.89 m, the RMSE is 12.4 m and the r2is 0.94. All statistics are reasonable for this 1580 km2area, given the topography difference of 450 m, large uncertainties related to groundwater levels from the SIH database and the relatively low precision of elevation data. Forty-four 10
percent of the residuals are within a ± 5 m range and 71% of the residuals are within a ±10 m range. Considering the limited hydrogeological information currently available on the basin and the fact that flow in the fractured bedrock is certainly more heteroge-neous than represented, the calibrated model is considered satisfactory.
4.2 Base flows 15
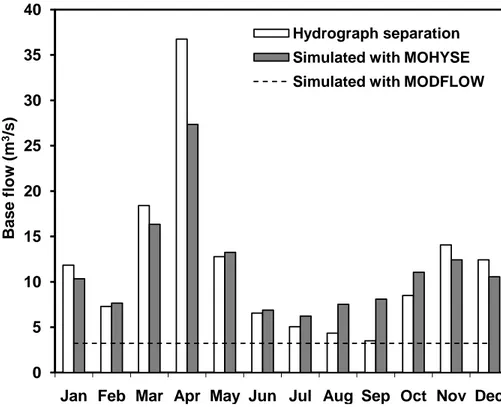
Figure 7 shows the average monthly base flows simulated with the MOHYSE model and those from hydrograph separation. Monthly values are averaged over the 1990– 2004 period. Both methods reflect a bi-modal distribution during the year with relatively low values in winter and a sudden increase at snowmelt, followed by a low base flow period from June to September and an increase in the fall. Base flows from the hydro-20
logical model are smaller than those from hydrograph separation during the snow melt period (March and especially April) and higher during the low-flow period (July, August and September). The difference observed during the spring is not surprising since hydrograph separation techniques typically overestimate base flows during high-flow periods (Rivard et al., 2010). During the recession period, many processes can in-25
fluence groundwater discharge (bank storage, wetlands storage, the presence of tem-porarily saturated soils, high groundwater levels and snowmelt), therefore introducing significant errors in base flow estimates from hydrograph separation (see Halford and
HESSD
7, 7809–7838, 2010 Groundwater contribution to river flows – southern Quebec aquifer M. Larocque et al. Title Page Abstract Introduction Conclusions References Tables Figures J I J I Back CloseFull Screen / Esc
Printer-friendly Version Interactive Discussion Discussion P a per | Dis cussion P a per | Discussion P a per | Discussio n P a per |
Mayer, 2000). During the low-flow period, hydrograph separation techniques usually provide good estimates of base flows since groundwater is then the only contribution to flow rates. It can therefore be said that the MOHYSE model overestimates on av-erage groundwater contribution to the river during low-flow periods. Because the true dynamics of flow processes and parameter variability in space are not represented in 5
the MOHYSE model, local estimates of base flow cannot be made. However, because of its process-based representation and ease of use, MOHYSE is a good tool to predict future flows (Rivard et al., 2009).
In the calibrated MODFLOW model, 3.2 m3/s flows to the Noire River over its entire length and a total of 7.6 m3/s flows to all the tributaries combined. Converted to surface 10
units, this means that 67 mm of the total recharge (i.e. 30% of the 224 mm recharge) flows to the Noire River while 157 mm is intercepted by the tributaries. Because the tributaries are shallow and their influence is not visible on the piezometric map, their contribution can be associated to groundwater that has traveled for a short period in the aquifer before discharging through the streambed (shallow groundwater flow). This 15
water probably travels in the more intensely fractured, upper layers of the bedrock aquifer. It could also come from agricultural drains, densely used in parts of this agri-cultural basin. Drains are recognized to divert infiltrated water to the surface thus re-duce significantly recharge (B ¨ohlke, 2002). The interception of significant groundwater volumes by agricultural drains could also contribute to limit groundwater vulnerability, 20
diverting potentially contaminated water towards tributaries. This could explain in part why groundwater contamination by nitrates is relatively low in the Noire River basin and generally limited to shallow wells (Bolduc et al., 2006; Larocque and Pharand, 2010). The Noire River has a more incised channel and clearly influences regional ground-water flow directions. It probably intercepts deeper ground-water from the bedrock aquifer. 25
Water drained by the Noire River thus better represents the renewal rate of the deep bedrock aquifer. It is important to underline that because of the relatively low precision of topography data, the simple 3-D representation of the aquifer and the homogeneous recharge used in this study, this renewal rate should be interpreted as an order of
HESSD
7, 7809–7838, 2010 Groundwater contribution to river flows – southern Quebec aquifer M. Larocque et al. Title Page Abstract Introduction Conclusions References Tables Figures J I J I Back CloseFull Screen / Esc
Printer-friendly Version Interactive Discussion Discussion P a per | Dis cussion P a per | Discussion P a per | Discussio n P a per |
magnitude for the true regional recharge. Such a low renewal rate of the regional aquifer could be due to the topography of the Noire basin. This topography apparently leads to significant amounts of hypodermic flow discharging into streams and springs, especially in the south-eastern portion of the watershed. Croteau (2006) found similarly important hypodermic flow in the Adirondacks piemont of southern Quebec. Figure 7 5
shows that the Noire River base flows are significantly lower than those from either hydrograph separation or the MOHYSE model during spring and fall. However, the simulated groundwater flow to the Noire River is similar to the low-flow summer base flow estimated with hydrograph separation.
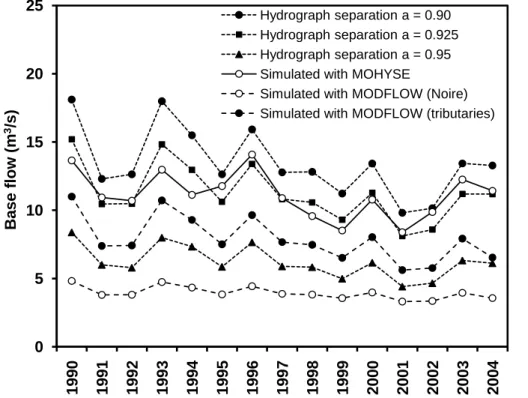
Estimation of annual recharge from any given estimate of base flow is often made on 10
the assumptions that (1) hypodermic flow to rivers is negligible compared to the aquifer contribution; (2) there is no loss of groundwater to deeper aquifers; (3) the ground-water catchment matches the ground-watershed; and (4) the groundground-water flow system is in steady-state (Dripps et al., 2006). Annual base flow volumes from hydrograph sepa-ration (with α= 0.925) were converted to recharge rates for all 15 years of the study 15
period. The calibrated MODFLOW model is run again in steady-state using each of these 15 recharge values from 1990 to 2004 (all other parameters are kept constant). This is performed to provide insight into the influence of varying recharge on simulated groundwater flow drained by the Noire River and by its tributaries. Figure 8 shows that groundwater flow drained by the Noire River in the MODFLOW model are signif-20
icantly smaller than base flows from hydrograph separation with α= 0.925 and even with α= 0.95. This was expected since the MODFLOW recharge was estimated using the α= 0.925 hydrograph separation. They are also smaller than those from the MO-HYSE model. The MOMO-HYSE base flows are generally in agreement with base flow val-ues obtained with the lowest α valval-ues (0.9 and 0.925). The α value of 0.95 is obviously 25
too large to represent the total groundwater contribution to river flow. The difference be-tween hydrograph separation or MOHYSE base flows and the MODFLOW Noire River base flows is likely due to hypodermic flow and shallow subsurface flow, represented by the MODFLOW tributaries base flow. In reality, this difference is probably largest during
HESSD
7, 7809–7838, 2010 Groundwater contribution to river flows – southern Quebec aquifer M. Larocque et al. Title Page Abstract Introduction Conclusions References Tables Figures J I J I Back CloseFull Screen / Esc
Printer-friendly Version Interactive Discussion Discussion P a per | Dis cussion P a per | Discussion P a per | Discussio n P a per |
important rain events and snowmelt (high-flow) periods, when hydrograph separation techniques assign a significant increase of flow to base flow. It is improbable that it is improbable that water from the regional aquifer contributes significantly to surface flow over the short time span of a flood event (see Jones et al., 2006). Groundwater contri-bution during these periods probably comes mostly from shallow subsurface water that 5
travels briefly and rapidly in the shallowest part of the aquifer. Therefore, using base flow separation as a direct means to estimate annual recharge for a regional aquifer, i.e. without making use of a groundwater flow model, could significantly overestimate aquifer renewal rate.
Figure 8 also shows that the base flow to the Noire River is much less influenced 10
by recharge variations than the total base flow to the tributaries. This was expected since the Noire River is represented with the River module which allows water to flow either towards the River or towards the aquifer, depending on the aquifer head relative to the river head. The tributaries, being represented with the Drain module, allow water to flow only from the aquifer to the drain. Although this is a constraint from 15
the model description, it also reflects the reality of shallow tributaries which do not have a strong hydraulic link with the water table. In unconfined aquifers, river base flow usually decreases during dryer years and this is typically accompanied by lower hydraulic heads in the aquifer. In the MODFLOW model, this leads to the drying up of some tributaries and to an increase in the Noire River/tributaries ratio. This occurres 20
mostly in the south-eastern (upstream) portion of the watershed where topography is higher. This area hosts many headwater streams, which are known to be particularly vulnerable to variations in recharge conditions (Meyer et al., 2007). In addition to having an impact on downstream flow rates, drying of headwater streams can have a significant impact on local ecosystems.
HESSD
7, 7809–7838, 2010 Groundwater contribution to river flows – southern Quebec aquifer M. Larocque et al. Title Page Abstract Introduction Conclusions References Tables Figures J I J I Back CloseFull Screen / Esc
Printer-friendly Version Interactive Discussion Discussion P a per | Dis cussion P a per | Discussion P a per | Discussio n P a per | 5 Conclusions
Many aquifers have not yet been the focus of regional scale characterization and have only limited available hydrological and hydrogeological data. This work shows that a lumped conceptual hydrological model, a steady-state groundwater-flow model and hydrograph separation can provide complementary information on groundwater contri-5
bution to stream flows. Although hydrograph separation is very simple to implement, it must be validated through comparison with other methods and it is obviously lim-ited to existing time series. The main advantages of the MOHYSE hydrological model reside in its process-based representation, its ease of implementation and the possi-bility to predict future flows. Results from this study show that long calibration periods 10
may be required to simulate adequately future flows in changing climate conditions. Hydrograph separation and the MOHYSE surface flow model provide similar annual estimates for the groundwater contribution to river flow on the Noire River basin. Al-though similar patterns may be observed on an annual basis, monthly values may differ significantly: hydrograph separation is less reliable during the spring and fall (high-flow) 15
periods, while the MOHYSE model seems to underestimate summer values. It is clear that the methods are complementary. However, the distinction between base flow com-ing from the aquifer, from hypodermic flow or shallow subsurface flow is not possible with these two methods because they do not represent aquifer processes explicitly. This distinction can be made with a groundwater flow model such as MODFLOW which 20
as a result provides a more reliable estimate of the regional aquifer renewal rate. In the case of the Noire River, this renewal rate is 30% of the recharge estimated from base flow values. This information is highly valuable for regional-scale water management. This work confirms that multiple methods should be used to estimate aquifer recharge. The Noire River basin aquifer is located in a region currently being characterized within 25
the framework of a vast program recently launched by the Quebec Department of En-vironment. In a few years, it will be interesting to compare results from this study to the new data that will emerge from the full scale characterization study currently under way.
HESSD
7, 7809–7838, 2010 Groundwater contribution to river flows – southern Quebec aquifer M. Larocque et al. Title Page Abstract Introduction Conclusions References Tables Figures J I J I Back CloseFull Screen / Esc
Printer-friendly Version Interactive Discussion Discussion P a per | Dis cussion P a per | Discussion P a per | Discussio n P a per |
Acknowledgements. This research was performed with the financial contribution of NSERC
and FQRNT. The authors would like to thank the MAPAQ (Minist `ere de l’Agriculture, des P ˆeches et de l’Alimentation du Qu ´ebec) for providing land use data and all the residents who gave access to their property.
References 5
Arnold, J. G., Muttiah, R. S., Srinivasan, R., and Allen, P. M.: Regional estimation of base flow and groundwater recharge in the Upper Mississippi river basin, J. Hydrol., 227, 21–40, 2000. B ¨ohlke, J. K.: Groundwater recharge and agricultural contamination, Hydrogeol. J., 10, 53–179,
2002.
Bolduc, S., Larocque, M., and Prichonnet, G.: Vuln ´erabilit ´e de l’eau souterraine `a la
contami-10
nation par les nitrates sur le bassin versant de la rivi `ere Noire (Mont ´er ´egie, Qu ´ebec), Rev. Sci. Eau, 19(2), 87–99, 2006.
Bolduc, S.: Vuln ´erabilit ´e de l’eau souterraine `a la contamination par les nitrates: g ´eologie, hy-drog ´eologie et simulation sur le bassin versant de la rivi `ere Noire (Mont ´er ´egie, Qu ´ebec), M.Sc. thesis, D ´epartement des sciences de la Terre et de l’atmosph `ere, Universit ´e du
15
Qu ´ebec `a Montr ´eal, 166 pp., 2004.
Chapman, T. G.: Comment on “Evaluation of automated techniques for baseflow and recession analyses” by R. J. Nathan and T. A. McMahon, Water Resour. Res., 27, 1783–1784, 1991. Cherkauer, D. S. and Ansari, S. A.: Estimating ground water recharge from topography,
hydro-geology, and land cover, Ground Water, 43(1), 102–112, 2005.
20
Cloutier, V., Lefebvre, R., Savard, M. M., Bourque, ´E., and Therrien, R.: Hydrogeochem-istry and groundwater origin of the Basses-Laurentides sedimentary rock aquifer system, St. Lawrence Lowlands, Qu ´ebec, Canada, Hydrogeol. J., 14, 573–590, 2006.
Clark, T. H.: R ´egion de Granby (W) ; rapport g ´eologique 177, Carte 1869, 1:63 360. Service d’exploration g ´eologique, direction r ´egionale des mines, Minist `ere des Richesses naturelles,
25
Qu ´ebec, Canada, 109 pp., 1977.
Cook, H. C., Eakins, P. R., and Tiphane, M.: Shefford map area, Shefford and Brome coun-ties, Eastern Townships of Quebec, Minist `ere des Richesses naturelles, Qu ´ebec, DPV 187, Qu ´ebec, Canada, 145 pp., 1962.
HESSD
7, 7809–7838, 2010 Groundwater contribution to river flows – southern Quebec aquifer M. Larocque et al. Title Page Abstract Introduction Conclusions References Tables Figures J I J I Back CloseFull Screen / Esc
Printer-friendly Version Interactive Discussion Discussion P a per | Dis cussion P a per | Discussion P a per | Discussio n P a per |
Croteau, A.: D ´etermination de la distribution spatiale et temporelle de la recharge `a l’aquif `ere r ´egional transfrontalier du bassin versant de la rivi `ere Ch ˆateauguay, Qu ´ebec et ´Etats-Unis, Master’s thesis, INRS ETE, Sainte-Foy, Quebec, Canada, 346 pp., 2006.
Dripps, W. R., Hunt, R. J., and Anderson, M. P.: Estimating recharge rates with analytic element models and parameter estimation, Ground Water, 44(1), 47–55, 2006.
5
Duan, S., Sorooshian, M. and Gupta, V.: Effective and efficient global optimization for concep-tual rainfall-runoff models, Water Resour. Res., 28(4), 1015–1031, 1992.
Eckhardt K.: How to construct recursive digital filters for baseflow separation, Hydrol. Process., 19, 507–515, 2005.
Environment Canada: http://www.climate.weatheroffice.ec.gc.ca/climateData/dailydata, last
10
access: September, 2006.
Fagnan, N., Bourque, E., Michaud, Y., Lefebvre, R., Boisvert, E., Parent, M., and Martel, R.: Hydrog ´eologie des complexes delta¨ıques sur la marge nord de la Mer de Champlain, Hy-drog ´eologie, 4, 9–22, 1999.
Fortin, V. and Turcotte, R.: Le mod `ele hydrologique MOHYSE, Research report, Environnement
15
Canada, 2007.
Fortin, J. P., Turcotte, R., Massicotte, S., Moussa, R., and Fitzback, J.: A Distributed Watershed Model Compatible with Remote Sensing and GIS Data, Part 1: Description of the model, J. Hydrol. Eng.-ASCE, 6(2), 91–99, 2001.
Gonzales, A. L., Nonner, J., Heijkers, J., and Uhlenbrook, S.: Comparison of different base
20
flow separation methods in a lowland catchment, Hydrol. Earth Syst. Sci., 13, 2055–2068, doi:10.5194/hess-13-2055-2009, 2009.
Halford, K. J. and Mayer, G. C.: Problems associated with estimating ground water discharge and recharge from stream-discharge records, Ground Water, 38(3), 331–342, 2001.
Jones, J. P., Sudicky, E. A., Brookfield, A. E., and Park, Y. J.: An assessment of the
tracer-25
based approach to quantifying groundwater contribution to streamflow, Water Resour. Res., 42, W02407, doi:10.1029/2005WR004130, 2006.
Kouwen, N., Soulis, E. D., Pietroniro, A., Donald, J., and Harrington, R. A.: Grouping Response Units for Distributed Hydrologic Modelling, J. Water Res. Pl.-ASCE, 119(3), 289–305, 1993. Larocque, M. and Pharand, M. C.: Dynamique de l’ ´ecoulement souterrain et vuln ´erabilit ´e d’un
30
aquif `ere du pi ´emont appalachien (Qu ´ebec, Canada), Rev. Sci. Eau, 23(1), 73–88, 2010. McDonald, M. and Harbaugh, A.: A modular 3D finite-difference groundwater flow model,
HESSD
7, 7809–7838, 2010 Groundwater contribution to river flows – southern Quebec aquifer M. Larocque et al. Title Page Abstract Introduction Conclusions References Tables Figures J I J I Back CloseFull Screen / Esc
Printer-friendly Version Interactive Discussion Discussion P a per | Dis cussion P a per | Discussion P a per | Discussio n P a per |
MDDEP (Minist `ere du D ´eveloppement Durable, de l’Environnement et des Parcs – Qu ´ebec): www.mddep.gouv.qc.ca/eau/souterraines/sih/index.htm, last access: September, 2006. MER (Minist `ere de l’ ´Energie et des Ressources): Carte g ´eologique Estrie-Beauce au
1:250 000, Map no. 2030 in report MM 85-04, Qu ´ebec, 1985.
Meyer, J. L., Strayer, D. L., Wallace, J. B., Eggert, S. L., Helfman, G. S., and Leonard, N. E.:
5
The contribution of headwater streams to biodiversity in river networks, J. Am. Water Resour. As., 43(1), 86–103, 2007.
Nash, J. E. and Sutcliffe, J. V.: River flow forecasting through conceptual models part I – A discussion of principles, J. Hydrol., 10(3), 282–290, 1970.
Nastev, M., Morin, R., Godin, R., and Rouleau, A.: Developing conceptual hydrogeological
10
model for Potsdam sandstones in southwestern Quebec, Canada, Hydrogeol. J., 16, 373– 388, 2008.
Nastev, M., Rivera, A., Lefebvre, R., Martel, R., and Savard, M.: Numerical simulation of groundwater flow in regional rock aquifers, southwestern Quebec, Canada, Hydrogeol. J., 13, 835–848, 2005.
15
Neitsch, S. L., Arnold, J. G., Kiniry, J. R., Williams, J. R., and King, K. W.: Soil and Water As-sessment Tool. Theoretical documentation, version 2000, Texas Water Resources Institute, College Station, Texas, TWRI Report TR-191, 2000.
NRC (Natural Resources Canada): 1:50 000 topographic maps, Richmond, 31H09, St-Hyacinthe 31H10, Granby 31H7, St-Guillaume d’Upton 31H15, Mont Orford, 31H08, USA,
20
1998, 2000, 2002, 2003.
Par ´e, D.: ´Etude hydrog ´eologique, bassin de la Yamaska, Minist `ere des Richesses Naturelles, Direction g ´en ´erale des eaux, Report E.B.-3, Qu ´ebec, Canada, 51 pp., 1978.
Prichonnet, G., Doiron, A., and Cloutier, M.: Le mode de retrait glaciaire tardiwisconsinien de la bordure appalachienne, au sud du Qu ´ebec, G ´eographie Physique et Quaternaire, 36(1–2),
25
125–137, 1982.
Refsgaard, J. C.: Parameterization, calibration and validation of distributed hydrological mod-els, J. Hydrol., 198, 69–97, 1997.
Rivard, C., Lefebvre, R., and Paradis, D.: Estimation of recharge using multiple methods: an application in the Annapolis Valley, Nova Scotia (Canada), submitted to Hydrogeol. J., 2010.
30
Rivard, C., Vigneault, H., Carrer, G., Muma, M., Turcotte, R., Poirier, C., Rousseau, A. N., Piggott, A. R., Larocque, M., Anctil, F., and Chaumont, D.: Potential impacts of climate change on aquifer recharge in Canada: historical data versus modeling,
HESSD
7, 7809–7838, 2010 Groundwater contribution to river flows – southern Quebec aquifer M. Larocque et al. Title Page Abstract Introduction Conclusions References Tables Figures J I J I Back CloseFull Screen / Esc
Printer-friendly Version Interactive Discussion Discussion P a per | Dis cussion P a per | Discussion P a per | Discussio n P a per |
62nd Canadian Geotechnical Conference and 10th CGS/IAH-CNC Groundwater Confer-ence, 20–24 September, 2009.
Ruehl, C., Fisher, A. T., Hatch, C., Los Huertos, M., Stemler, C., and Shennan, C.: Differential gauging and tracer test resolve seepage fluxes in a strongly-losing stream, J. Hydrol., 330, 235–248, 2006.
5
Sloto, R. A. and Crouse, M. Y.: HYSEP: A computer program for streamflow hydrograph separa-tion and analysis; United States Geological Survey, Water-Resources Investigasepara-tions, Report 96-4040, 46 pp. 1996.
Smakhtin, V.: Environmental flows: a call for hydrology, Hydrol. Process., 21, 701–703, 2007. Smakhtin, V.: Low flow hydrology: a review, J. Hydrol., 240, 147–186, 2001.
10
Therrien, R., McLaren, R. G., Sudicky, E. A., and Panday, S. M.: HydroGeoSphere: A Three-dimensional Numerical Model Describing Fully-integrated Subsurface and Surface Flow and Solute Transport, Groundwater Simulations Group, University of Waterloo, Waterloo, Ontario, 322 pp., 2005.
T `oth, J.: A theoretical analysis of groundwater flow in small drainage basins, J. Geophys. Res.,
15
HESSD
7, 7809–7838, 2010 Groundwater contribution to river flows – southern Quebec aquifer M. Larocque et al. Title Page Abstract Introduction Conclusions References Tables Figures J I J I Back CloseFull Screen / Esc
Printer-friendly Version Interactive Discussion Discussion P a per | Dis cussion P a per | Discussion P a per | Discussio n P a per |
Table 1. Calibrated and measured hydraulic conductivities.
Calibrated Measured
Kh(m/s) zone 1 zone 2 Bolduc et al. (2006) Par ´e (1978) Layer 1 (0–5 m) 1.0.10−4 3.6.10−5 Layer 2 (5–15 m) 1.0.10−4 3.5.10−5 Min: 2.5.10−6 5,7.10−5 Layer 3 (15–30 m) 1.1.10−5 4.6.10−6 Max: 8.7.10−6 (n= 11) Layer 4 (30–55 m) 1.2.10−6 5.8.10−7 (n= 2) Layer 5 (55–95 m) 1.2.10−7 5.8.10−8 Kh/Kv 10 100
HESSD
7, 7809–7838, 2010 Groundwater contribution to river flows – southern Quebec aquifer M. Larocque et al. Title Page Abstract Introduction Conclusions References Tables Figures J I J I Back CloseFull Screen / Esc
Printer-friendly Version Interactive Discussion Discussion P a per | Dis cussion P a per | Discussion P a per | Discussio n P a per |
Table 2. Calibrated parameters for the MOHYSE model.
Parameter Value CE (mm d−1) 5.09 TM (◦C) 0.45 MR (mm d−1 ◦C−1) 3.64 CT (mm d−1) 0.21 CR (mm d−1) 0.0051 CI (mm d−1) 0.33 CB (mm d−1) 0.085 CP (mm d−1) 0.36 A 1.17 B 1.02
HESSD
7, 7809–7838, 2010 Groundwater contribution to river flows – southern Quebec aquifer M. Larocque et al. Title Page Abstract Introduction Conclusions References Tables Figures J I J I Back CloseFull Screen / Esc
Printer-friendly Version Interactive Discussion Discussion P a per | Dis cussion P a per | Discussion P a per | Discussio n P a per |
Fig. 1. The Noire River basin (a) location, (b) geology (simplified from MER, 1985), gauging
HESSD
7, 7809–7838, 2010 Groundwater contribution to river flows – southern Quebec aquifer M. Larocque et al. Title Page Abstract Introduction Conclusions References Tables Figures J I J I Back CloseFull Screen / Esc
Printer-friendly Version Interactive Discussion Discussion P a per | Dis cussion P a per | Discussion P a per | Discussio n P a per |
Fig. 4. Daily total flow rates at the outlet, measured and simulated with the calibrated MOHYSE
HESSD
7, 7809–7838, 2010 Groundwater contribution to river flows – southern Quebec aquifer M. Larocque et al. Title Page Abstract Introduction Conclusions References Tables Figures J I J I Back CloseFull Screen / Esc
Printer-friendly Version Interactive Discussion Discussion P a per | Dis cussion P a per | Discussion P a per | Discussio n P a per | 0 100 200 300 400 500 600 700 800 900 1000 0 5 10 15 20 25 30 35 40 1990 1991 1992 1993 1994 1995 1996 1997 1998 1999 2000 2001 2002 2003 2004 M e a n a n n u a l fl o w (m 3/s ) Evapotranspiration - estimated
Evapotranspiration - simulated with MOHYSE Mean annual flow - measured
Mean annual flow- simulated with MOHYSE
Ev a p o tr a n s p ir a ti o n (mm )
Fig. 5. Comparison between measured and simulated mean annual flow and between
esti-mated evapotranspiration (precipitation minus mean annual flow) and simulated evapotranspi-ration.
HESSD
7, 7809–7838, 2010 Groundwater contribution to river flows – southern Quebec aquifer M. Larocque et al. Title Page Abstract Introduction Conclusions References Tables Figures J I J I Back CloseFull Screen / Esc
Printer-friendly Version Interactive Discussion Discussion P a per | Dis cussion P a per | Discussion P a per | Discussio n P a per | 0 50 100 150 200 250 300 350 400 450 0 50 100 150 200 250 300 350 400 450 Simul a te d h e a d s (m ) Measured heads (m) SIH heads Measured heads ME = 1.3 m MAE = 8.89 m RMSE = 12.4 m r2= 0.94
HESSD
7, 7809–7838, 2010 Groundwater contribution to river flows – southern Quebec aquifer M. Larocque et al. Title Page Abstract Introduction Conclusions References Tables Figures J I J I Back CloseFull Screen / Esc
Printer-friendly Version Interactive Discussion Discussion P a per | Dis cussion P a per | Discussion P a per | Discussio n P a per | 0 5 10 15 20 25 30 35 40
Jan Feb Mar Apr May Jun Jul Aug Sep Oct Nov Dec
B a s e fl o w (m 3/s ) Hydrograph separation Simulated with MOHYSE Simulated with MODFLOW
Fig. 7. Average monthly base flows estimated with the MOHYSE model and from hydrograph
HESSD
7, 7809–7838, 2010 Groundwater contribution to river flows – southern Quebec aquifer M. Larocque et al. Title Page Abstract Introduction Conclusions References Tables Figures J I J I Back CloseFull Screen / Esc
Printer-friendly Version Interactive Discussion Discussion P a per | Dis cussion P a per | Discussion P a per | Discussio n P a per | 0 5 10 15 20 25 1990 1991 1992 1993 1994 1995 1996 1997 1998 1999 2000 2001 2002 2003 2004 B a s e fl o w (m 3/s ) Hydrograph separation a = 0.90 Hydrograph separation a = 0.925 Hydrograph separation a = 0.95 Simulated with MOHYSE
Simulated with MODFLOW (Noire) Simulated with MODFLOW (tributaries)
Fig. 8. Annual base flows from 1990 to 2004 estimated with the MOHYSE model, with the