HAL Id: hal-01525729
https://hal.univ-reunion.fr/hal-01525729
Submitted on 22 May 2017
HAL is a multi-disciplinary open access
archive for the deposit and dissemination of
sci-entific research documents, whether they are
pub-lished or not. The documents may come from
teaching and research institutions in France or
abroad, or from public or private research centers.
L’archive ouverte pluridisciplinaire HAL, est
destinée au dépôt et à la diffusion de documents
scientifiques de niveau recherche, publiés ou non,
émanant des établissements d’enseignement et de
recherche français ou étrangers, des laboratoires
publics ou privés.
Structural control of collapse events inferred by
self-potential mapping on the Piton de la Fournaise
volcano (La Réunion Island)
Stéphanie Barde-Cabusson, Anthony Finizola, Aline Peltier, Marie Chaput, N.
Taquet, S. Dumont, Zacharie Duputel, A. Guy, L. Mathieu, S. Saumet, et al.
To cite this version:
Stéphanie Barde-Cabusson, Anthony Finizola, Aline Peltier, Marie Chaput, N. Taquet, et al..
Struc-tural control of collapse events inferred by self-potential mapping on the Piton de la Fournaise volcano
(La Réunion Island). Journal of Volcanology and Geothermal Research, Elsevier, 2012, 209-210,
pp.9-18. �10.1016/j.jvolgeores.2011.09.014�. �hal-01525729�
Structural
control of collapse events inferred by
self-potential
mapping on the Piton de la Fournaise volcano
(La
Réunion Island)
S.
Barde-Cabusson
a,b,⁎
,
A. Finizola
c,
A. Peltier
d,
M. Chaput
a,c,
N. Taquet
a,c,
S. Dumont
a,e,
Z. Duputel
e,
A.
Guy
e,
L. Mathieu
a,
S. Saumet
a,
F. Sorbadère
a,
M. Vieille
eaLaboratoire Magmas et Volcans, Univ. Blaise Pascal-CNRS-OPGC, 5 rue Kessler, 63038 Clermont-Ferrand, France bInstituto de Ciencias de la Tierra Jaume Almera (CSIC Barcelona), Barcelona, Spain
cLaboratoire GéoSciences Réunion, Université de la Réunion, Institut de Physique du Globe de Paris, Sorbonne Paris-Cité, UMR CNRS 7154, 15 avenue René Cassin,
BP 97715 Saint-Denis cedex 9, La Réunion, France
dInstitut de Physique du Globe de Paris et Université Paris Diderot, Sorbonne Paris-Cité, UMR CNRS 7154 – Géologie des Systèmes Volcaniques, 1 rue Jussieu, 75238 Paris cedex 05, France. e Ecole et Observatoire des Sciences de la Terre, Université Louis Pasteur, Strasbourg, France
a b s t r a c t
Field
surveys were performed on the terminal cone of Piton de la Fournaise in 2006 and 2008 to precisely map the
self
potential (SP) signal and determine the zonation of the hydrothermal activity both on the flanks of the cone and
in
the summit area, including inside the Bory and Dolomieu craters. SP maps inside the cra-ters have been
performed
8 months before the 5–7 April 2007 caldera collapse. Zonations appear both at the scale of the cone and
of
the summit and allow new interpretation of the electrical signal distribution on the terminal cone of Piton de la
Fournaise.
Superimposed to the SP maxima linked to the rift-zones, several areas of SP maxima associated with
collapse
structures have been detected: (1) in the summit area, the Bory and Dolomieu craters show the strongest
SP
values with amplitudes exceeding 2 V with respect to the base of the cone, and with a sharp lateral variation to
the
East, corresponding to the inner boundary of the Dolomieu caldera, collapsed on 5–7 April 2007, and (2) in the
paleo
pit craters surrounding the summit which show amplitudes similar to the Dolomieu–Bory craters. The
analysis
of the variations of the signal with time evi-dences a modification of the fluid flow pattern with a higher
associated
SP signature to the east in 2008. We interpret the amplification of fluid flow to the east in 2008 as a
consequence
of the eastward motion of the eastern flank of the volcano during the April 2007 eruption. The
acquisition
of SP data during two periods separated by the April 2007 eruption turns out to be a good opportunity to
correlate
the SP signal to the Piton de la Fournaise structure and to its evolution in term of hydrothermal and
eruptive
activity.
1. Introduction
The Piton de la Fournaise volcano is located on La Reunion Island, in the Indian Ocean. It is one of the most active volcanoes in the
world with a mean of 2 eruptions per year since 1998 (Peltier et al.,
2009a). The central active cone is located inside a U-shape
depres-sion formed by the Enclos Fouqué/Grandes Pentes/Grand Brûlé, a
major structure opened on the Indian Ocean (Fig. 1). The origin of
this structure (collapse, sliding or combination of both processes) is still debated. In the past 4.5 ka, the eruptive activity usually took place inside this U-shape depression and only a few eruptions
oc-curred beyond its limits (Bachèlery, 1981).
The summit of the terminal cone is characterized by the presence of
two collapse craters: Bory and Dolomieu (Fig. 1). In the past 200 years,
the Bory crater did not experience major volcanic or tectonic activity of
its own (Lénat and Bachèlery, 1990). On the other hand, the Dolomieu
crater morphology was ceaselessly reshaped by successive collapse and eruptive events. The Dolomieu crater was the result of the
coales-cence of several pit craters and, until April 2007, the craterfloor was
leveled by accumulated lavaflows and projections emitted by summit
eruptions (Lénat and Bachèlery, 1990). During the large April 2007
eruption, the Dolomieu crater was affected by a major collapse
increas-ing its depth to 340 m (Michon et al., 2007a; Urai et al., 2007). Today,
the eruptive activity is slowly refilling the crater.
On the Piton de la Fournaise volcano, multiple SP studies have already been carried out in the Enclos Fouqué structure, on the terminal cone
(Lénat, 1987; Malengreau et al., 1994; Zlotnicki et al., 1994; Michel and
Zlotnicki, 1998) and/or on outlying areas of the massif (Boubekraoui
and Aubert, 1999; Levieux, 2004; Lénat, 2007; Barde-Cabusson et al.,
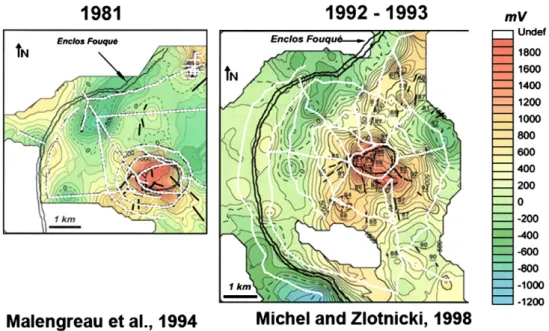
2009).Malengreau et al. (1994) and Michel and Zlotnicki (1998)
pro-duced self-potential maps of the terminal cone and the surrounding
areas (some are presented inFig. 2). They evidenced the coincidence of
high SP values (with respect to the surrounding areas) with the three main eruptive axes of the volcano, i.e. the northern and southern rift
⁎ Corresponding author at: Instituto de Ciencias de la Tierra Jaume Almera (CSIC Barcelona), Barcelona, Spain. Tel.: + 34 934095410.
zones and the N120° rift zone, also well-known as a major structural ori-entation for the island (Bachèlery, 1981; Michon et al., 2009a;Fig. 1).
At a lower scale,Malengreau et al. (1994)attributed the SP maxima
recorded in the summit area to the hydrothermal activity around the
magma reservoir.Lénat et al. (2000)supported this hypothesis from
the interpretation of direct current electrical and transient electromag-netic soundings. The authors interpreted the low resistivity zones inside the cone as altered rocks of the hydrothermal system. In their
interpreta-tion, hydrothermalfluid circulation is thus implicated to explain both the
SP positive peak and the low resistivity zone.
Even if these previous SP studies identified the main eruptive axes
draining hydrothermalfluids, data spacing and measurement
distri-bution did not allow discriminating in detail the smallest structures, especially at the summit, an area strongly affected by fractures. How-ever it is important regarding the recent evolution of the summit area to well constrain the active structure controlling its eruptive activity and its collapses. So, we carried out new detailed SP measurements in order to constrain more precisely the structural limits and the
ac-tive hydrothermal zones at different scales from the edifice (terminal
cone) to the summit, taking into account the previous hydrological
models on Piton de la Fournaise (Join et al., 2005).
This paper presents the results of a self-potential study employed in characterize the electric signal on the Piton de la Fournaise termi-nal cone. The data is discussed to determine the distribution of the hydrothermal activity and its relations with the structure and dynam-ics of this volcano. We also discuss the data in relation with the April 2007 Dolomieu collapse.
2. Data acquisition and processing
Self-potential (SP) signals refer to quasi-static electrical potential anomalies, usually measured at the ground surface of the Earth, that are associated with the occurrence of source current densities
exist-ing at depth (Sill, 1983; Corwin, 1997). Various sources can generate
a difference of potential, but on active volcanoes, the main source of
SP anomalies is related to theflow of the groundwater (Massenet
and Pham, 1985; Ishido et al., 1997; Bedrosian et al., 2007). In this
case, self-potential signals is generated by the streaming potential
ef-fect, related to theflow of the pore water relative to the mineral grain
framework in saturated (Overbeek, 1952; Nourbehecht, 1963) and
unsaturated conditions (Revil and Cerepi, 2004; Linde et al., 2007).
The fact that the SP signal is generally positive in theflow direction
can be understood thanks to the electric double (or triple) layer theory describing the electrochemical interactions occurring at the interface
be-tween a mineral and the pore water (e.g.Revil, 2002and references
therein). In active volcanoes, pH of the hydrothermal system can range
from low (~2) to high (N10) values. However, experimental results
(Revil, 2002) generally gives pH in the range 5–8, and therefore the
zeta potential is usually negative. The surface of silicate and alumino-silicates of volcanic rocks is negatively charged. The corresponding
negativefixed surface charge is counterbalanced by a mobile charge
in the so-called electrical diffuse layer. The diffuse layer has a net charge of opposite sign to the surface charge of the mineral to maintain
a global electroneutrality in the system. Theflow of pore water drags
most of the mobile positive charges of the electrical diffuse layer in the flow direction, generating a positive electric self-potential at the ground surface. Most hydrothermal systems associated with active volcanoes
ev-idence a large positive SP anomaly in the area wherefluid flow is
upwell-ing (e.g.Revil, 2002; Ishido, 2004; Lénat, 2007). However, it is important
to note that in some cases rocks are positively charged in neutral pH conditions and that some volcanoes showing geothermal activity on
theirflanks have shown no positive anomalies associated (Guichet and
Zuddas, 2003; Hase et al., 2003; Aizawa, 2008; Aizawa et al., 2008).
There-fore, in absence of laboratory experiments to measure the zeta potential of the rocks, the classic interpretation of SP data (hydrothermal upwelling corresponding to positive SP zone) constitutes only an assumption.
We acquired a dense dataset of 4621 self-potential measurements (SP) on the Piton de la Fournaise volcano in July and August 2006, i.e. 8 months before the large April 2007 eruption and Dolomieu collapse. We repeated the summit SP mapping in May 2008, one year after the Dolomieu collapse. The SP equipment consisted of a high-impedance
volt-meter (~10 MΩ), a pair of Cu/CuSO4non-polarizing electrodes and an
in-sulated copper cable. During the measurements, the reference and moving electrodes were switched every few hundred meters in order to avoid the systematic error due to electrodes offset. We controlled the con-tact between the electrodes through the ground by checking the electric resistance before each measure point. As a rule of thumb, the electrical re-sistance between the two electrodes should be always ten times smaller
than the internal impedance of the voltmeter (Corwin, 1997).
Data were acquired along 12 profiles crossing the entire terminal
cone, a circular loop around the base of the cone, and a loop around the
summit craters with a regular spacing of 20 m (Fig. 3b). In addition, we
performed a denser measurement network in the summit area with 24
radial lines outside the craters with a 2 m spacing, 15 radial lines from the center of the Dolomieu crater, 4 from the center of the Bory crater,
and 2 circular profiles along the craters inner walls with a 20 m spacing
(Fig. 3a, c, and d). The whole measurement network is interconnected
so that we applied a closure correction along the loops, in order to limit cumulative errors. The order of magnitude of the closure correction is of a few tens of millivolts. Usually the 0 mV reference for SP measurements is taken at the sea or a water table as it provides a constant value in time. Given no such stable reference is available in the studied area, we used the self-potential map of a former study to connect our dataset to the
sea (data fromLevieux, 2004 and Lénat, 2007). The datasets were joined
in at point X 364.709, Y 7650.933 (UTM-WGS84, km), in a zone where
the hydrothermal and eruptive activity is scarce (black arrow onFig. 3b).
3. Data analysis
In this section, wefirst describe the results obtained from the
wide-scale SP map of the terminal cone of Piton de La Fournaise and, in a sec-ond time, we detail the repartition of the anomalies in the summit area. 3.1. Self-potential map of the terminal cone
The entire cone is characterized by negative self-potential values rela-tive to the sea. On a typical profile crossing an active volcanic cone, the SP variations are axis-symmetrical and a radial cross-section generally
dis-plays a W-shape centered on the cone (e.g.Ishido et al., 1997; Zlotnicki
et al., 1998; Revil et al., 2003; Finizola et al., 2004; Ishido, 2004; Lénat,
2007). On the Piton de la Fournaise, the SP map of the terminal cone,
which we will consider as a reference pattern, shows a continuous in-crease of the SP values from the base of the cone to the summit area
(Fig. 3b). We found an average SP/elevation gradient of 1.3 mV/m
(rang-ing from 0.2 to 3.7 mV/m) along profiles on the flanks of the terminal
cone; the average gradient along the 24 radial profiles around the crater
is of 7 mV/m (ranging from 3.1 to 15 mV/m and with profile 6 showing
a gradient of−12.2 mV/m); for the Dolomieu and Bory craters, the
SP/elevation graph shows a quasi-vertical alignment of the points
(Fig. 4). The highest SP variation from the base of the cone to the craters
is about 2.3 V. The northern, southern, and easternflanks are the seats of
three main elongated radial anomalies compared to the reference pat-tern (Fig. 3b).
A radial SP anomaly extends on the northernflank with a roughly N150° direction, near the crater, shifting to a N10° direction in the
lower part of the cone (Fig. 3b). The southernflank is affected by a N25°
similar radial anomaly. Each of these two elongated anomalies is about
1 km large and defines a SP maximum of about 1 V amplitude with
re-spect to the surrounding areas. Farther east and west from those main axes the SP anomalies vanish progressively. They seem to extend on both sides of the summit area, in the north and in the south, beyond the investigated area.
On the easternflank of the cone, a more diffuse SP maximum, outlined
by the SP contour lines, highlights a significant anomalous zone (profiles
19 and 21 onFig. 3b). The maximum SP value is about−1600 mV in the
lower part of the cone (at an elevation of 1900 m), and higher in the cra-ter vicinity. It means the anomaly is about 400 mV and 600 mV lower than the maximum values registered on the northern and southern flanks respectively.
Fig. 5shows a good correlation between the location of the
erup-tivefissures since 1981 and the position of the SP maxima. In
partic-ular the most recent eruptivefissures are located on the highest SP
values and their repartition follows a very similar orientation than that of the northern and southern rift zones. In the NNE direction,
no SP maximum anomaly appears, while eruptivefissures exist.
How-ever this direction is barely followed by dykes, compared to the rift
zones. Only 4 dykes affected this direction in 35 years (Peltier et al.,
2009a).
These three main elongated anomalies were already visible in 1992–
1993 and also in 1981 but with a lower amplitude on the northern one
(Fig. 2;Malengreau et al., 1994; Michel and Zlotnicki, 1998).
Fig. 3. (a) Self potential maps of the summit area of the Piton de la Fournaise in 2006, and (c) 2008, (d) difference between them, and (b) self potential map of the terminal cone in 2006. BN stands for Bory north, DNW for Dolomieu north-west, DN for Dolomieu north, DNE for Dolomieu north-east, DE for Dolomieu east, and DS for Dolomieu south. White dots are the measured points, black numbers refer to the profiles, and the black arrow points at the measured point used to connect our dataset to a previous one (Levieux, 2004 and Lénat, 2007) in order to reference our maps to the sea (see text). (For interpretation of the references to color in thisfigure legend, the reader is referred to the web of this article.) .
Fig. 4. Plot of elevation versus SP for the 2006 dataset of Piton de la Fournaise. Note the globally positive correlation between SP and elevation over the whole dataset. The global gradient was estimated graphically, plotting the corresponding trendlines for theflanks of the cone and for the summit area (profiles surrounding the craters) data. The value for each profile has also been estimated to give a range of the values en-countered (see text).
3.2. Detailed self-potential map of the summit area 3.2.1. Self-potential zonation along the crater boundaries
With a color scale adapted to the SP amplitude of the summit area,
interesting information appears about the SP signal zonation (Fig. 3a
and c). The strongest anomalies are centered on the Bory and Dolomieu
craters. A significant SP difference of up to several hundred millivolts
ex-ists between the craterfloor and the rims of these two craters, except (1)
on the northern border, close to profiles 3–4, (2) on the northwestern
border, on profile 7, and (3) on the southeastern border, between
pro-files 15 and 21. For instance, in the northeastern side of Dolomieu, we observe a difference of approximately 600 mV between the rim and
the Dolomieu craterfloor. The usual hydrogeological gradients observed
on the inactiveflanks of Piton de la Fournaise (i.e. topographic effect)
ranges between 0 and−3 mV/m (Lénat, 2007). The northeastern crater
wall was about 30 m high at the time of the survey, which is too small to explain such a difference of electrical potential by a topographic effect.
Moreover, it is interesting to note that along the north–south rift zone
axis,five profiles also displays strong SP variations (of several hundreds
of mV) between the rim and thefloor of Dolomieu crater (see profiles 5,
6, 12, 13 and 14 onFig. 3a).
3.2.2. Self-potential zonation inside the Dolomieu crater
OnFig. 3a the amplitude of the SP signal and the orientation of the
isolines highlight a clear zonation between the eastern third and the rest of the Dolomieu crater (also seeFig. 6). The eastern part of the
Dolo-mieu crater is marked by a nearly E–W SP spatial variation from −
1100 mV along the crater wall up to−500 mV near the center of the
crater, 500 m farther. The isolines show a NNW–SSE orientation while
they do not follow a particular direction on the rest of the craterfloor.
This feature observed on aflat area reflects a clear heterogeneity of
the Dolomieu crater structure before the April 2007 collapse. 3.2.3. Self-potential anomalies around the craters
On the external edge of the Dolomieu and Bory craters,five
small-scale SP maxima are individualized (red-orange color inFig. 3a and c).
These anomalies are located respectively: (1) south of the Dolomieu
crater, crossing profiles 16 and 17 (DS inFig. 3a and c), (2) north of the
Dolomieu crater, crossing profile 4 (DNW inFig. 3a and c), (3) north of
the Bory crater, crossing profile 7 (BN inFig. 3a and c), (4) north of the
Dolomieu crater between profiles 2 and 3 (DN inFig. 3a and c), (5)
south-east of the Dolomieu crater, crossing profile 20 (DE inFig. 3a and c).
(1) In the south, the DS anomaly is 200–250 m wide and globally
su-perposed to the Petit Plateau paleo-pit crater. This later formed
around 1791 (Bachèlery, 1981), consists in surface of a system
of concentric fractures that delineates the hidden collapsed struc-ture (Peltier et al., personal communication). This is one of the
areas showing the maximum fracture andfissure density around
the Dolomieu crater (seeFig. 5andMichon et al., 2009a). The
re-lated SP maximum has a wider extension than the superficial
structural boundary of the Petit plateau pit crater (Fig. 5).
(2) The DNW SP anomaly to the north of Dolomieu (profile 4 on
Fig. 3a and c) corresponds as well to a highly fractured zone.
It is related to the hidden boundary of a larger paleo-pit crater
named Pre-Bory pit crater (seeFig. 5; Lénat and Bachèlery,
1990; Michon et al., 2009a). Large part of this SP maximum is
located just inside the boundary of Pre-Bory pit crater.
(3) The BN SP anomaly (profile 7 onFig. 3a and c) is located also just
inside the Pre-Bory pit crater limits and seems to extend at least
up to the northern extremity of profile 6 with a slightly lower
SP amplitude.
(4) The DN SP anomaly (between profiles 2 and 3 onFig. 3a and c) is
located close to the Pre-Bory pit crater but corresponds to another structural boundary named Soufrière pit crater, formed in 1964 (Fig. 5;Carter et al., 2007).
(5) The DE SP anomaly (profile 20 onFig. 3a and c) located on the
eastern border of Dolomieu, did not appear on the 1981 SP
map (Malengreau et al., 1994) but was present in 1992
(Fig. 2: map fromMichel and Zlotnicki, 1998) and still exists
in 2006 (our survey). Strikingly, several dykes (18–19
Decem-ber 1975, SeptemDecem-ber 1985, January 1990, July 1991, July 1999 and August 2004 dykes) cross this particular point. Shortly
after our survey, the 30 August 2006 eruptivefissure crossed
Fig. 5. Distribution of the eruptivefissures visible in the field (thin black line, afterMichon et al., 2009a). Light blue lines are eruptivefissures from 1998 to 2007 (Peltier et al., 2009a). The bold black lines are the estimated dyke location associated to proximal eruptions between 1981 and 2006 fromMichon et al. (2009a). PB stands for Pre-Bory pit crater, S for Soufrière pit crater, and PP for Petit Plateau pit crater. Dark blue lines are the major structural limits influencing SP measurements (see text). (For interpretation of the refer-ences to color in thisfigure legend, the reader is referred to the web of this article.) .
the crater wall at the same point as the December 2003 erup-tion did before.
Even if the position of the main anomalies is not modified from one
survey to the other, by calculating the difference between the 2008 and
2006 SP maps (Fig. 3d) we can evidence a significant variation of the
amplitude of the signal in several areas. We identify an increase of the SP signal at the eastern limit of the northern and southern rift zones and in the southern part of the N120° rift zone, around the Dolomieu crater, (red shades) and a decrease of the signal on the southern rift zone and in part of the northern rift zone (dark blue shades).
4. Discussion: self potential as a marker of the structures controlling eruptive and collapse events
The entire cone is characterized by negative self-potential values rel-ative to the sea. The SP distribution depends on the hydrogeological pat-tern of the study area. Recent studies show that cold and dilute
descending groundwater is important for SP generation (Ishido, 2004;
Aizawa et al., 2009). Basically, they show that negative SP zones
gener-ated by infiltration are the actual anomalies while the SP maxima are
created by the surrounding minima. In the case of Piton de la Fournaise,
Join et al. (2005)simulation gives hydraulic confirmation of a the
presence of a continuous aquifer and of a central groundwater dome.
In the Enclos Fouqué Caldera (Fig. 1), the water table is then nearly
par-allel to the topography (Join et al., 2005). Taking a reference at the sea
means we consider the water table is at sea elevation and that the
inter-pretation of SP negative anomalies is downwardfluid flow (e.g. see
Lénat, 2007). Following the hydrogeological model proposed byJoin et
al. (2005), in our maps, hydrothermal upwelling will then be marked
by SP maxima and positive SP/elevation correlations and infiltration
by some SP minima and negative SP/elevation correlations. Moreover,
we will interpret the SP data jointly with information fromLénat et al.
(2000)on the resistivity structure of the terminal cone and their
inter-pretations in term of hydrothermal activity.
In the typical W-shaped SP signal of active volcanic cones cited before, some authors interpret the two minimums of the W signal as the
transi-tion between the hydrogeologic SP signature of the lowerflanks (negative
SP/elevation correlation) and the hydrothermal SP signature of the upper part of the edifice (positive SP/elevation correlation) (e.g.Zlotnicki et al.,
1998; Finizola et al., 2004; Lénat, 2007). Just considering the terminal
cone of Piton de la Fournaise volcano, no W-shape signal and very few
negative SP/elevation correlations have been observed (Fig. 4). At the
scale of the Enclos Fouqué caldera, in the western part, along the SP
max-imum evidenced byMichel and Zlotnicki (1998)is possibly compatible
with a transition to the hydrogeological area but the relationship between
Fig. 6. (a) Photo taken on the 6th April 2007 (courtesy of“Gendarmerie nationale”) from Bory crater, looking at the east and (b) its interpretation; red shapes correspond to fresh lavaflows emitted during the 30 August 2006–1 January 2007 eruption, and not yet cold in subsurface in April 2007. (c) On the eastern side of the Dolomieu crater, our 2006 SP map shows a pattern that can be interpreted as the control of the hydrothermal circulation by a pre-existing fault inside Dolomieu (white strokes). In 2007 this structure led to the for-mation of the eastern plateau during one stage of the Dolomieu caldera collapse. (d) Schematic structural map fromMichon et al.(2007a). (For interpretation of the references to color in thisfigure legend, the reader is referred to the web of this article.)
SP signal and elevation cannot be established (flat topography in this area). The amplitude of the SP signal on the three main positive SP radial anomalous areas and the positive SP/elevation correlation encountered
on all theflanks of the terminal cone, strongly suggests (1) that the
whole terminal cone of Piton de la Fournaise is affected by rising of
hydro-thermalfluids and (2) that the summit craters and the northern,
south-ern, and eastern axes are preferential paths for hydrothermalfluids.
The strong hydrothermal risingfluids preferentially located in the
upper part of the cone and along the three rift zones can hide the presence
of infiltration in the surrounding areas. An exception is found along profile
1 (Fig. 3b) that shows a SP minimum (DNE) associated to a negative
SP/elevation gradient (−1.25 mV/m). This suggests that DNE minimum
could evidence a preferential downward waterflow pathway (Fig. 7).
The detailed summit SP map and the general SP map of the entire cone of the Piton de la Fournaise volcano offer a good opportunity to discuss the importance of the structural boundaries in controlling
hy-drothermalfluid flows and potentially magmatic injection. The general
SP map shows that the entire edifice is affected by hydrothermal
activ-ity, but with different intensities from an area to another.
Ishido (2004)demonstrated that, if an electrical conductive
struc-ture (as hydrothermally altered rock) extending to deep levels is pre-sent below the summit area of a volcanic cone, SP around the summit is substantially increased, resulting in the characteristic strong positive anomaly observed in this area of active volcanoes. Considering the
am-biguity in interpreting SP data alone (Finizola et al., 2006; Revil et al.,
2008; Finizola et al., 2009), it is interesting to compare our SP results
and interpretation (seeFig. 7) with the electrical resistivity
measure-ments obtained byLénat et al.(2000), on the same area, in 1987–1992.
The authors led a study of the geoelectrical structure of the central part of Piton de la Fournaise volcano. Beneath the highly active summit area, the authors observed an electrical conductor rising below the
ter-minal cone (resistivity values b20 Ωm below ~500 m depth and
b250 Ωm from ~500 m up to ~300 m depth) that they interpreted as an altered hydrothermal zone. The overburden is composed of resistive
terrains (1000 to 3000Ωm and N8000 Ωm for the shallowest 100 m),
typically interpreted as water-sparse region, not significantly affected
by hydrothermal circulation (e.g.Aizawa et al., 2009; Garcia and Jones,
2010; Revil et al., 2010). On Piton de la Fournaise, fresh lavaflows show
resistivity ranging 10,000 to 100,000Ωm so that resistivities of 1000 to
3000Ωm can mean a weak hydrothermal circulation. However, areas
af-fected by intensive hydrothermal activity are usually characterized by
re-sistivities ranging from a fewΩ m to few hundreds Ω m (e.g.Revil et
al., 2004,2008; Finizola et al., 2009,2010; Revil et al., 2011). In our
survey performed in July 2006, 9 months before the April 2007
cal-dera collapse, several evidences attest to an intensification of the
hy-drothermal activity in the shallower part of the cone below the
craters, with respect to the conditions during the 1987–1992 period
(Lénat et al., 2000): (1) The sharp SP horizontal gradient (~1000 mV in
a few tens of meters) between the inner and external parts of the
Dolo-mieu crater (Fig. 3a) suggests a shallow and strong lateral variation in
thefluid circulation pattern and/or in the resistivity structure. (2) Just
after the April 2007 collapse, hot areas have been observed on the ground
surface through IR camera inside the Dolomieu collapse structure (
Stau-dacher, 2010), and (3) hydrothermal alteration has been observed along
the cliffs left by the 2007 Dolomieu caldera collapse between the surface and 300 m depth (Peltier et al., personal communication). Because
resis-tivity is highly sensitive to hot and mineralized volcanicfluids like
hydro-thermalfluids, it is possible that the resistivity structure changed between
1987–1992 and 2006 due to the hydrothermal/magmatic activities
(Aizawa et al., 2011, and reference therein). The top 300 m beneath
Dolo-mieu crater may have turned to be affected by more intense hydrother-mal activity before the 2007 collapse, responsible for the strong SP maxima measured in July 2006 in the crater area. Based upon these con-siderations we can interpret the signal observed on Piton de la Fournaise in terms of spatial variations of underground hydrothermal activity.
If some geological and geophysical clues have been found to con-strain the shallowest part of the hydrothermal system before the 2007 collapse event, it is not easy to infer the hydrothermal circula-tion condicircula-tion at depth from SP data alone. SP sources being broadly
distributed in the volcanoes (Yasukawa et al., 2005; Aizawa et al.,
2009), the large wavelength (~1 km) superimposed on the northern
and southern rift zones (Fig. 5) do not give a strong constrain on
the depth of the SP source. Considering the results obtained by
Lénat et al. (2000), with resistivity valuesb20 Ωm, up to the
maxi-mum depth of investigation (~1000 m below the surface), we can reasonably assume that the hydrothermal system is intensively active up to that depth. Below 1000 m depth, we have no data to constrain
the hydrothermalfluid flow, as shown inFig. 7.
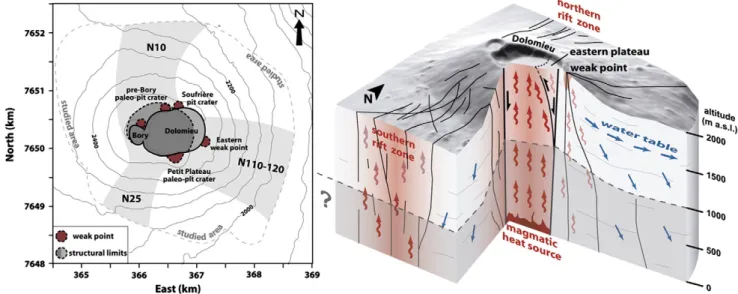
Fig. 7. Synthetic map (left) and 3-D block (right) of the main features evidenced by the self potential signal and of our main conclusions. In the synthetic map, N10°, N25°, and N110–120° refer to the direction of the rift zones (light-grey areas). The red points refer to the five SP maximum evidenced around Dolomieu and Bory craters. In the 3-D block, the black arrows highlight the main structural limits involved in the Dolomieu April 2007 collapse; the red arrows represent rising hydrothermalfluids. Hydrothermal circulation at depth is constrained up to 1000 m below the topography using electrical resistivity data fromLénat et al. (2000). The blue arrows represent infiltration and lateral cold ground-waterflow (water table) as proposed byJoin et al. (2005). (For interpretation of the references to color in thisfigure legend, the reader is referred to the web of this article.)
Based on our SP study, we highlight the main zones of hydrothermal release of the Piton de la Fournaise and describe various types of struc-tural boundaries:
(1) Summit crater boundaries: The major structure draining
hydro-thermal fluids is the Dolomieu–Bory crater zone (Fig. 3). The
Dolomieu–Bory boundary is a well-known structural limit.
Major part of the dykes associated to summit and proximal
erup-tions start around this limit (Peltier et al., 2009a). The main SP
anomaly then underlines the major rule of this area on the magma transit to the surface on Piton de la Fournaise. The border
faults of these two craters (Fig. 5) constitute a major structural
barrier reducing drastically the radial diffusion of hydrothermal fluids into the ground, outside the craters. The importance of the
Dolomieu–Bory structural boundaries on the control of
hydro-thermalfluid flow between the inner and the outer part of the
Dolomieu–Bory craters is also attested by the data collected
after the 5–7th April 2007 Dolomieu caldera collapse. Indeed,
the location of the main anomalies on the SP maps of the summit area realized before (July 2006) and after (May 2008) the
Dolo-mieu collapse is similar (Fig. 3a and c). This means that this
major collapse event did not affect significantly the fluid flow
pat-tern in the vicinity of the collapsed area. This can be easily under-stood through the geological evolution of the summit area, which has been affected by several collapse and pit-crater events. The most recent ones inside the Dolomieu crater took place between 1931 and 1935 (east), in 1953 (southwest), in 1961 (southwest), in 1986 southeast), in 2002 (southwest) and in 2007 (the whole
Dolomieu crater) (Peltier et al., 2009b). These events were
alter-nated with periods of eruptive activity refilling the craters
through the accumulation of lavaflow. The succession of collapse
events along the same crater limits (the current Dolomieu–Bory
limits) demonstrates the individualization of a rock column
delimited by the Dolomieu–Bory boundaries. Such
individualiza-tion of a rock column explains the localizaindividualiza-tion of the main
hydro-thermal fluid circulations inside the craters and why the last
collapse of April 2007 does not affect significantly the
hydrother-malfluid flow pattern. Also, the absence of significant changes in
the position of the SP anomalies and the absence of amplitude variation for most part of this area between July 2006 and May 2008 (Fig. 3a, c, and d) after such a collapse, attest that the
pre-existing Dolomieu–Bory structural boundaries were acting as a
barrier for lateralfluid flow before the April 2007 collapse.
Inside the Dolomieu crater, another structural barrier for fluid
flow has been evidenced in the eastern side of the crater. The SP zonation previously described affects the whole Dolomieu crater
with a NNW–SSE orientation of the SP isolines on the eastern
side of the crater. There was no significant zonation related to
the repartition of the recent lavaflows and eruptive vents or
fis-sures on the Dolomieufloor. These considerations make highly
improbable the hypothesis of shallow hydrothermal SP sources
influencing the observed SP pattern. Rather than a shallow
tran-sient anomaly, we think that the SP signal in Dolomieu was re-vealing a hidden pre-existing fracture or fault system to the east
controlling the hydrothermalfluid rising from depth in the crater
(Figs. 6 and 7). This hypothesis matches the interpretation
pro-posed byMichon et al. (2009b)on the Dolomieu caldera collapse
process. The authors show that the structure of the new Dolomieu caldera and its evolution during the collapse is explained by the collapse of a coherent block limited by vertical to outward dipping fractures at depth and sub-surface normal fractures. According to
thefirst observations, on April 7, 2007, the Dolomieu collapse
af-fectedfirst the western and the northern part of the pre-existing
Dolomieu crater while a wide annular plateau corresponding to
the pre-existing floor of Dolomieu was remaining in the east
(Michon et al., 2007a). On April 10 the caldera was enlarged and
only few perched terraces remained from the eastern plateau. The authors add that the similar contours of Dolomieu before the collapse and of the new caldera, remarkably shows the control of the pre-existing structures in the April 2007 caldera collapse. In the same way, we think that the inner structure of the crater con-trolled the successive phases of the collapse and that the SP sig-nal was marking this particular structure at least 1 year before the collapse. The Dolomieu collapse would result from the com-bined effect of a progressive destabilization of the rock column above the magma chamber since 2000, and the large amount of magma withdrawal during the early stage of the 2007 eruption
(Michon et al., 2007a; Peltier et al., 2009b). The eastern plateau
remaining in thefirst phases of the Dolomieu collapse may be
as-sociated to a pre-existing east-dipping fracture individualizing an eastern block in the rock column beneath Dolomieu. The
frac-ture draining hydrothermalfluids, this block may have been
rel-atively isolated from the rest of the crater in terms of fluid
advection. This would explain a SP signal progressively decreas-ing from a hidden fracture to the inner part of the isolated block.
Our data matches with a more or less N–S fracture running from
the middle-eastern part of Dolomieu at shallow depth to the eastern edge of the crater at depth (Fig. 6).
(2) Pit crater boundaries: Just outside the Dolomieu and Bory craters, we evidenced thanks to our high resolution map small scale pos-itive anomalies whose amplitudes are similar to the highest am-plitude inside the Dolomieu and Bory craters. The anomalies of highest amplitude are related with three old pit-crater struc-tures, which are Petit Plateau, Pre-Bory, and Soufrière (see
Figs. 5 and 7for location). In all these cases, the former pit craters
cut either the Dolomieu and/or the Bory crater rims. Considering that pit craters are highly fractured zones, they constitute more
permeable areas explaining the local rise of hydrothermalfluid
flow, of same intensity than inside the Dolomieu and Bory cra-ters. On another hand, the SP anomaly related to the Petit Plateau pit crater being larger than the surface fracture network, a hid-den and larger collapse structure could be associated to this structure, at depth (Fig. 5).
(3) Temporally dyke injection pathways: The only small scale maxi-mum SP anomaly not related with pit crater structure, and already
visible in 1992 (Fig. 2) is the south-eastern Dolomieu anomaly (DE
onFig. 3a and c) located on the N120° rift zone and associated to
dyke intrusions feeding eruptions close to this area. Three
erup-tions associated to eruptivefissures and dykes have been crossing
recently this site (e.g.: in July 1999, August 2004, and August 2006;
Figs. 5 and 7). It is possible that this area was draining
hydrother-malfluids along a major structure of the edifice where dykes are
preferentially injected. This SP anomaly was already visible on
the map made byMichel and Zlotnicki (1998;Fig. 2) in 1992, a
few months after the July 1991 eruption and two years after the January 1990 eruption, which occurred both in this area. On the
map of 1981 (Malengreau et al., 1994;Fig. 2), no such anomaly
is visible revealing that the SP intensity in this area is directly relat-ed to dyke emplacement; inderelat-ed in 1981 the last dyke injectrelat-ed in this area was in December 1975. So this anomaly can be due to (1) the opening and re-opening of fractures during dyke injections
east of the Dolomieu crater which favor temporally deepfluid
hy-drothermal circulation in this area or to (2) the shallow advection
offluids in the first meters of the ground in recent emplaced lava
flows (Barde-Cabusson et al., 2009).
(4) Main rift zone pathways: Other maximum SP anomaly corre-sponds to the three main axes pointing to the summit area. The
diffuse N110–120° axis corresponds also to a main direction of
La Réunion Island associated with the lithospheric structural
an-isotropy located beneath the island (Michel and Zlotnicki, 1998;
Michon et al., 2007b). We can distinguish the main N–S axis,
N110–120° axis of lower intensity. These highly fractured zones
are preferential pathways for hydrothermal risingfluids and are
thus zones of major permeability and of low mechanical resis-tance and therefore of major probability of eruption. Indeed, these high permeability areas are preferential pathways for both fluid from the hydrothermal system or for magma rising from depth. On Piton de la Fournaise like in all active hydrothermal fields, the amplitude of the SP anomalies can vary with time
(Fig. 2; e.g.;Michel and Zlotnicki, 1998) without changing their
spatial distribution, revealing that they are strongly controlled
by the structure of the edifice i.e. by the lithological contrasts,
the repartition of the fractures and eruptivefissures. It is then
not surprising that the preferential hydrothermal circulation un-derlines the well-known northern and southern rift zones of the volcano (Figs. 2, 3, and 5).
The rift zones concentrate recent vents, dykes, eruptivefissures
and young lavaflows (Fig. 5). Since 1998, the activity of Piton de la
Fournaise has been characterized by an average of two eruptions
per year producing mostly lavaflows. As a consequence, the recent
(b10 years) lava overburden is significant on the rift zones. Therefore,
the SP positive anomalies can probably be due to (1) transient
sources associated to shallow advection offluids in the first meters
of the ground (i.e. recent lavaflows;Barde-Cabusson et al., 2009)
and (2) deep convection in a hydrothermal system, affecting several hundred meters below the surface (wide-scale convection cells). A denser SP mapping could be compared to the map of the dated lava flows intersecting the rift zones in order to distinguish locally the sources of the SP signal among these two.
The SP signal variations between our 2006 and 2008 surveys high-light a strong increase of the signal (more than 350 mV) at the eastern
limit of the main N–S rift zone and in the N120° rift zone and a
signifi-cant decrease (up to−300 mV) on the N–S rift zone itself (Fig. 3d). At
Piton de La Fournaise, structural analyses and geodetic measurements have shown that the central cone was affected by a preferential
east-ward motion (Letourneur et al., 2008; Peltier et al., 2009aand
refer-ences therein). The flank instability can be explained by stress
accumulation on the unbuttressed easternflank due to the successive
intrusions and accumulation of magma in the reservoir. The preferential
motion of the easternflank was especially well visible during the large
distal eruption of April 2007 (Augier et al., 2008; Peltier et al., 2009b). Interferometric data reveal a motion of up to 80 cm of the eastern
flank towards the sea (Augier et al., 2008). The dipolar SP signal
ob-served: increase of the SP signal on the eastern limit of the N–S rift
zone and decrease on the N–S rift zone itself can be due to an increase
of the permeability along this eastern limit following the large eastward
motion of the easternflank during the April 2007 eruption. The SP
de-crease observed on the southern rift zone (maximum−300 mV) and
on part of the northern rift zone (maximum−200 mV on DNW) can
evidence an associated balancing offluid flow circulation in the system.
Hydrothermalfluids flow migrated to the more permeable area
deplet-ing thefluid supply in the main hydrothermal zones. Interestingly, no
significant variation has been measured on the western part of the
northern rift zone, on DS and DE. Thefluid circulation inside these
areas may be isolated from the rest of the system by their own fracture network, explaining why no disruption is observed.
5. Conclusions
The SP dataset collected in 2006 allowed us to build a global map of the Piton de la Fournaise's terminal cone and a detailed map of the summit area. We compared it to previous SP maps and confront our
results to the geological history of the edifice to make the following
conclusions, also synthesized onFig. 7:
(1) In addition to the strong SP anomalies characterizing the north-ern and southnorth-ern rift zones, the N120° radial anomaly, and the
summit area, the entire terminal cone is affected by an extend-ed hydrothermal activity, which prevents from observing a classical W-shaped SP signal of an active volcanic cone.
(2) The main hydrothermal release has been identified inside the
Dolomieu–Bory craters. Their limits are major structural
bar-riers forfluid circulation.
(3) The SP mapping in the Dolomieu crater reveals a hidden pre-existing east-dipping fracture or fault system, which controlled the Dolomieu collapse during the April 2007 eruptive crisis of Piton de la Fournaise.
(4) As well, the former pit craters surrounding the Dolomieu–Bory
craters appear as mainfluid paths deeply connected to the central
Dolomieu–Bory hydrothermal fluid path. Also the Petit Plateau SP
anomaly having a larger extension than the visible associated frac-tures suggests that the pit crater has a greater extension at depth. (5) The SP increase between 2006 and 2008, along the eastern limit
of the N–S rift zone, can be associated to the eastward motion of
the easternflank of the volcano during the April 2007 eruption.
SP anomalies can highlight zones of major permeability and of low mechanical resistance, and therefore of major probability of deformation, rupture and/or eruption. Using SP variations to distinguish eruption pre-cursors and low mechanical resistance areas would require a continuous monitoring of the key areas showing the strongest SP anomalies. Acknowledgments
Thefield work was supported by The Université de la Réunion
(BQR 2005–2006). We are particularly grateful to Benoît Fragnol
and Frédéric Lorion for their help in acquiring the SP data in
particu-larly wet and cold conditions. Logistic andfield support from
Labora-toire GéoSciences Réunion, ObservaLabora-toire Volcanologique du Piton de La Fournaise, Benoît Welsch, Laurent Michon, Vincent Famin, Nicolas Villeneuve, and Alexandre Nercessian were greatly appreciated. We are grateful to Jean Vandemeulebrouck and Koki Aizawa whose com-ments helped to substantially improve the manuscript. This is IPGP contribution number 3197.
References
Aizawa, K., 2008. Classification of self-potential anomalies on volcanoes and possible interpretations for their subsurface structure. Journal of Volcanology and Geother-mal Research 175 (3), 253–268. doi:10.1016/j.jvolgeores.2008.03.011.
Aizawa, K., Uyeshima, M., Nogami, K., 2008. Zeta potential estimation of volcanic rocks on 11 island arc-type volcanoes in Japan: implication for the generation of local self-potential anomalies. Journal of Geophysical Research 113, B02201. doi:10.1029/2007JB005058.
Aizawa, K., Ogawa, Y., Ishido, T., 2009. Groundwaterflow and hydrothermal systems within volcanic edifices: delineation by electric self-potential and magnetotellu-rics. Journal of Geophysical Research, B: Solid Earth 114.
Aizawa, K., Kanda, W., Ogawa, Y., Iguchi, M., Yokoo, A., Yakiwara, H., Sugano, T., 2011. Temporal changes in electrical resistivity at Sakurajima volcano from continuous magnetotelluric observations. Journal of Volcanology and Geothermal Research 199 (1–2), 165–175. doi:10.1016/j.jvolgeores.2010.11.003.
Augier, A., Froger, J.L., Cayol, V., Fukushima, Y., Tinard, P., Souriot, T., Mora, O., Staudacher, T., Durand, P., Fruneau, B., Villeneuve, N., 2008. The April 2007 eruption at Piton de la Four-naise, Réunion Island, imaged with ENVISAT-ASAR and ALOS-PALSAR data. USEReST Workshop, Napoli, Italy.
Bachèlery, P., 1981. Le Piton de la Fournaise (Ile de la Réunion). Etude volcanologique, structurale et pétrologique. PhD thesis, Univ. Clermont-Ferrand II, 215 pp. Barde-Cabusson, S., Levieux, G., Lénat, J.-F., Finizola, A., Revil, A., Chaput, M., Dumont, S.,
Duputel, Z., Guy, A., Mathieu, L., Saumet, S., Sorbadère, F., Vieille, M., 2009. Tran-sient self-potential anomalies associated with recent lavaflows at Piton de la Four-naise Volcano (Réunion Island, Indian Ocean). Journal of Volcanology and Geothermal Research 187, 158–166. doi:10.1016/j.jvolgeores.2009.09.003. Bedrosian, P.A., Unsworth, M.J., Johnston, M.J.S., 2007. Hydrothermal circulation at
Mount St. Helens determined by self-potential measurements. Journal of Volcanol-ogy and Geothermal Research 160, 137–146.
Boubekraoui, S., Aubert, M., 1999. Apport de la méthode des potentiels spontanés à la reconnaissance géologique et hydrogéologique des terrains volcaniques superfi-ciels du Grand-Brûlé (Réunion, Océan Indien). Hydrogéologie 1, 43–51. Carter, A., van Wyk de Vries, B., Kelfoun, K., Bachèlery, P., Briole, P., 2007. Pits, rifts and
slumps: the summit structure of Piton de la Fournaise. Bulletin of Volcanology 69, 741–756. doi:10.1007/s00445-006-0103-4.
Corwin, R.F., 1997. The self-potential method for environmental and engineering appli-cations: geotechnical and environmental geophysics. In: Ward, H. (Ed.), Investiga-tions in Geophysics: Soc. Expl. Geophys, vol. 5, p. 1.
Finizola, A., Lénat, J.-F., Macedo, O., Ramos, D., Thouret, J.-C., Sortino, F., 2004. Fluid cir-culation and structural discontinuities inside Misti volcano (Peru) inferred from self-potential measurements. Journal of Volcanology and Geothermal Research 135, 343–360.
Finizola, A., Revil, A., Rizzo, E., Piscitelli, S., Ricci, T., Morin, J., Angeletti, B., Mocochain, L., Sortino, F., 2006. Hydrogeological insights at Stromboli volcano (Italy) from geoe-lectrical, temperature, and CO2soil degassing investigations. Geophysical Research
Letters 33, L17304. doi:10.1029/2006GL026842.
Finizola, A., Aubert, M., Revil, A., Schütze, C., Sortino, F., 2009. Importance of structural history in the summit area of Stromboli during the 2002–2003 eruptive crisis inferred from tem-perature, soil CO2, self-potential, and electrical resistivity tomography. Journal of
Volca-nology and Geothermal Research 183, 213–227. doi:10.1016/j.jvolgeores.2009.04.002. Finizola, A., Ricci, T., Deiana, R., Barde-Cabusson, S., Rossi, M., Praticelli, N., Giocoli, A.,
Romano, G., Delcher, E., Suski, B., Revil, A., Menny, P., Di Gangi, F., Letort, J., Peltier, A., Villasante-Marcos, V., Douillet, G., Avard, G., Lelli, M., 2010. Adventive hydro-thermal circulation on Stromboli volcano (Aeolian Islands, Italy) revealed by geo-physical and geochemical approaches: implications for generalfluid flow models on volcanoes. Journal of Volcanology and Geothermal Research 196, 111–119. doi:10.1016/j.jvolgeores.2010.07.022.
Garcia, X., Jones, A.G., 2010. Internal structure of the westernflank of the Cumbre Vieja volcano, La Palma, Canary Islands, from land magnetotelluric imaging. Journal of Geo-physical Research, B: Solid Earth 115 (12), B07104. doi:10.1029/2009jb006445. Guichet, X., Zuddas, P., 2003. Effect of secondary minerals on electrokinetic phenomena
during water–rock interaction. Geophysical Research Letters 30 (13), 1714. doi:10.1029/2003GL017480.
Hase, H., Ishido, T., Takakura, S., Hashimoto, T., Sato, K., Tanaka, Y., 2003.ζ potential measurement of volcanic rocks from Aso caldera. Geophysical Research Letters 30 (23), 2210. doi:10.1029/2003GL018694.
Ishido, T., 2004. Electrokinetic mechanism for the“W”-shaped self-potential profile on volcanoes. Geophysical Research Letters 31, L15616. doi:10.1029/2004GL020409. Ishido, T., Kiruchi, T., Matsushima, N., Yano, Y., Nakao, S., Sugihara, M., Tosha, T., Takakura, S.,
Ogawa, Y., 1997. Repeated self potential profiling of Izu-Oshima Volcano, Japan. Journal of Geomagnetism and Geoelectricity 49, 1267–1278.
Join, J.-L., Folio, J.-L., Robineau, B., 2005. Aquifers and groundwater within active shield volca-noes. Evolution of conceptual models in the Piton de la Fournaise volcano. Journal of Vol-canology and Geothermal Research 147, 187–201. doi:10.1016/j.jvolgeores.2005.03.013. Lénat, J.-F., 1987. Structure et Dynamique internes d'un volcan basaltique intraplaque océanique: Le Piton de la Fournaise (Ile de la Réunion). PhD thesis, Université Blaise Pascal, Clermont-Ferrand, France.
Lénat, J.-F., 2007. Retrieving self-potential anomalies in a complex volcanic environ-ment: an SP/elevation gradient approach. Near Surface Geophysics 5, 161–170. Lénat, J.-F., Bachèlery, P., 1990. Structure et fonctionnement de la zone centrale du
Piton de la Fournaise. In: Dans, Lénat, J.-F. (Eds.), Le volcanisme de la Réunion– Monographie. Cent. Rech. Volcanol., Clermont-Ferrand, France, pp. 257–296. Lénat, J.F., Fitterman, D., Jackson, D.B., Labazuy, P., 2000. Geoelectrical structure of the
central zone of Piton de la Fournaise volcano (Réunion). Bulletin Volcanologique 62, 75–89.
Letourneur, L., Peltier, A., Staudacher, T., Gudmundsson, A., 2008. The effects of rock heterogeneities on dyke paths and asymmetric ground deformation: The example of Piton de la Fournaise (Réunion Island). Journal of Volcanology and Geothermal Research 173 (3–4), 289–302.
Levieux, G., 2004. Construction d'une carte régionale de polarisation spontanée au Piton de la Fournaise. Université Blaise Pascal, Clermont-Ferrand, France, Analyse des anomalies. Mémoire de Travail d'Étude et de Recherche de Maîtrise Thesis. 64 pp.
Linde, N., Jougnot, D., Revil, A., Matthaï, S.K., Arora, T., Renard, D., Doussan, C., 2007. Streaming current generation in two-phaseflow conditions. Geophysical Research Letters 34 (3), L03306. doi:10.1029/2006GL028878.
Malengreau, B., Lénat, J.-F., Bonneville, A., 1994. Cartographie et surveillance tempor-elle des anomalies de Polarisation Spontanée (PS) sur le Piton de la Fournaise. Bul-letin de la Societe Geologique de France 165, 221–232.
Massenet, F., Pham, V.N., 1985. Experimental and theoretical basis of self-potential phenomena in volcanic areas with reference to results obtained on Mount Etna (Sicily). Earth and Planetary Science Letters 73, 415–429.
Michel, S., Zlotnicki, J., 1998. Self-potential and magnetic surveying of la Fournaise vol-cano (Réunion Island): correlations with faulting,fluid circulation and eruption. Journal of Geophysical Research 103 (NO B8), 17,845–17,857.
Michon, L., Staudacher, Th., Ferrazzini, V., Bachèlery, P., Marti, J., 2007a. April 2007 col-lapse of Piton de la Fournaise: a new example of caldera formation. Geophysical Research Letters 34, L21301. doi:10.1029/2007GL031248.
Michon, L., Saint-Ange, F., Bachèlery, P., Villeneuve, N., Staudacher, Th., 2007b. Role of the structural inheritance of the oceanic lithosphere in the magmato-tectonic evo-lution of Piton de la Fournaise volcano (La Réunion Island). Journal of Geophysics 112, B04205. doi:10.1029/2006JB004598.
Michon, L., Cayol, V., Letourneur, L., Peltier, A., Villeneuve, N., Staudacher, T., 2009a. Ed-ifice growth, deformation and rift zone development in basaltic setting: insights from Piton de la Fournaise shield volcano (Reunion Island). Journal of Volcanology and Geothermal Research 184 (1–2), 14–30. doi:10.1016/j.jvolgeores.2008.11.002. Michon, L., Villeneuve, N., Catry, Th., Merle, O., 2009b. How summit calderas collapse on basaltic volcanoes: new insights from the April 2007 caldera collapse of Piton de la Fournaise volcano. Journal of Volcanology and Geothermal Research 184 (1–2), 138–151. doi:10.1016/j.jvolgeores.2008.11.003.
Nourbehecht, B., 1963. Irreversible thermodynamic effects in inhomogeneous media and their applications in certain geoelectric problems. Ph.D. Thesis, Mass. Inst. Of Technology, Cambridge.
Overbeek, J.T.G., 1952. Electrochemistry of the double layer. In: Kruyt, H.R. (Ed.), Col-loid Science : Irreversible Systems, vol. 1. Elsevier Sci, New York, pp. 115–193. Peltier, A., Bachèlery, P., Staudacher, T., 2009a. Magma transport and storage at Piton de La
Fournaise (La Réunion Island) between 1972 and 2007: a review of geophysical and geochemical data. Journal of Volcanology and Geothermal Research 184 (1–2), 93–108. Peltier, A., Staudacher, T., Bachèlery, P., Cayol, V., 2009b. Formation of the April 2007 caldera collapse at Piton de La Fournaise volcano: insights from GPS data. J. Volca-no. Geotherm. Res. 184 (1–2), 152–163.
Revil, A., 2002. Comment on“Rapid fluid disruption: a source for self-potential anom-alies on volcanoesa” by M. J. S. Johnston, J. D. Byerlee, and D. Lockner. Journal of Geophysical Research 107 (B8). doi:10.1029/2001JB000788.
Revil, A., Cerepi, A., 2004. Streaming potential in two-phaseflow condition. Geophysi-cal Research Letters 31 (11), L11605. doi:10.1029/2004GL020140.
Revil, A., Saracco, G., Labazuy, P., 2003. The volcano-electric effect. Journal of Geophys-ical Research 108, B5. doi:10.1029/2002JB001835.
Revil, A., Johnson, T.C., Finizola, A., 2010. Three-dimensional resistivity tomography of Vulcan's forge, Vulcano Island, southern Italy. Geophysical Research Letters 37, L15308. doi:10.1029/2010gl043983.
Revil, A., Finizola, A., Sortino, F., Ripepe, M., 2004. Geophysical investigations at Stromboli volcano, Italy. Implications for ground waterflow and paroxysmal activity. Geophys-ical Journal International 157, 426–440. doi:10.1111/j.1365-246X.2004.02181.x. Revil, A., Finizola, A., Piscitelli, S., Rizzo, E., Ricci, T., Crespy, A., Angeletti, B., Balasco, M.,
Barde Cabusson, S., Bennati, L., Bolève, A., Byrdina, S., Carzaniga, N., Di Gangi, F., Morin, J., Perrone, A., Rossi, M., Roulleau, E., Suski, B., 2008. Inner structure of La Fossa di Vulcano (Vulcano Island, southern Tyrrhenian Sea, Italy) revealed by high resolution electric resistivity tomography coupled with self-potential, tem-perature, and CO2diffuse degassing measurements. Journal of Geophysical
Re-search 113, B07207. doi:10.1029/2007JB005394.
Revil, A., Finizola, A., Ricci, T., Delcher, E., Peltier, A., Barde-Cabusson, S., Avard, G., Bailly, T., Bennati, L., Byrdina, S., Colonge, J., Di Gangi, F., Douillet, G., Lupi, M., Letort, J., Tsang Hin Sun, E., 2011. Hydrogeology of Stromboli volcano, Aeolian Islands (Italy) from the interpretation of resistivity tomograms, self-potential, soil temperature, and soil CO2concentration measurements. Geophysical Journal
International 186, 1078–1094. doi:10.1111/j.1365-246X.2011.05112.x. Sill, W.R., 1983. Self potential modeling from primaryflows. Geophysics 48, 76–86. Staudacher, T., 2010. Field observations of the 2008 summit eruption at Piton de la
Fournaise (Ile de La Réunion) and implications for the 2007 Dolomieu collapse. Journal of Volcanology and Geothermal Research 191, 60–68.
Urai, M., Geshi, N., Staudacher, T., 2007. Size and volume evaluation of the caldera col-lapse on Piton de la Fournaise volcano during the April 2007 eruption using ASTER stereo imagery. Geophysical Research Letters L22318. doi:10.1029/2007GL031551. Yasukawa, K., Ishido, T., Suzuki, I., 2005. Geothermal reservoir monitoring by continu-ous self-potential measurements, Mori geothermalfield, Japan. Geothermics 34 (5), 551–567. doi:10.1016/j.geothermics.2005.04.005.
Zlotnicki, J., Michel, S., Annen, C., 1994. Anomalies de polarisation spontanée et sys-tèmes convectifs sur le volcan du Piton de la Fournaise (Ile de Réunion, France). Comptes Rendus de l' Academie des Sciences Serie IIa:Sciences de la Terre et des Planets 318, 1325–1331.
Zlotnicki, J., Boudon, G., Viode, J.P., Delarue, J.F., Mille, A., Bruere, F., 1998. Hydrothermal circulation beneath Mount Pelee inferred by self potential surveying. Structural and tectonic implications. Journal of Volcanology and Geothermal Research 84, 73–91.