GC48-1 Building Tomorrow’s Society
Bâtir la Société de Demain
Fredericton, Canada
June 13 – June 16, 2018/ Juin 13 – Juin 16, 2018
RESISTANCE AND FAILURE MODES OF COLD-FORMED LIPPED
ANGLE SUBJECTED TO TENSILE LOAD
Tajeuna, Thérèse
1, 3, Langlois, Sébastien
21, 2 Department of Civil Engineering, Université de Sherbrooke, Qc. Canada 3[email protected]
Abstract: Cold-formed steel angles could be an advantageous alterative to hot rolled steel angle for the
application of light-weight electrical transmission towers. However, standard design equations to evaluate the resistance and failure modes in tension of angles connected with bolts on one leg only were not specifically developed and validated for the application of lipped angles. In particular, the phenomenon of shear lag on this type of angle is difficult to evaluate. In this paper, the behavior of cold-formed steel lipped-angle with typical transmission tower bolted connections is studied. At first, experimental tests on two and three bolts connections are performed. Tensile load is applied on a single angle configuration to investigate the failures mode and capacity of the connected members. Then, three dimension (3D) finite element (EF) models of the bolted members are developed. The accuracy of the FE models is validated by the good agreement with experimental study. Results obtained from these investigations added to other published results are compared to recommended design prediction with the aim to assess their validity and limitation. From this, a new design equation for net-section strength is proposed.
1 INTRODUCTION
In recent years, the use of cold formed steel angle has been widely used in construction industry. They are a promising option for the application of light-weight electrical transmission towers due to their light weight, high strength and stiffness. However, standard design equations to evaluate the resistance and failure modes in tension of angles connected with bolts on one leg only are not specifically developed and validated for the application of lipped angles. Few published articles have addressed this need. However, there is still a gap of knowledge to be filled. In this paper, the behavior of cold-formed steel lipped-angle bolted connections is studied. An investigation of the nominal strength prediction of bolted joints by three design references is presented. The aim is to evaluate their validity and limitation as no specific recommendation is provided for cold-formed lipped angle connected with bolt under tension load. This paper is divided into four parts: In the first part, a literature review of bolted cold-formed lipped angle is presented. Then, the static test of single-lap bolted cold-formed lipped angle bolted to a gusset plate is experimentally studied. Next, calculated joint strengths using equations from three different references, namely CSA S136-16 (CSA-S136 2016), Eurocode 3 Clause 3 (EC3 1998) and ASCE/SEI 10-15 (ASCE10-15 2015) are compared to experimental results performed in this study added to other experimental published results. Finally, finite element analysis validated by experimental results is presented.
1.1 Literature review
Few studies of mechanically fastened cold formed angle have been reported in the literature. Most of these published studies are limited to plain angles or channel [Chi-Ling Pan (2004; 2006), de Paula et al. (2008), Prabha et al. (2011), Justus and Padma Priya (2013), Jaghan and Padma Priya (2015)]. Only limited studies
GC48-2
are found on cold formed lipped angles. The effect of shear lag on cold-formed steel plain and lipped angles was reported by Padma Priya and Kandasamy (2010). From their experimental and numerical analyses, they observed that the presence of lipped increases the load carrying capacity by 22%. Their experimental results reveals that the American (AISI) and British (AS/NZ) design references underestimate the joint capacity. They proposed a net-section efficiency equation which takes into account various geometric parameters. Rokade et al. (2012) studied the behaviour of bracing end connections for cold-formed steel lipped angle and channel sections. They compared their tests results to various International standards which they found to provide a reasonable good approximation. Padma Priya (2015) performed an experimental and numerical analyses to investigate the behaviour of cold-formed steel single and double angles subjected to tension. The tested specimens included plain and lipped angles with equal and unequal legs. She found net-section failure to be the predominant mode. She also observed that the outstanding legs are subjected to local bend due to shear lag effect. In the study reported by Makesh and Arivalagan (2018), the presence of lip on cold formed steel angle was found to increase the load carrying capacity by 21% for single angle and 24% for of double angles. From the above studies, critical evaluation of recommended design equations was presented. However, design equations recommended in the latest edition of in North American Specification for the Design of Cold formed Steel Structural on CSA S136-16 (CSA-S136 2016), in European design reference Eurocode 3 part 1-3 (EC3 2006) and specific recommendations for light-weight electrical transmission towers, (Design of latticed Steel Transmission Structure ASCE/SEI 10-15 (ASCE10-15 2015)) are not addressed. This study is intended to fill this gap.
1.2 Design Equations
In Canada, the current design method recommended for cold formed steel structures is found in North American Specification for the Design of Cold formed Steel Structural on CSA S136-16 (CSA-S136 2016). In Europe, recommendations for cold-formed design are found in Eurocode 3 Part 1-3 Clause 3 (EC3 2006). For the application of electrical transmission towers, the recommended design method is found in Design of latticed Steel Transmission Structure ASCE/SEI 10-15 (ASCE10-15 2015). These manuals provide some basic insights into the design procedure and structural requirements when designing with cold-formed member. For instance, when the components are axially loaded, bearing, net-section and block-shear are the three possible failure modes identified by design reference in which multi-bolt angle can fail. For design prediction, the recommended equations are as follow:
1.2.1 Bearing Failure
Bearing failure is characterised by an excessive elongation of the bolt’s hole. In a single bolt joint, this type of failure is prevented when sufficient end and side distances are adopted. It is the most recommended failure mode as it occurs in a more ductile way. For all three design references, bearing strength (Vbr) is the
product of bearing stress (Fbr) and bolt diameter (d) and thickness of the connected part (t) and number of
bolt (n). However the formulation of bearing stress (Fbr) differs from one design reference to another. As
presented in Equation 1, CSA S136 recommended taking Fbr as the product of a bearing factor C, the
tensile strength of the material (Fu) and a modification factor (mf). These factors are found in section J.3.3.1
of CSA-S136.
[1]
V =C m n d t f
br f uFrom Equation 2, ASCE10-15 recommends that Fbr be taken as 1.5 times the minimum Fu,
[2]
V =1.5f n d t
br uIn EC3, factors related to the end, the side, the gauge and the pitch distances are considered (Equation 3). To prevent bearing failure to develop, EC3 requires that the side distance should not be less than 1.5dh
and the gage distance not less than 3dh. The bearing strength is given by:
d h b 1 u br b br u d M2 h h h 1 1α
e/3d for outside bolts
α k ndtF
[3] V =
where α =min F /F with α =
γ
p/ 3d -1/4 for inside bolts
1
s
g
2.8
-1.7
1.4
-1.7
d
d
k =min
for external bolts k =min
for internal bolts
2.5
2.5
GC48-3
d h b 1 u br b br u d M2 h h h 1 1α
e/3d for outside bolts
α k ndtF
[3] V =
where α =min F /F with α =
γ
p/ 3d -1/4 for inside bolts
1
s
g
2.8
-1.7
1.4
-1.7
d
d
k =min
for external bolts k =min
for internal bolts
2.5
2.5
1.2.2 Block-Shear FailureBlock shear is characterised by the failure of the connected plate around a bolt group. In the CSA-S136 design manual, block shear is defined as the summation of the tensile strength acting on the net tensile area and shear strength acting on the net shear area. For design consideration, CSA-S136 recommends to take the nominal block shear strength as the least value of Equations 4.
[4] bs u nv bs u nt bs y gv bs u nt
V =0.6f A +U f A
min
V =0.6f A +U f A
Both EC3 and ASCE10-15 design references, define block shear strength as the summation of the ultimate strength acting on the tensile failure line and shear yielding on the shear area. When the bolts are eccentrically loaded, the recommended nominal design strength against block shear fracture is given by Equations 5 and 6 for EC3 and ASCE10-15 respectively.
[5]
V =0.5f A /γ
bs u nt M2+ 1/ 3 f A /γ
y nv M0[6]
V =f A +0.6f A
bs u nt y nv withA =t e +(n-1)p
nv
nt net
andA =t.s
nt netAnt minimum net area in tension from the hole to the toe of the perpendicular to the line of force, Anv is the
minimum net area in shear along a line of transmitted force, Pnet: is the clear distance between the edge of
two bolt holes, snet is clear distance between side of the material and the edge of the bolt hole, Fy is minimum
yield strength of the member, Ubs is non uniform block shear factor=1 for angle.
1.2.3 Net-Section Failure
Net-section failure occurs by a fracture of the plate across the bolt hole in the direction perpendicular to the applied load (net-section). When failure is predicted to occur in the net-section, CSA S136 design references recommend to reduce the net-section strength by the shear lag factor Usl as presented in
Equation 7. [7]
V =f A U
nt u nt sl with sl u c u1
U =
0.5w
X
1.1+
+2
w +w
L
X̅: Distance from the shear plane to centroid of cross section, L: Length of the connection, wu: out-to-out
width of angle leg not connected, wc out-to-out width of angle leg connected. Ant is the net-area of the angle.
EC3 recommends that when the angle is attached to one leg by one column of bolts, the connection can be treated as concentrically loaded and the net-section resistance can be taken as presented in Equations 8, and 9.
[8] nt 2 nt u
M2
β A f
V =
γ
for two bolts in a column [9] nt 3 nt uM2
β A f
V =
γ
for three bolts or more in a columnβ 2 and β3 are reduction factors dependent on the pitch distance. They can be found in Table 3.8 of EC3
GC48-4
As for, ASCE 10-15 recommend the net-section strength is defined as the product of the yield strength and the net area of the angle for both plain and lipped angle. The shear lag effect due to joint eccentricity Usl is
taken equal to 0.9. Therefore the net-section strength is expressed as presented in Equation 10.
[10]
V =0.9f A
nt y nt2 EXPERIMENTAL PROGRAM
The static test of two experimental configurations was performed in order to understand the behavior of cold formed lipped angle subjected to tensile load and to obtain sufficient data to validate the FE model. For this investigation a total of four specimens of two-bolt and three-bolt connections with two specimens per configuration were tested. The cold-formed lipped angle 64X64X30X3 was connected to a 203X254X7.94 gusset plate with ASTM A325 bolts of 15.875 mm diameter loaded in single-lap configuration. Bolts were arranged in a column centered on the connected leg. A pitch distance of 70 mm and end distance of 32 mm were considered. Specimens were named according to the number of bolts and specimen number. For example, two bolts joint specimen number 1 is named 2B01.
2.1 Tensile tests of the materials
The cold-formed lipped angles used in this study were fabricated by a commercial manufactery with cold rolled steel sheet A1008 of 3.05 mm thickness. To investigate the material properties, two or four coupons were taken directly from the two legs of each tested lipped angles. The coupons were prepared and tested in tension according to the American Standard Test Method A370-12 (ASTM A370-12). All tested coupons had a reduced section. Strain was measured by an axial extensometer with a gage length of 25 mm located at the middle of the reduced section. The average mechanical properties of each lipped angle tested are summarized in Table 1. Stresses and elastic modulus were computed according to CSA-S136 recommendations. ASTM A325 bolts and the gusset plate were not tested because the strength of the whole connection was not affected by the capacity of these members.
2.2 Experimental setup and measurements
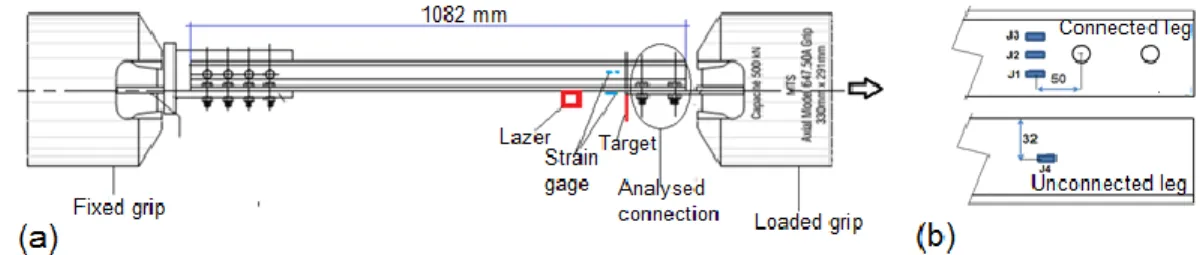
The tests were conducted up to failure of the joint in shear using a 500 kN hydraulic testing machine. Figure 1a presents the test set-up of the connection. All tested specimens had a length of 1082 mm.
At one end, lipped angle was connected with two or three bolts on one leg. At the other end, both legs were connected to apply a uniform loading on the specimen. ASTM A325 bolts with 15.875 mm diameter and nominal washer on both sides were used. The length of the bolt was selected to exclude threads from the shear interface. The bolt was tightened to a snug-tight condition, which referred to the full effort of a technician using an ordinary wrench. Therefore, the specimen was considered to be bearing type connection. Strain gages were bonded on the lipped angle as presented in Figure 1b to measure the axial deformation on each specimen. These measurements were necessary to validate the finite element model. The load was applied at the rate of 0.5 mm/min and the load and displacement were recorded by the control system of the universal testing machine.
GC48-5
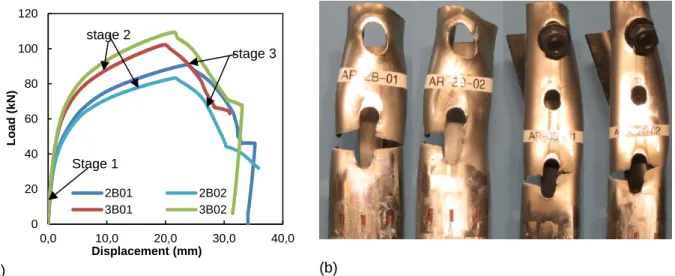
2.3 Experimental results
The experimental failure loads and failure modes for each tested specimen is presented in Table 1. These load values correspond to 53% and 58% of the nominal capacity of the 15.875 mm A325 bolts in shear which is 78.4 kN per bolt. For the three bolts joints, these load values correspond to 43% and 46% of bolts nominal capacity. Figure 2a and 2b shows the load-displacement history and failure mode of the four tested specimens. The load-displacement curve can be described in three stages. In stage 1, the joint behaves linearly up to approximately 40 kN and 60kN for two-bolt and three-bolt joints respectively. In the second stage, the load continues to increase but with a reduced stiffness up to the peak load. This stage is characterised by an excessive elongation of the bolt-holes, sign of bearing failure. Out of plane deformation due to joint eccentricity starts to develop in this stage and continues in the 3rd stage. This last stage is
characterised by the decrease of joint capacity. At some point during this stage, crack on the net-section of the most inner bolt was observed. Despite this second failure, bearing failure was assumed to be the predominant mode as it occurred at the beginning of stage 2. Table 1 also contains predictions as per different design references and finite element analysis. Comment on these results is presented in the next sections.
Table 1 Experimental and numerical results of tested specimens
Speci- men
Properties of
lipped angle Exp.
results (kN)
Fexp/FM
CSA S136-16 ASCE 10-15 Eurocode 3
FFE/ FM Fy (MPa) Fu (MPa) εf (%) Fpr (kN) FM Fex/Fpr Fpr (kN) FM Fexp/Fpr Fpr (kN) FM Fex/Fpr 2B01 280 302 23 83.3/Br 72.87 NS 1.14 43.86 Br 1.90 38.31 Br 2.18 82/Br 2B02 290 341 30 91.0/Br 82.27 NS 1.11 49.53 Br 1.83 43.26 Br 2.10 91/Br 3B01 295 329 19 102.4/Br 95.32 NS 1.07 71.68 Br 1.42 62.60 Br 1.64 105/Br 3B02 215 327 21 109.4/Br 94.74 NS 1.15 71.25 Br 1.53 62.22 Br 1.76 113/Br
FM: Failure mode, Fexp: experimental failure load, Fpr: Predicted load, Br: bearing failure, NS: Net-section
failure
(a) (b)
Figure 2 (a) Force displacement curves of tested specimens (b) failure modes of tested specimens 0 20 40 60 80 100 120 0,0 10,0 20,0 30,0 40,0 Lo ad (kN) Displacement (mm) 2B01 2B02 3B01 3B02 Stage 1 stage 2 stage 3
GC48-6
3 PREDICTION WITH DESIGN CODE EQUATIONS
Results obtained from experimental analysis and those reported from published experimental studies reported by Padma Priya (1995) and Makesh and Arivalagan (2018) are compared to nominal strength predicted by the three design references presented above. For these comparisons, neither partial safety factor (EC3) nor resistance factor (CSA-S136, ASCE 10-15) is used to evaluate the predicted nominal strength.
3.1 Design Approaches Verification
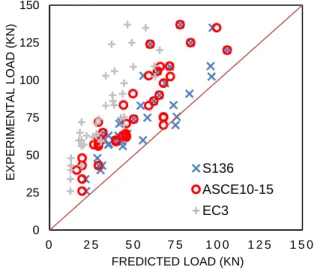
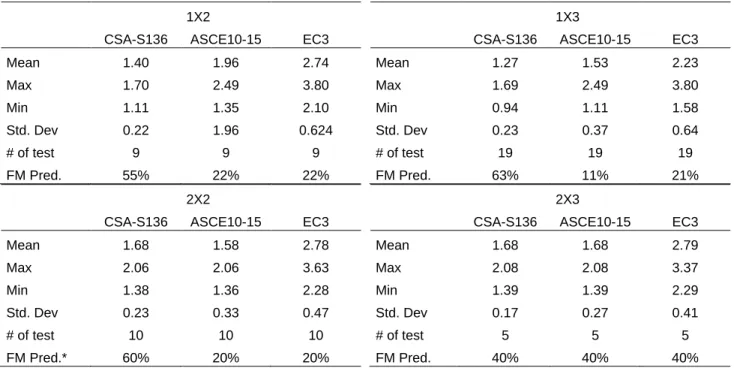
Experimental to predicted loads using Equations 1 to 10 are shown in Figure 3. It can be observed that the predicted results are always conservative. However, the degree of safety can be too excessive for some design references. An extensive analysis of these results is presented in Table 2. Results are presented per joint configurations which include: two-bolts aligned in a single column (1X2), three-bolt in a single column (1X3), four-bolt in two columns (2X2) and six-bolt in two columns (2X3). With EC3, the average ratio is within 2.23 to 2.79 for all analysed configurations. Witch suggests that the predicted results are more than 2 times lower than experimental results. Such prediction can lead to an overestimation of the size of the design member, resulting to a noneconomic design. With ASCE 10-15, a better prediction than EC3 is obtained. However, the ratio of predicted to experimental is still too conservative. The mean ratio presented in Table 2 is within 1.53 to 1.96. A most realistic estimation is obtained with CSA-S136. The mean ratios are within 1.27 to 1.68.
For the predicted failure modes, out of the 50 experimental results, more than 50% were governed by net-section failure while the rest were bearing, block shear or tearing failures. Failures by bearing or block shear were the only predicted mode with ASCE 10-15. EC3 includes only few results in net-section failure while bearing or block shear failures are the predominant predictions. With CSA-S136, net section failure was the predominant prediction and few results were predicted to fail in block shear. Compare to predicted results, the percentage of right prediction for each configuration (FM pred.) is also reported in Table 2. This ratio is obtained by taking the number of results that were correctly predicted divided by the number of test per configuration. It is shown in Table 2 that 40% to 63% of the predicted failure modes by CSA-S136 corroborate with experimental results. This ratio is only within 21% to 40% with EC3 and 11% to 40% with ASCE 10-15.
In summary bearing and block shear equations recommended by EC3 and ASCE 10-15 need to be improve as they underestimate by almost 2 times the design prediction. More data are required to address this need. CSA-S136 appears to provide the most realistic design prediction. However, there is room for an improvement of the recommended net-section equation. The next subsection will address this point.
Figure 3 Experimental to predicted failure loads 0 25 50 75 100 125 150 0 2 5 5 0 7 5 1 0 0 1 2 5 1 5 0 EX PE RIME NTAL LO AD (KN) FREDICTED LOAD (KN) S136 ASCE10-15 EC3
GC48-7
Table 2 Design approaches verifications
1X2
CSA-S136 ASCE10-15 EC3
Mean 1.40 1.96 2.74 Max 1.70 2.49 3.80 Min 1.11 1.35 2.10 Std. Dev 0.22 1.96 0.624 # of test 9 9 9 FM Pred. 55% 22% 22% 1X3
CSA-S136 ASCE10-15 EC3
Mean 1.27 1.53 2.23 Max 1.69 2.49 3.80 Min 0.94 1.11 1.58 Std. Dev 0.23 0.37 0.64 # of test 19 19 19 FM Pred. 63% 11% 21% 2X2
CSA-S136 ASCE10-15 EC3
Mean 1.68 1.58 2.78 Max 2.06 2.06 3.63 Min 1.38 1.36 2.28 Std. Dev 0.23 0.33 0.47 # of test 10 10 10 FM Pred.* 60% 20% 20% 2X3
CSA-S136 ASCE10-15 EC3
Mean 1.68 1.68 2.79 Max 2.08 2.08 3.37 Min 1.39 1.39 2.29 Std. Dev 0.17 0.27 0.41 # of test 5 5 5 FM Pred. 40% 40% 40%
()* Is the percentage of right failure modes prediction
3.2 Proposition of New Design Equation for Net-Section Strength
Experimental results reported in literature cited above which experienced net-section failure were used to improve the net-section equation (Equation 7) of CSA S136 for cold-formed lipped angle. As the predicted failure load resulted in conservative values, the improvement was made by considering the difference of experimental to predicted shear lag versus the ratio of connection eccentricity to connection length(X̅/L). From the resulting equation, dimensions of lips (c) were included on the shear lag equation as they were found to improve the joint strength (Padma Priya and Kandasamy 2010, Makesh and Arivalagan 2018). After few adjustments of some coefficients, Equation 11 was defined. Results obtained with Equation 11 are compared to predicted results by the three design references in Figure 4. As it can be observed, a better approximation than design references is obtained. More than 90% of the predicted results are within 20% difference of experimental results. For simplification purposes, taking the value of Upro=0.65 will also
give conservative load predictions (Equation 12).
[11]
V =f A U
nt u nt pro With prou c u
1
U
=min 0.7,
w +c
X
X
1+
+2
1-w +1-w +2c
L
L
[12]V =0.65f A
nt u ntEquations 11 and 12 are a first attempt for an improvement of net-section strength. More data are required to validate and/or refine these equations. Finite Element analysis, if properly validated, can be a reliable tool to increase such data.
GC48-8
Figure 4 Experimental to Predicted net-section strength
4 FINITE ELEMENT (FE) ANALYSIS OF BOLTED COLD-FORMED LIPPED ANGLE
In this section, FE analysis of cold formed lipped angle is presented. The aims was to develop a model that could be compared to experimental tested specimens in order to provide a better understanding on the behavior of this type of bolted joint. The study was performed with the commercial software ADINA 8.7.3. For this study, the two configurations tested in the experimental program were analysed. The bolted joint which includes the cold-formed steel lipped angle, the gusset plate and the bolts were modelled with three dimensional elements, 8 nodes per elements and 3 degrees of freedom per node. Cold-formed lipped angle were modelled as material with multilinear elastoplastic behavior. The stress-strain relationship obtained from coupons tensile tests were directly used to characterise the lipped angle behavior. Bilinear relationship was considered for gusset plate with the properties taken as: (Fu=400 MPa, ᶓu=0.5 mm/mm) and (Fy=350
MPa, ᶓy=0.002 mm/mm). Linear elastic behavior was considered for the bolt. Therefore, the analysis
assumptions were large displacement and strain for the lipped angle and the gusset; small displacement and strain for the bolt. The contact interfaces between angle-gusset, bolt-gusset and bolt-angle were generated as a pair of surface element contacts available in the software. For these different contact interfaces, the stronger material was defined as the target and the weaker as a contactor. A uniform pressure of 500 MPa was applied in the longitudinal z axis of the far end plate edge of the angle. At the other end, fixed boundary condition was applied on the gusset. External load was incrementally applied on the structure at the rate of 1MPa per step. Full newton method was used for the iteration. Once the deformation of the material at Fu was reached, the structure diverged. The load to which the structure
diverged was taken as the maximum capacity that the joint can support. The FE model is shown in Figure 5.
Figure 5 Typical 3D finite element model
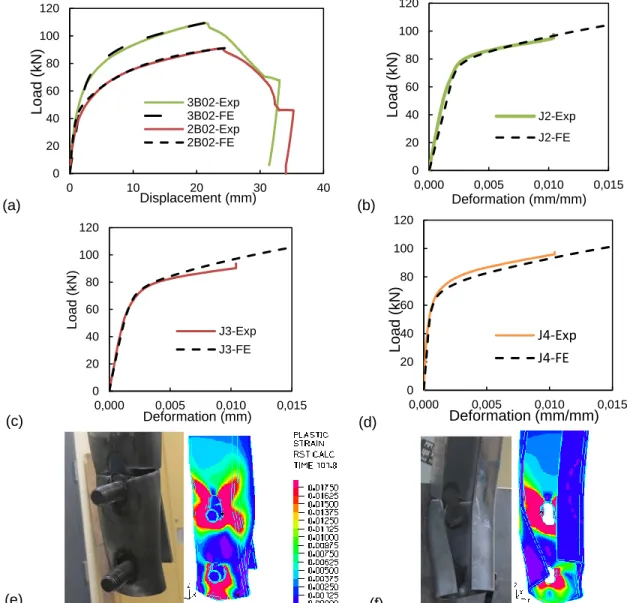
In Figure 6(a) the typical force-displacement curves of 2B02 and 3B02 are compared to experimental results. In Figures 6(b) to 6(d) show the typical force-deformation curves for strain gages J2 to J4
0 25 50 75 100 125 150 0 25 50 75 100 125 150 Ex pe rime nta l Lo ad (kN) Predicted Load (kN) S136 ASCE10-15 EC3 Proposed
GC48-9
respectively for 3B02. In general, the FE models are in good agreement with experimental results despite some minor difference observed on the plastic portion of strain gage J3 (Figure 6c). The data acquisition system was configured up to 0.01mm/mm. Therefore, no experimental data was recorded above this point. The advantage of the FE model is that deformation at any location can be recorded up to maximum deformation. Table 1 also shows the maximum load of each specimen obtained from FE analysis. The ratios of experimental to predicted results are within 5% difference.
Figures 6(e) and 6(f) present the post-processing deformed shape of two-bolt configuration. An excessive elongation of the two bolt-holes is observed (sign of bearing failure). In the second inner hole, plastic strains are spread over the net-section path. This observation is consistent with the experimental observation from which crack in net section path is shown. Plastic strains are also observed on the end-distance. However this plastic deformation is not uniform throughout the thickness. The amplitude of deformation is higher on the lower fiber (Figure 6e) than the upper fiber (Figure 6f) suggesting an out-of-plane deformation. Out-of-plane deformation of the lipped leg towards the inside of the angle observed experimentally is also well defined in the FE model. Since this model is consistent with experimental result, it will be used in future work for a parametric simulation.
(a) (b)
(c) (d)
(e)
(f)
Figure 6: FE results compared to Experimental results :(a) displacement curves (b) Force-deformation J2 of 3B02, (c) Force-Force-deformation J3 of 3B02, Force-Force-deformation J4 of 3B02, (e) Failure
mode Back view of 2B02, (f) Failure mode front view of 2B02 0 20 40 60 80 100 120 0 10 20 30 40 Load (k N) Displacement (mm) 3B02-Exp 3B02-FE 2B02-Exp 2B02-FE 0 20 40 60 80 100 120 0,000 0,005 0,010 0,015 Load (k N) Deformation (mm/mm) J2-Exp J2-FE 0 20 40 60 80 100 120 0,000 0,005 0,010 0,015 Lo ad (kN) Deformation (mm) J3-Exp J3-FE 0 20 40 60 80 100 120 0,000 0,005 0,010 0,015 Load (k N) Deformation (mm/mm) J4-Exp J4-FE
GC48-10
5 CONCLUSION
The aims of this study were to analyse the behavior of cold formed lipped angle, to critically evaluate the recommended design equations and to define a Finite Element model that could provide a reliable design prediction. In the experimental analysis, bearing failure was defined to be the predominant mode. Although net-section failure appears later; it was not the observed mode at maximum value. From the critical analysis of design references, CSA-S136 was found to provide the most realistic prediction both for failure load and failure mode. However, there is room for improvement for the equation for net-section failure. The shear lag equation recommended by CSA-S136 was readjusted to include the dimension of the lip. Results obtained from this new equation are able to provide a reasonable approximation of the new net-section strength. More than 90% of the predicted results were within 20% difference from the experimental results. Finite element analysis was found to be a great tool to extend such data. The FE model developed was able to give a good approximation of failure load and failure mode of joints tested in this project. The next step will consist in a parametric simulation by FE analysis and refinement of design equations.
Acknowledgement
The authors gratefully acknowledge the National Science and Engineering Research Council of Canada (NSERC), funding program InnovÉÉ, FRQNT (through strategic group CEISCE), RTE and Hydro-Québec, for their financial support.
References
ASCE 10-15 (2015). ASCE/SEI 10-15 Design of Latticed Steel Transmission Structures. American Society of Civil Engineers, Reston, Virginia, USA.
Chi - Ling pan, (2004), Prediction of the Strength of Bolted Cold-Formed Channel Sections in Tension. Thin walled structures, 42: 1177-1198.
Chi-Ling Pan, (2006). Shear Lag Effect on Bolted L-Shaped Cold-Formed Steel Tension Members. Eighteenth International Specialty Conference on Cold-Formed Steel Structures, Orlando, Florida, U.S.A, 1: 679-694.
CSA-S136 (2016) S136-16 North American specification for the design of cold-formed steel structural members. CSA group, Toronto, Ontario, Canada.
de Paula VF, Bezerra LM, Matias WT (2008). Efficiency reduction due to Shear Lag on Bolted Cold-Formed Steel Angles. Journal of Constructional Steel Research. 64:571-83.
EC3 (2006). EN 1993-1-3: Eurocode 3Design of steel structures - Part 1-3: General rules-Supplementary rules for cold-formed members and sheeting. European Committee for standardization, Brussels,
Belgium.
Jaghan S and Padma Priya R, (2015), Behavior of Bolted Cold Formed Steel Channel Tension Members. Asian Journal of Civil Engineering (BHRC), 17 (1): 137-146.
Justus, Abida; Padma Priya (2013), Behaviour of Bolted Cold-Formed Steel Angle Tension Members. R. i-Manager's Journal on Structural Engineering; Nagercoil Vol. 2 (2): 17-25.
Makesh P. and Arivalagan S. (2018). Experimental and Analytical Study on Behaviour of Cold-Formed Steel using Angle Section under Tension Members. International journal of engineering technologies and management research, 5(1), 20-28. Doi: 10.5281/zenodo.1157620.
Padma Priya and Kandasamy (2010). Study on the Behavior of Cold-formed Steel Angle Tension Members. International Specialty Conference on Cold-Formed Steel Structures. http://scholarsmine.mst.edu/isccss/20iccfss/20iccfss-session11/10
Padma Priya (2015). Experimental Study on Behaviour of Bolted Cold-Formed Steel Angles under Tension. Asian Journal of Civil Engineering. 16: 967-975.
Prabha P., Arul Jayachanran S., Saravanan M., Marimuthu V. (2011). Prediction of the Tensile Capacity of Cold-Formed Angles Experiencing Shear Lag. Thin Walled Structures, 49:1348-58.
Rokade, R., Prasad Rao N., Balagopal R., and Mohan S.J. (2012). Studies on Bracing Member End Connections for Formed Steel Sections, Twenty-First International Specialty Conference on Cold-Formed Steel Structures. St. Louis, Missouri, USA.