Acceptance tests of the INTEGRAL Optical Monitoring Camera subsystems
12
0
0
Texte intégral
(2) Aperture size : Field of View (FOV) : Pixel size : Spectral range : Sensitivity :. 50 mm diameter 5 x 5 arcdeg square 13 x 13 µm_ 17.6 x 17.6 arcsec_ V-band centred at 550 nm 19.7 visual magnitude. The main optical requirements of the instrument are listed in table 1. The FOV is defined by the payload pointing mode. It is a compromise between the source confusion and the FOV of other instruments on the payload, particularly the X monitoring instruments. The V-band selection is achieved with a specific filter included in the optical system. The very high sensitivity will be reached with adequate diaphragms and dedicated baffles.. Table 1: OMC specifications.. 2. DEVELOPMENT PHILOSOPHY 2.1. CSL sub-systems CSL is responsible for the design, fabrication and sub-system level verification of three elements: the main baffle, the optical system and the cover system that are described in §§3, 4 and 5 respectively. CSL elements are then integrated into the Camera Unit under INTA responsibility. Other main sub-systems are the focal plane assembly, the radiators, the thermal and electrical elements (MLI, harnesses…). 2.2. Model philosophy The qualification and acceptance campaign of the OMC is based on four models: the Structural and Thermal Model (STM), the Engineering Model (EM), the Qualification Model (QM) and the Flight Model (FM). The qualification is performed on the STM, EM and QM. Nevertheless, the QM will be used as Flight Spare Model (SFM), so it is required that no qualification levels are applied on the QM sub-elements. For the OMC sub-elements, CSL has to deliver to INTA STM’s of the baffle, the cover and the optical systems, a Development Model (DM) of the cover system fully operational, that will be integrated on the STM spacecraft for tests, an EM of the cover system, QM’s of the baffle, the cover and the optical systems and finally FM’s of all of them. Before the acceptance campaign on QM sub-elements described in this paper, qualification tests were already performed on the STM (vibration of the optical system) and on the DM (thermal vacuum, vibration and functional tests of the cover system). Table 2 describes the tests performed at sub-system level at CSL.. Optical system Cover system Main Baffle. STM Vib (Q). DM Vib (Q) Vib, TV, Lifetime (Q). Funct: functional test TV: thermal vacuum test Vib: Vibration test. EM. QM/SFM Funct, Vib, TV (A) Funct, Vib, TV (A). FM Funct, Vib, TV (A) Funct, Vib, TV (A) Straylight. Q: qualification level A: acceptance level. Table 2: Qualification and acceptance summary.. 3. OPTICAL SYSTEM DESCRIPTION 3.1. Requirements The optical design is driven by two main parameters: high optical performances and specific environmental conditions. These parameters are summarised in table 3. The optical performances must be met within the operational conditions range while the non-operational environment defines the extreme conditions that shall be withstood without damage. The nominal operational temperature and the very wide temperature ranges result from the thermal design of the instrument. Moreover, the thermal requirements at the interfaces dictate the lens barrel material: titanium alloy. Encircled energy: Modulation Transfer Function (MTF): Backfocus: Transmission (@550 nm):. > 70% in a pixel (13x13 µm_) > 70% at Nyquist Frequency (38.5 c/mm) ≈ 50 mm > 70% at the beginning of life > 60% at the end of life.
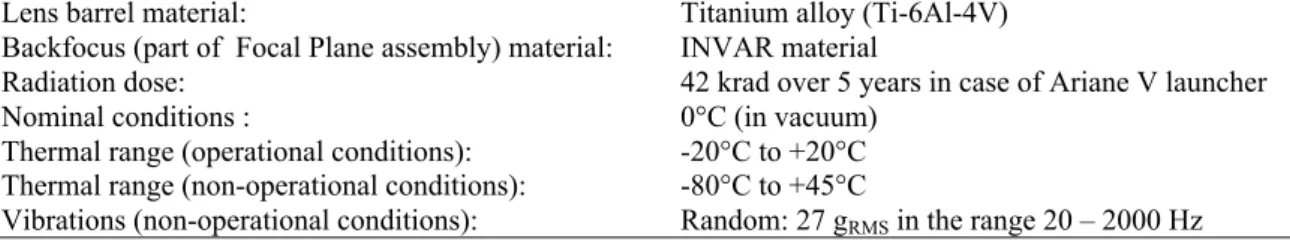
(3) Lens barrel material: Backfocus (part of Focal Plane assembly) material: Radiation dose: Nominal conditions : Thermal range (operational conditions): Thermal range (non-operational conditions): Vibrations (non-operational conditions):. Titanium alloy (Ti-6Al-4V) INVAR material 42 krad over 5 years in case of Ariane V launcher 0°C (in vacuum) -20°C to +20°C -80°C to +45°C Random: 27 gRMS in the range 20 – 2000 Hz. Table 3: Optical requirements and environmental conditions. 3.2.. Optical and mechanical description. Optical design was described in a previous paper [1 ]. It consists of six radiation-hard lenses (F/3) housed in a titanium barrel (figure 2). The filter assembly holds two colored filters (Schott BG39 and GG495) defining the useful spectral range. An additional BK7G18 glass plate protects the filters from radiation. The filters and the protective plates are maintained with a retainer and an O-ring. The titanium material is treated with black chromium.. Baffle Interface Filter Assembly Aperture Stop. Focal Plane Assembly Interface. 187 mm. Figure 2: Cut-view of the optical system.. 4. MAIN BAFFLE DESCRIPTION 4.1. Requirements The main baffle was designed to achieve the high rejection factor required for observation of stars up to visual magnitude of 19.7. The design is described in [2] where its straylight properties were investigated. The main baffle consists of a cylinder and a cone, both made of aluminium and with a mean thickness of 2 mm. On these tubes are added interfaces for the optical system, for the cover system, for the alignment cube, for the mounting legs, for the lifting tool, for the MLI grounding and for the electrical connectors. Inside this tube, 4 square aperture vanes are inserted for straylight purpose . A venting hole is also included in the design to allow depressurization without parasitic light. The entire baffle is black anodised to improve the rejection efficiency. 4.2. Manufacturing and testing The main baffle mechanical design was placed under INTA's responsibility because it is the main structural piece of the OMC instrument, which holds all other sub-systems. Baffling vanes and venting device were defined by CSL. It is planned to perform a straylight rejection test in order to correlate the straylight analysis reported in reference [_]. Because of schedule constraint, this test is delayed until availability of the FM unit..
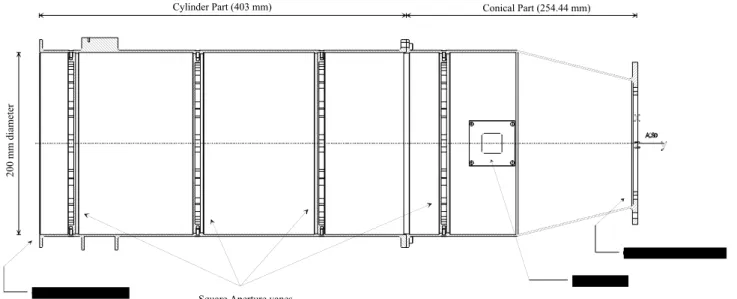
(4) Conical Part (254.44 mm). 200 mm diameter. Cylinder Part (403 mm). Optical System Interface Venting Hole Cover System Interface. Square Aperture vanes. Figure 3: Cut view of the OMC main baffle.. 5. COVER SYSTEM DESCRIPTION 5.1. Requirements The goal of the cover system is to prevent particles from entering the main baffle. It must be kept closed during integration and launch and opened only once in orbit. The cover system also includes a forebaffle that protects the cover mechanism and the aperture of the main baffle from direct sunlight. The position of the sun with respect to the instrument is defined in the specifications (minimum 50 arcdeg from the optical axis). 5.2. Description The cover mechanism and the forebaffle are mounted Clamping mechanism on an interface plate that is also the interface with the main baffle and the first vane of the baffling system. Forebaffle The forebaffle consists in 3 aluminum walls, (1 mm thick), stiffened with U-section aluminum beams. The mechanism is based on a paraffin actuator provided by Starsys Research Corporation. An internal mechanism maintains a T-shaped bar. This T-bar is mounted on a locking arm that maintains a cover lid on Microswitch 2 the aperture in the interface plate. The lid is springmounted to the arm to provide for intimate contact Hinge with the interface plate. with springs Two torsion springs, mounted around a stainless steel shaft, provide the opening torque. Once the T-bar is released by the paraffin actuator, the springs open the door and maintain it opened. A starlock washer is used Cover Lid as a redundancy to maintain the door in open position. Interface plate Locking arm A starlock washer is a washer that can slide in one Microswitch 1 Paraffin actuator Tee-Bar direction on a rod but not in the other. It is mounted on the locking arm and will be slipped on a clamping rod Figure 4: Cover system description. at the end of the opening. Two microswitches are included in the design to verify the status of the door. One is located near the paraffin actuator (#1) to check the closed position, the other one (#2) is located near the hinge to check the open position. The connection of the paraffin actuator and the microswitches to the OMC electronic unit is performed through a 9 socket sub-D connector located under the interface plate..
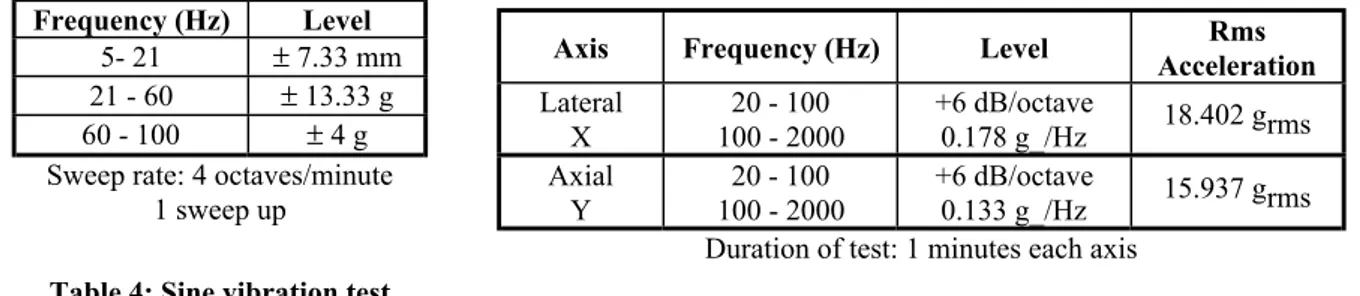
(5) 6. OPTICAL SYSTEM TESTS 6.1. Optical System Test Plan The goal of the tests on the optical system is to measure the optical performances and verify the degradation due to the high environmental constrains. The test plan was articulated on three main tests: optical tests to verify the optical performances of the optics (i.e. MTF 1 and WFE 1 in Figure 5), vibration tests and thermal vacuum test to verify the optical system behavior to respectively vibration conditions and thermal conditions. This verification plan is sketched in figure 5. Between each environmental test, the optical system is checked to identify possible damage or misalignments. This check consists in visual inspections, WaveFront Error (WFE) measurements, Modulation Transfer Function (MTF) measurements and Point Spread Function (PSF) measurements. Due to planning constraints, the PSF measurement was performed only after the vibration test and the thermal vacuum test and the MTF measurement only before and after the vibration test. A second vibration test was performed after that the optical check following the first vibration test showed a degradation of the optical performances (see § 0).. MTF 1. WFE 1. Vibration 1. WFE 2. MTF 2. Vibration 2. WFE 3. PSF 1. Thermal vacuum. PSF 2. WFE 4. Figure 5: Acceptance test plan for the optical system (dashed lines represents optical check).. 6.2. Vibration tests description The goal of the vibration test is to verify that the optical performances will not degrade after exposure to launch loads. The levels applied are the acceptance levels defined in tables 4 and 5 along 2 axes (axial and lateral).. Frequency (Hz) Level 5- 21 ± 7.33 mm 21 - 60 ± 13.33 g 60 - 100 ±4g Sweep rate: 4 octaves/minute 1 sweep up Table 4: Sine vibration test levels.. Axis Lateral X Axial Y. Frequency (Hz). Level. Rms Acceleration. 20 - 100 +6 dB/octave 18.402 grms 100 - 2000 0.178 g_/Hz 20 - 100 +6 dB/octave 15.937 grms 100 - 2000 0.133 g_/Hz Duration of test: 1 minutes each axis Table 5: Random vibration test levels..
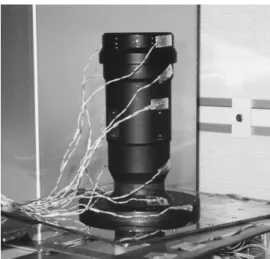
(6) 6.3. Vibration tests results From a mechanical point of view, the first vibration test was successful, no visible damage was observed. The eigenfrequencies were close to the ones observed on the STM (620 Hz lateral and 2200 Hz in axial direction), the difference being explained by the slight difference in mass between the two models. Nevertheless optical verifications showed a degradation both in WFE and MTF (see optical tests). The origin of the problem was investigated. A MTF deterioration due to lenses movement is not possible since the maximum displacement allowable modify too slightly the degradation. A second vibration test was performed to verify that this modification is stable and could be caused by stress release. The result is that the WFE still changed but this time, the quality was improved. Analysis and optical tests on dummy models lead us to incriminate the stresses caused by the retaining rings. When tightening the rings, the lenses are deformed, this is visible on the WFE. During vibration, micro displacement causes stresses modification and thus optical performances modifications. It was decided that the optical system is accepted in this configuration since the optical performances remain within specifications and also because the alternative designs investigated imply too large modifications and important costs/risks at this stage of the development. 6.4. Thermal vacuum test description The goal of the thermal vacuum test is to verify that the optical system will survive thermal cycling. The optical system was mounted on a regulated conductive interface and mounted in the FOCAL 1.5 vacuum chamber at CSL. Radiative thermal panels were surrounding the specimen. All panels were regulated in serial with one nitrogen gas line. One constraint for this test was that the gradient between the first and last lenses must be lower than 10 degrees. Four cycles were performed. The first one begins with high non-operational temperature (+50°C), after a twohours stabilization the temperature was decreased to high operational temperature (+25°C). The system was then exposed to low non-operational temperature (-45°C) during 2 hours and to low operational temperature (-25°C). After 2 hours stabilization, the optical system goes through the 3 following cycles between high and low operational temperatures.. Figure 6: optical system instrumented with thermocouples.. 6.5. Thermal vacuum test results Due to the maximum allowable gradient (10°C) the gradient between the conductive panel and the 5 radiative panels had to be as small as possible. As all thermal panels were regulated with only one nitrogen gas line extremely low rates for the temperature slopes were necessary (0.015°/sec) at the expense of the test duration. All thermal cycles were performed nominally (see figure 7). The maximum gradient observed was about 8°C. The cleanliness requirements were also fulfilled. Figure 7: Thermal cycle results..
(7) 6.6. Optical tests description The optical tests are based on three measurements: a WFE measurement, MTF measurements and PSF measurements. All tests are performed at 20°C assuming no major modification at the nominal temperature (0°C). The WFE measurement consists in an on-axis wavefront error measurement at 633 nm of the optical system in a vertical position to limit gravity effects. The WFE measurement is used as a check for possible misalignment during the environmental tests. The MTF measurement is performed on an ODETTA optical test bench in Delft Sensor Systems facility (Oudenaarde, Belgium). The PSF measurement consists of acquiring on a CCD camera the PSF of the optical system illuminated by a three meter focal length Newtonian collimator. To compute the encircled energy on the PSF, it is magnified by a x40 microscope objective. A rotation stage allows modifying the field of view on the optical system and three axis translation stages, below the microscope objective assembly, allow focussing this one. Figures 8 and 9 describes the set-up. The optical test bench is located on an optical table protected from straylight by black curtains. A laminar flow, besides the optical system, allows keeping the required cleanliness. NRC optical table Xenon source Source power supply. Z Y. OMC optical system. 3 m focal length collimator. Support assembly. Figure 8: PSF measurement set-up (not scale).. Support assembly Optical System QM CCD camera tube. microscope objective. X. Y. X-axis (M-MVN80) Y-axis (M-URM5.16) Z-axis (M-URM5.16). URM-80 rotation stage NRC optical table. Figure 9: Detailed set-up of the support assembly (not scale)..
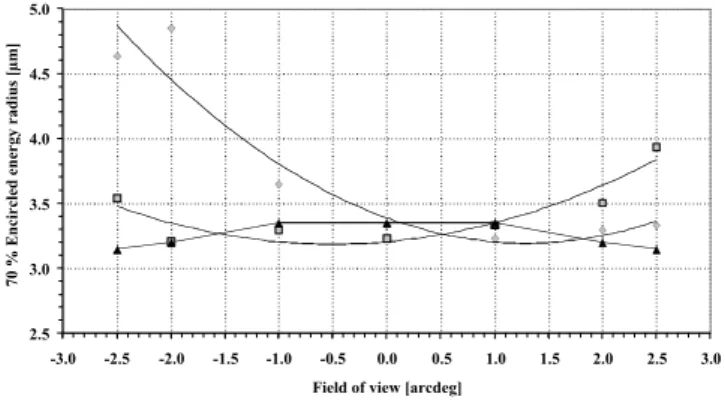
(8) 6.7. Optical tests results The optical performances were measured during the MTF test (i.e. MTF 1). Table 8 summarizes the MTF results. The optical checks are summarizes in the tables 6 and 7. As mentioned in § 6.3, a variation of the WFE and the MTF was noticed after the vibration test 1, due to lenses deformations under stress. The requirements (i.e. MTF > 70 % at 38.5 c/mm) are always fulfilled and a lens mounting modification is not needed. The PSF measurement results are summarized in figure 10. Small variations were noticed before and after the thermal vacuum test but main of these comes from degradation induced by the microscope objective lens. These degradations vary with the considered field of view since the F/3 light beam coming from the optical system focal plane defines a sub-aperture smaller than the microscope objective aperture. When the microscope objective axis is aligned with the optical system, the sub-aperture is located in the paraxial area of the microscope objective and the degradation is minimized. Otherwise, for another field of view, the microscope objective adds its own aberrations to the PSF. Therefore only the minimum values have to be considered. These minimum values are better than theoretical values and are not modified by the thermal vacuum test.. (0°, 0°) (0°, 1°) (0°, 2°) (0°, 2.5°) (0°, -1°) (0°, -2°) (0°, -2.5°) (0°, 0°) (0°, 1°) (0°, 2°) (0°, 2.5°) (0°, 0°) (0°, 1°) (0°, 2°) (0°, 2.5°) (0°, 0°) (0°, 1°) (0°, 2°) (0°, 2.5°) (0°, -1°) (0°, -2°) (0°, -2.5°). MTF at 38.5 c/mm 78 73 79 78 76 75 75 76 73 74 76 80 78 78 79 77 78 74 75 77 76 74. Reference Post vibration 1 test. MTF at 38.5 c/mm 78 % 74 %. MTF 1 MTF 2. Table 7: MTF check results.. Reference Post vibration 1 test Post vibration 2 test Post thermal test. WFE RMS [wave] 0.078 0.162 0.115 0.124. WFE 1 WFE 2 WFE 3 WFE 4. WFE P-V [wave] 0.797 0.917 0.774 0.854. Table 6: WFE measurement results.. 5.0. 70 % Encircled energy radius [µm]. Rotated clockwise by 90°. Rotated counter clockwis e by 45°. Rotated clockwis e by 45°. Horizontal direction. Field of view. 4.5. 4.0. 3.5. 3.0. 2.5. Table 8: MTF measurement at the Nyquist frequency (38.5 c/mm).. -3.0. -2.5. -2.0. -1.5. -1.0. -0.5. 0.0. 0.5. 1.0. 1.5. 2.0. 2.5. 3.0. Field of view [arcdeg] PSF 1. PSF 2. Theoritical value. Fitting PSF 1. Fitting PSF 2. Figure 10: 70 % encircled energy radius in the field of view of the optical system. 6.8. Optical test conclusions The optical tests have demonstrated that the optical system QM fulfills the optical specifications. Although the optical performances vary little with the environmental constraints, the optical performances remain within the specifications. A maximum variation of 4 % of the MTF can be expected. The PSF measurements are limited by the microscope objective aberrations but reliable values, at the minimum of degradations, are better than theoretical values..
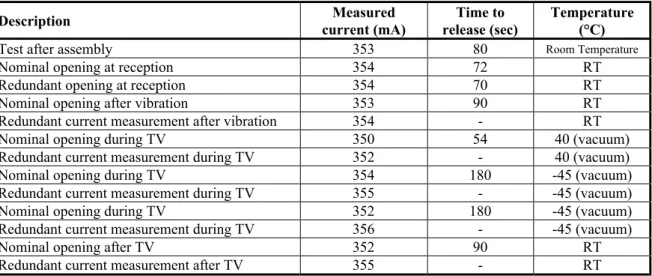
(9) 7. COVER SYSTEM TESTS 7.1. Cover System Test Plan A test plan was defined for the cover system acceptance. After the initial functional test, vibration tests will be performed according to the specifications. Then a functional test is performed again and followed by the thermal vacuum test. A final functional test is performed after the tests, before packaging.. 7.2. Functional tests description The goal of the functional tests is to verify that the cover will open within the required time (less than 300 seconds) after the different environmental condition exposures and during thermal vacuum test at high and low operational temperatures. The two circuits (nominal and redundant) will be verified. In order not to damage the less protected redundant circuit, only current measurement will be performed on this last part. For functional tests, the cover system will be mounted on a specific support that allows the connection of the cover to the EGSE through the interface connector. Before opening, the current is measured in the redundant lines. By applying 28 V to the redundant circuit, the measured current is reported. After this, the cover is opened using nominal line. The opening time as well as the microswitches status is reported. A visual inspection is performed and an activation report is filled in. At the beginning of the campaign, it was decided that all the opening will not lead to a clamping of the arm. For this, the arm was manually stopped during opening. It allow a direct closure of the door without activating the paraffin actuator one more time.. 7.3. Results of the functional tests The opening times and the currents are reported in table 9. Are also included the activation performed during thermal vacuum test. All the activations were successful. It can be concluded that the functional acceptance test is successful.. Description Test after assembly Nominal opening at reception Redundant opening at reception Nominal opening after vibration Redundant current measurement after vibration Nominal opening during TV Redundant current measurement during TV Nominal opening during TV Redundant current measurement during TV Nominal opening during TV Redundant current measurement during TV Nominal opening after TV Redundant current measurement after TV. Measured current (mA) 353 354 354 353 354 350 352 354 355 352 356 352 355. Time to release (sec) 80 72 70 90 54 180 180 90 -. Temperature (°C) Room Temperature. RT RT RT RT 40 (vacuum) 40 (vacuum) -45 (vacuum) -45 (vacuum) -45 (vacuum) -45 (vacuum) RT RT. Table 9: Functional tests results.. 7.4. Vibration test description The goal of the vibration is to apply to the cover system the vibration loads that the instrument will be exposed to during launch. The levels applied are the acceptance level which margin of safety are lower that the ones applied for qualification test. The cover system was shaked along its three reference axes with the levels described in the tables 10 and 11..
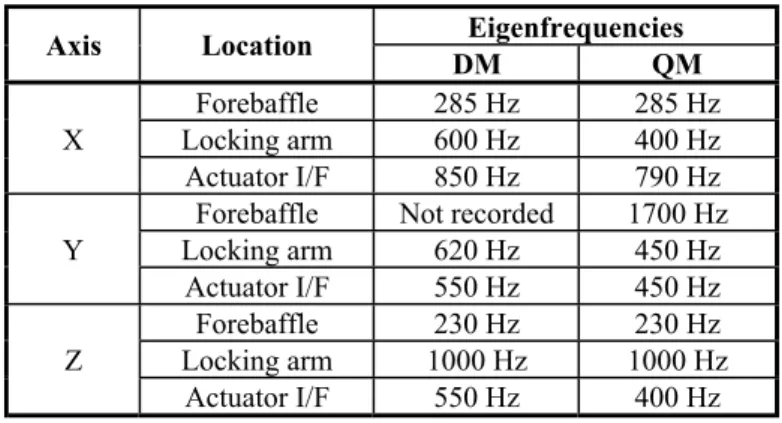
(10) Frequency (Hz) Level 5- 21 ± 7.33 mm 21 - 60 ± 13.33 g 60 - 100 ±4g Sweep rate: 4 octaves/minute 1 sweep up. Axis Lateral Z Lateral X. Table 10: Sine vibration test levels. Axial Y. Frequency (Hz). Level. Rms Acceleration 13.14 grms. 20 - 100 +6 dB/octave 100 - 2000 0.089 g_/Hz 21.518 grms +6 dB/octave 20 - 100 0.178 g_/Hz 100 - 334 +12 dB/octave 334 - 440 0.533 g_/Hz 440 - 650 -12 dB/octave 650 - 856 0.178 g_/Hz 856 - 2000 20 - 100 +6 dB/octave 16.09grms 100 - 2000 0.133 g_/Hz Duration of test: 1 minutes each axis Table 11: Random vibration test levels.. 7.5. Vibration tests results The system was shaked in CSL premises in class 1000 conditions. The required levels were respected without notching and the main structure survived to the test. The eigenfrequecies observed were more or less identical to the ones observed during STM-DM campaign except for the locking arm which design was modified for QM and for the paraffin actuator interface which is in close contact with the locking arm (see Table 12). Axis X. Y. Z. Location Forebaffle Locking arm Actuator I/F Forebaffle Locking arm Actuator I/F Forebaffle Locking arm Actuator I/F. Eigenfrequencies DM QM 285 Hz 285 Hz 600 Hz 400 Hz 850 Hz 790 Hz Not recorded 1700 Hz 620 Hz 450 Hz 550 Hz 450 Hz 230 Hz 230 Hz 1000 Hz 1000 Hz 550 Hz 400 Hz. Table 12: Cover system eigenfrequencies Nevertheless, two discrepancies were observed. One screw of the internal connector was found loosened after vibration test. This has no impact on the connection since the second one was still in correct position. In fact, this screw was not glued and it was decided to glue it before going on with the test plan. This screw will be glued also on the FM. The second discrepancy was more important: the microswitch 1 (that verifies the closed position) was no longer activated. This was due to a bad positioning of the lever screw. No sufficient margin were taken and slight displacement of the locking arm lead to the fact that the pressure was released on the microswitch. By correcting this problem, it was also pointed out that the microswitches mounting was wrong and that it decrease the operating range of the microswitch lever. This will be corrected for the FM. Nevertheless, the vibration test was considered successful and no additional test will be performed on the QM..
(11) 7.6. Thermal vacuum test description The goal of the thermal vacuum test is to verify that the cover system could operate at low and high operational temperature under vacuum and that it can survive to non-operational temperatures and cycling. The setup was identical to the one of the optical system. Once again, only one line was allowable on the facility. As a result, the test was longer than predicted. Four cycles were performed. The first one begins with high operational temperature (+40°C) (equivalent to high non-operational temperature in this case), after a two-hours stabilization, the door was opened. The vacuum chamber was then brought back to air to allow the manual resetting of the mechanism. The system was then exposed to low non-operational temperature (-95°C) during 2 hours and to low operational temperature (-45°C). After 2 hours stabilization, a functional test was performed again. After a new opening of the vacuum chamber for resetting, the cover system goes through the 3 following cycles between high and low operational temperatures and after the last stabilization at -45°C, a functional test was performed again.. Figure 11: Cover system instrumented with thermocouples. 7.7. Thermal vacuum test results The thermal vacuum test was performed without problem from a thermal and vacuum point of view. All the functional tests were successful (as described in table 9). Figure 12 summarized the thermal behavior of the cover system. The temperature setpoint and the temperature at 3 points of the cover system are indicated (interface plate, forebaffle and paraffin cell) as well as the pressure in the vacuum chamber. It can be noted that the thermocouple located on the paraffin cell recorded all the activation of the paraffin actuator. Points 1, 3 and 5 are the openings. In the hot case, the temperature raised to 60°C while in cold case, the temperature was only 30°C on the cell. The points 2 and 4 correspond to the resetting of the cover that is always performed at ambient pressure. The only discrepancy concerns the particulate cleanliness that was measured beyond specification. The value given by PFO witness is 75 ppm obscuration during the test period (22.5 ppm/24hrs) that is worse than the expected class 1000 (12 ppm/24hrs). This was probably due to the air movement during pressure recovery. The cover system was cleaned after the test. The molecular contamination was well within the specifications (lower than 0.2 10-7 g/cm_).. Figure 12: Thermal cycling result..
(12) 7.8. Conclusion of the cover system acceptance tests As a general conclusion, the cover system QM acceptance campaign was successful. The specimen shows its ability to operate after vibrations, under extreme temperature conditions and after thermal cycling. These tests also point out some discrepancies that will be solved for the FM unit. The FM will be manufactured identically and will take advantage of the experience of its predecessor. The QM will be packed and sent to INTA to be integrated into the camera unit and will go through the unit tests at qualification level.. 8. CONCLUSIONS As a general conclusion, the acceptance of all OMC QM sub-systems was considered successful. The QM campaign has highlighted a few discrepancies that will be corrected for the FM units. This test campaign will be very important in the preparation of the FM test campaign, the procedures will be adapted taking into account the observations and remarks of the QM tests. They concerns mainly the schedule preparation, we have now a good idea of the duration of the different phases and the cleanliness control, a better follow-up of the contamination. All GSE used for the QM will be used again for the FM along with proven procedures.. 9. ACKNOWLEDGMENT The work reported herein was sponsored by the Belgian Federal Office for Scientific, Technical and Cultural Affairs (OSTC) and coordinated by ESA Prodex Office (ESA Contract Nr 12968/98/NL/VJ(IC)). The authors are grateful to their Spanish collaborators at LAEFF and INTA. Special thanks go to Delft Sensor Systems - OIP for the work performed under aggressive schedule constraints.. 10. REFERENCES 1. 2.. E. Mazy, J.M. Defise, J.Y. Plesseria, L. De Vos, “Optical Design of the INTEGRAL Optical Monitoring Camera”, Proc. SPIE, Vol. 3426 (1998) E. Mazy, J.M. Defise, J.Y. Plesseria, “INTEGRAL Optical Monitoring Camera Stray-Light Design”, Proc. SPIE, Vol. 3426 (1998). 11. APPENDIX. Figure 13: Example of PSF of the optical system.
(13)
Figure


+7

Documents relatifs
the dark matter haloes in which galaxies are embedded and their large-scale environment: the mass function of dark matter haloes is top-heavy in high-density regions, thus in
We end up with a practical and operational non parametric test procedure, that exhibits satisfactory statistical performance and that can be applied to a single observation of
Regarding design 1, the Härdle and Mammen (1993), the Hall and Yatchew (2005) and the Escanciano (2006) tests are not robust to serial correlation in large samples, but they
Le nombre de configurations différentes possibles varie selon le problème considéré et la taille des échantillons. Nous examinerons quelques catégories importantes
The system has been deployed at the ATLAS test-beam and is currently used for data acquisition monitoring, online reconstruction and validation of the HLT se- lection architecture..
Students who received domain reasoner feedback did not use the stepwise structure for producing hypothesis tests in more tasks than students who received verification feedback
Abstract. 2014 A functional integral approach to the dissolution of fully symmetric polyelectrolyte complexes is presented. The dissolution itself may be caused by adding
Ce formalisme est appliqué au problème de la détermination complète d'ensembles non ambi- gus d'amplitudes ; il conduit au fait que le vecteur polarisation est su- perflu
