HAL Id: hal-01154618
https://hal.archives-ouvertes.fr/hal-01154618
Submitted on 22 May 2015
HAL is a multi-disciplinary open access
archive for the deposit and dissemination of
sci-entific research documents, whether they are
pub-lished or not. The documents may come from
teaching and research institutions in France or
abroad, or from public or private research centers.
L’archive ouverte pluridisciplinaire HAL, est
destinée au dépôt et à la diffusion de documents
scientifiques de niveau recherche, publiés ou non,
émanant des établissements d’enseignement et de
recherche français ou étrangers, des laboratoires
publics ou privés.
Revisiting carbonate quantification in apatite
(bio)minerals: a validated FTIR methodology
Anne Grunenwald, Christine Keyser, Anne-Marie Sautereau, Eric Crubézy,
Bertrand Ludes, Christophe Drouet
To cite this version:
Anne Grunenwald, Christine Keyser, Anne-Marie Sautereau, Eric Crubézy, Bertrand Ludes, et al..
Revisiting carbonate quantification in apatite (bio)minerals: a validated FTIR methodology. Journal
of Archaeological Science, Elsevier, 2014, vol. 49, pp. 134-141. �10.1016/j.jas.2014.05.004�.
�hal-01154618�
To link to this article: DOI:10.1016/j.jas.2014.05.004
http://dx.doi.org/10.1016/j.jas.2014.05.004
This is an author-deposited version published in:
http://oatao.univ-toulouse.fr/
Eprints ID: 12053
To cite this version:
Grunenwald, Anne and Keyser, Christine and Sautereau, Anne-Marie and
Crubézy, Eric and Ludes, Bertrand and Drouet, Christophe Revisiting
carbonate quantification in apatite (bio)minerals: a validated FTIR
methodology. (2014) Journal of Archaeological Science, vol. 49 . pp.
134-141. ISSN 0305-4403
O
pen
A
rchive
T
oulouse
A
rchive
O
uverte (
OATAO
)
OATAO is an open access repository that collects the work of Toulouse researchers and
makes it freely available over the web where possible.
Any correspondence concerning this service should be sent to the repository
administrator:
[email protected]
Revisiting carbonate quantification in apatite (bio)minerals: a
validated FTIR methodology
A. Grunenwald
a,b, C. Keyser
b, A.M. Sautereau
a, E. Crub
ezy
c, B. Ludes
b, C. Drouet
a,*aCIRIMAT Carnot Institute e Phosphates, Pharmacotechnics, Biomaterials, University of Toulouse, CNRS/INPT/UPS, ENSIACET, 4 allee Emile Monso, 31432
Toulouse Cedex 4, France
bInstitute of Legal Medicine, AMIS Laboratory, CNRS UMR 5288, University of Strasbourg, 11 rue Humann, 67085 Strasbourg Cedex, France
cMolecular Anthropology and Image Synthesis Laboratory (AMIS), CNRS UMR 5288, University of Toulouse, 37 allee Jules Guesde, 31000 Toulouse, France
Keywords: Carbonate Apatite Bone FTIR Diagenesis
a b s t r a c t
Carbonated apatites represent an important class of compounds encountered in many fields including anthropology, archeology, geology, medicine and biomaterials engineering. They constitute, in particular, the mineral part of bones and teeth, are found in sedimentary settings, and are used as biomimetic compounds for the development of bone tissue engineering scaffolds. Whether for assessing the degree of biomimetism of synthetic apatites or for better understanding diagenetic events, their thorough physico-chemical characterization is essential, and includes, in particular, the evaluation of their car-bonate content. FTIR is especially well-suited for such a goal, as this spectroscopy technique requires only a low amount of specimen to analyze, and carbonate ions exhibit a clear vibrational signature. In this contribution, we critically discuss several FTIR-approaches that may be (or have been) considered in view of carbonation quantification. The best methodology appears to be based on the analysis of then3(CO3) andn1n3(PO4) modes. The area ratio rc/pbetween these two contributions was found to be directly correlated to the carbonate content of the samples (R2¼0.985), with the relation wt.% CO
3¼28.62*rc/ pþ0.0843. The method was validated thanks to titrations by coulometry assays for various synthetic reference samples exhibiting carbonate contents between 3 and 7 wt.%. The FTIR carbonate quantifica-tion methodology that we propose here was also tested with success on three skeletal specimens (two bones/one tooth), after elimination of the collagen contribution. Comparative data analysis is also pre-sented, showing that the use of other vibration bands, or only peak heights (instead of peak areas), leads to significantly lower correlation agreement. This FTIR data treatment methodology is recommended so as to limit errors on the evaluation of carbonate contents in apatite substrates.
1. Introduction
Hard tissues (bones and teeth) in vertebrates are natural com-posite materials (Price et al., 1985) consisting of well-organized organic and inorganic moieties in tridimensional arrangements (Gomez-Morales et al., 2013; Landis et al., 1996), in order to fulfill appropriately physicochemical, biological, and mechanical func-tions. The mineral part is composed of an apatite phase that derives from hydroxyapatite (HA), Ca10(PO4)6(OH)2. In the case of enamel, the chemical composition of the apatite phase closely resembles
that of HA (in a microcrystalline setting), whereas the apatite phase constituting bone mineral or dentin is clearly nanocrystalline and significantly departs from stoichiometry. In all cases, trace ele-ments can also enter the structure, such as fluorine, magnesium or strontium among others (Elliott, 1994). These considerations typi-cally illustrate the exceptional capacity of the apatite structure to adapt its composition and crystal dimensions to the functions that it has to achieve in vivo (low solubility, resistance to acidic attacks for enamel; greater solubility for bone mineral which has to un-dergo remodeling processes and remain active in homeostasis).
In all cases, carbonate ions are also found to substitute anions in biological apatites (Rey et al., 1989; Pasteris et al., 2014; Shimoda et al., 1990; Gomez-Morales et al., 2013; Elliott et al., 1985): phos-phates (leading to “B-type” carbonated apatites) or hydroxides (“A-type”), or the mixed “AB-type”. The incidence of carbonation in biological apatites is not anecdotic: carbonate ions, CO32!, are * Corresponding author. CIRIMAT Carnot Institute, ENSIACET, 4 allee Emile
Monso, 31432 Toulouse cedex 4, France. Tel.: þ33 (0)34 32 34 11; fax: þ33 (0)34 32 34 99.
known to be growth inhibitors for the apatitic structure (Shimoda et al., 1990); their presence is thus expected to modulate mineral-ization processes. Also, carbonate ions are thought to stabilize the non-apatitic surface layer present on apatite nanocrystals. Indeed, for a similar maturation time in solution, carbonated apatites exhibit a lower degree of maturity than their non-carbonated counterparts (internal communication). The presence of carbon-ate ions during the mineralization of collagenic proteins in vivo is thus likely to influence the final characteristics of the apatite crystals that are being formed, although the level of carbonation is known to increase with the maturity of the biomineral (Pellegrino and Biltz, 1972; Legros et al., 1987).
It is possible to prepare by soft chemical route some “bio-mimetic” apatite nanocrystals approaching the composition, structure, and microstructure of biological apatites, and their physico-chemical features can be tailored by controlling adequately the precipitation conditions (Vandecandelaere et al., 2012). Bio-mimetic analogs can be either precipitated in the presence or in the absence of carbonate ions. Recently, we highlighted some of the similarities existing between a carbonated apatite matured for one week (Grunenwald et al., 2014) and a typical modern bone spec-imen. Such synthetic apatite compounds can be considered as “models” of the mineral part of bones, allowing one to investigate interfacial phenomena in a simplified and more controlled way than with biologically-derived samples, as we did recently in the field of ancient DNA preservation (Grunenwald et al., 2014). Syn-thetic carbonated apatites are also good candidates for the setup of scaffolds for bone tissue engineering or for coating prosthetic de-vices, taking into consideration their intrinsic biocompatibility and similarity to bone mineral.
Whether of natural origin or of synthetic nature, carbonated apatites can be encountered in various fields of interest, from an-thropology or forensic sciences (analysis of skeletal remains) to biomaterials engineering, as well as fundamental research aiming at better understanding biomineralization processes. In all cases, sample characterization is a necessary step, which includes the determination of the carbonation content. As regards synthetic samples, this determination is necessary to evaluate the degree of analogy (biomimetism) to bone mineral with varying maturity
stages after bone remodeling. The CO3 content in apatite
com-pounds progressively increases upon maturation of the crystals (Pellegrino and Biltz, 1972). In the case of biological apatites, the knowledge of the carbonation level may help understanding diagenetic phenomena since the alteration of the CO3content from skeletal specimens appears to be site-specific (Trueman et al., 2008; Cazalbou et al., 2004; Kohn et al., 1999). Also, Roche et al. argued for changes to the A-B ratio in fossils compared to modern tissues, thus pointing out that the carbonate component of biogenic phosphates can change during diagenesis (Roche et al., 2010). In geochemistry and paleoenvironment/paleobiology domains, it may help to extract precious information via isotopic titrations of carbon or oxygen isotopes contained in the CO32anions (Suarez and Kohn, 2011; Lecuyer et al., 2010; Sponheimer and Lee-Thorp, 2001; Kohn et al., 1996; Tütken and Vennemann, 2011; Price et al., 1985).
The list of techniques that may potentially come into play for assessing the amount of carbonate ions associated with the apatite phase is however quite limited. Methods based on total carbon titration after sample calcination are generally associated with non-negligible uncertainties (estimated to several weight percent), which limits their practical usefulness. Methods based on the release of carbon dioxide upon acidification and subsequent elec-trochemical quantification (coulometry assays) yield significantly more accurate results (Eichert et al., 2007; Engleman et al., 1985), but require a substantial amount of sample (typically of the order of several tens to hundreds of milligrams) which is not often an option
in the case of archeological or forensic specimens where only a very limited quantity of matter is available.
In this context, the use of vibrational spectroscopies such as Raman or Fourier Transform Infrared (FTIR) spectroscopies appears particularly relevant due to the high sensitivity of these techniques and the very low amount of specimen that they require (typically 1e2 mg). Lebon et al. have pointed out however some difficulties related to the use of Raman spectroscopy due to fluorescence of biological/fossil systems as well as to the low intensity of the car-bonate contribution (Lebon et al., 2011). The
n
2(CO3) andn
3(CO3) vibration modes of carbonate ions incorporated in an apatitic lat-tice are on the contrary quite easily detectable by FTIR. This tech-nique thus appears as a potentially adapted techtech-nique for carbonation quantification. Puceat et al. proposed to follow, by FTIR, the carbonation of apatites on the basis of the ratio of peak heights between the 1415 cm1band of then
3(CO3) band, mostly assign-able to B-type carbonate, and the sum of the two peaks (i.e. 601 and 560 cm1) of then
4(PO4) contribution (Puceat et al., 2004). In a rather similar intention, Featherstone et al. had previously inves-tigated a method based on the ratio of extinction coefficients at
1415 and 575 cm1 (Featherstone et al., 1984). However, this
method based on a comparison of peak heights at selected wave-numbers can hardly account for the variability of carbonate chemical environments in all apatite specimens, where not only B-type carbonates but also A-B-type or even labile carbonates (per-taining to the non-apatitic surface layer on apatite nanocrystals (Gomez-Morales et al., 2013; Eichert et al., 2007; Rey et al., 2011)) may coexist in variable proportions (Rey et al., 2011). Moreover, the hydroxylation of apatite e which may be variable depending on
stoichiometry e leads to a libration band at 632 cm1
super-imposed to the
n
4(PO4) band (Drouet, 2013). It has also been sug-gested (Puceat et al., 2004; Sosa et al., 2013; Boskey et al., 2005) evaluating the carbonate contribution using the area or intensity ratio of the 1415 cm1band alone (not considering the rest of then
3(CO3) contribution) relative to then
3(PO4) phosphate band, instead ofn
4(PO4), or exploiting then
2(CO3), for example, through then
2(CO3)/n
3n
1(PO4) area ratio. However, in the case of HPO4 -containing apatites, the occurrence of overlapping HPO4-related contributions in then
2(CO3) domain adds some obvious complexity in IR data which does not seem to have received attention so far. Yet, most synthetic apatites obtained by wet chemistry as well as biological bone or dentin specimens are expected to be non-stoichiometric and to incorporate non-negligible proportions of HPO42 ions (Gomez-Morales et al., 2013), the presence of which has thus to be considered prior to developing IR methodologies.In this context, the present contribution intends to 1) discuss which carbonate and phosphate vibrational contributions should be favored in view of carbonation quantification, and 2) to develop and test an FTIR-based methodology adapted to the evaluation of the CO3content of both synthetic and biological specimens. The validation of the method has been made through the use of direct carbonate titrations via coulometry assays. To this end, we have prepared a set of carbonated apatite reference compounds to be used for calibration purposes, allowing us to check relationships between IR data (integrated intensities of several vibrational con-tributions) and coulometric results. The skeletal specimens tested in this work arose, on the contrary, from archeological settings. 2. Materials and methods
2.1. Synthetic apatite compounds
Several synthetic carbonated apatite samples, used as reference materials in this work, were synthesized by precipitation in aqueous medium, at close-to-physiological pH (experimental
value ~ 7.2) and at different temperatures, namely 10 C, 20C, room temperature (22C), 37C, 50C, and 70C. Except for ex-periments run at room temperature or at 70C, the temperature was controlled using a double-envelope reactor and a circulating device allowing the recirculation of a fluid between the two en-velopes for precise temperature regulation. The sample prepared at 70C could not be stabilized in the same way due to the inadequacy of using the recirculating device at this temperature. For this sample, the precipitation was undergone in an Erlenmeyer flask connected to a reflux condenser to avoid water evaporation.
Two solutions, A and B, were prepared prior to the precipitation. A calcium-containing solution (solution A, typically 75 ml) was prepared by dissolving Ca(NO3)2.4H2O (Merck Emsure grade, purity 99.0%) in deionized water, up to reaching the concentration of 0.3 M. In parallel, solution B (150 ml) containing a phosphate source and a carbonate source was prepared by dissolving (NH4)2HPO4
(VWR Normapur grade, purity 99.0%) and NaHCO3 (purity
99.0%) up to the respective concentrations of 0.45 M and 0.71 M. Solutions A and B were then mixed and allowed to mature in the mother solution, with or without magnetic stirring (as indicated in the text), for a maturation time varying between 0 and 15 days (aging time in solution). The precipitating medium was then filtered on Büchner funnel, thoroughly washed with deionized water and freeze-dried (freeze-dryer set to !80 C and residual pressure 10 mbar). The freeze-dried powders were collected and stored in a freezer at !18C, to avoid any subsequent evolution prior to physico-chemical analyses.
These synthetic reference samples will be named “hacXX-Yd”, where XX corresponds to the synthesis temperature (in degrees Celsius) and Y denotes the number of maturation days in solution prior to filtration.
2.2. Skeletal specimens
Three skeletal specimens, corresponding to various geograph-ical areas and epochs (Iron Age, Middle Ages and twentieth cen-tury) were investigated. The samples were provided by the AMIS laboratory (CNRS, UMR 5288, France). The specimens will be identified, in the present work, using the following names: “20th Cent”, “mid-ages”, and “Iron age”. The first sample, “20th Cent”, corresponds to an adult male femur dating from the mid-twentieth century. The second, “mid-ages”, is part of an adult male tooth originating from Roeschwoog Alsace, France, and dating from the Middle Ages (registry ref. #R3189B); this sample was obtained by crushing the entire tooth, thus mixing dentin and enamel. The third specimen, “Iron age”, comes from the Iron Age period (around 1800e1400 BC) and corresponds to a female bone from Kras-noyarsk region, Russia (registry ref. #S09).
No chemical pretreatment was performed so as to limit possible alterations of the mineral part contained in the samples. The specimens were first roughly ground using a 6870 SamplePrep Freezer Mills (Fischer Bioblock, Illkirch, France) and then subjected to a milling process (Spex 5010 Freezer Mill) for the obtainment of fine powders in view of physicoechemical characterizations.
2.3. Physicoechemical characterization
Powder X-ray diffraction was used to confirm the apatitic nature of the crystallized phase contained in the samples (as well as the absence of secondary deposits such as calcite in the case of fossil bones/teeth). The XRD analyses were carried out on an INEL CPS 120 curved-counter diffractometer using the monochromatic Co-balt K
a
radiation (l
Co¼1.78892Å).The carbonate content of reference synthetic apatites was measured by coulometry using a CO2coulometer (UIC, Inc. CM 5014
coulometer) measuring in a closed system the carbon dioxide (CO2) released during sample dissolution in acidic conditions (CM 5130 acidification unit, use of HClO42 M for synthetic samples and 6 M
for biological specimens). The CO2 released was automatically
transferred into a photometric cell and titrated through an acid-ebase reaction (Engleman et al., 1985; Huffman, 1977). Barium carbonate (Prolabo, purity >99%) was used as a reference material for checking the calibration of the apparatus. Measures were made at least in duplicate. The uncertainty of this method is evaluated to ±0.5 wt.% CO3.
Fourier Transform Infrared spectroscopy (FTIR), using KBr as a solid diluent, was used to analyze vibrational features of the specimens. About 1.5 mg of each sample was mixed and ground with 200 mg of KBr. Composite pellets were prepared out of this mixture by uniaxial compression under 8 tons cm!1for ca. 10 s. The FTIR spectra were acquired by transmission, in the wavenumber
range 400e4000 cm!1 using a Nicolet 5700 spectrometer (64
scans, with a resolution of 4 cm!1). The spectra were subsequently analyzed with the OMNIC 8 software (Thermo Nicolet). Background deviations on FTIR spectra were corrected using the automatic background correction tool of the software (the background line consisting in a series of joint linear segments). This led to zeroing in particular the absorption levels at points such as 4000, ~2000, ~800
and 400 cm!1. Fig. AR1 in the Additional Resources shows an
example of spectrum (synthetic carbonated apatite) after back-ground correction, in the 400e2000 cm!1range.
Several analysis methodologies have been tested in this work for the reference samples, in view of seeking correlations between IR data (related to carbonate and phosphate species) and coulometry data. The different methodologies will be explained where adequate in the text; they essentially differ by the considered vibrational domains. In each case, the analytical reproducibility of intensity ratios was checked by performing the same quantification method in triplicate.
3. Results and discussion
3.1. Carbonated apatite reference compounds
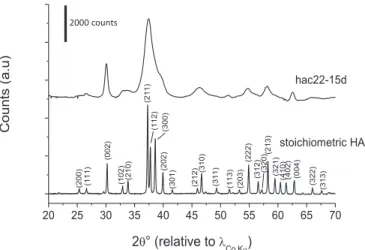
The apatitic nature of the synthesized samples studied in this work has been verified by XRD analyses. In all cases a pattern typical of an apatitic phase was indeed detected, as attested in accordance to the JCPDS card no. 09-432 relative to hydroxyapatite. The typical pattern obtained relative to sample hac22-15d (i.e. prepared at Tamb~22C and matured for 15 days) is reported in Fig. 1as illustrative example, along with the indexation of the main diffraction lines.
The carbonation level of the reference samples (carbonated apatites prepared by precipitation in various conditions) was then evaluated by coulometry assays. A summary of the results obtained in terms of weight percent of carbonate associated with the apatite phase is given inTable 1. As may be remarked, for systems prepared in similar stirring conditions, the degree of carbonation of the apatite phase clearly rises upon increasing the synthesis tempera-ture (comparing samples hac10-15d, hac20-15d, hac37-15d, hac50-15d) or the maturation time in solution (comparing samples hac22-0d, hac22-1d, hac22-15d). Note that the samples hac22-15d and hac70-15d (prepared respectively at 22 and 70C) display a lower carbonation level than what could be expected at first from the general temperature-driven tendency. Sample hac22-15d, howev-er, cannot be directly compared with the other samples matured for 15 days, due to distinct stirring conditions; the absence of stirring potentially limiting the kinetics of carbonation (but being closer to “natural” conditions). The lower carbonation of sample hac70-15d is due to a different cause; it can be related to a temperature that
approaches the boiling temperature of the solution. In this respect, the elimination of dissolved gases (including CO2) is facilitated.
These eight samples may be considered as a set of reference carbonated apatite samples, with a wide range of carbonation levels between 3 and 6.9 wt.% CO3(bone and teeth specimens being known to exhibit carbonate contents of up to about 4e8 wt.% CO3, (Gomez-Morales et al., 2013; McElderry et al., 2013)).
3.2. FTIR data analysis for carbonated apatite reference compounds
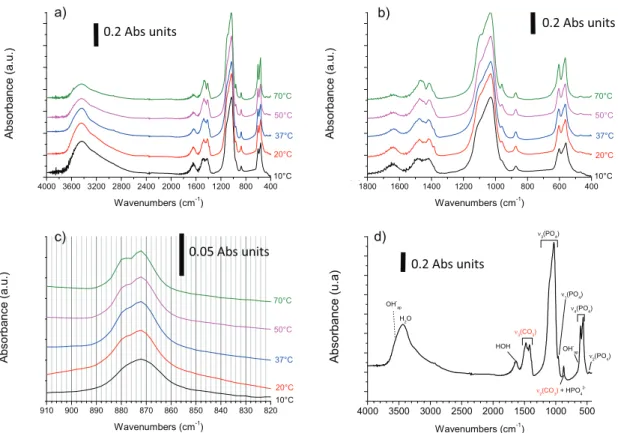
Fig. 2shows typical FTIR data found for such carbonated apatite reference materials;Fig. 2a gives an overview of the full spectra in the range 400e4000 cm1; andFig. 2b reports an enlarged view of the range 400e1800 cm1where characteristic carbonate absorp-tion corresponding to the
n
2(CO3) andn
3(CO3) IR-active vibration modes can be evidenced respectively around 840e900 and 1350e1550 cm1. The former being less intense than the latter, Fig. 2c gives a zoomed view of then
2(CO3) domain (which is merged with a vibrational contribution around 875 cm1 assignable to HPO42). Finally, the attribution of each vibrational contribution is given inFig. 2d in the typical case of sample hac37-15d. Apart from carbonation bands, the characteristic features of apatitic com-pounds are also clearly visible on these spectra, with apatitic hy-droxide (OHap) bands at 3572 (OeH stretching) and 632 cm1(OH libration), as well as phosphate modesn
1(PO4),n
2(PO4),n
3(PO4), andn
4(PO4) as indicated inFig. 2d. Water bands are also seen in the OeH stretching domain (3000e3600 cm1) as well as HOH defor-mation domain (1640 cm1).As a general trend, it may be remarked that, upon increasing the
maturation temperature from 10 to 70 C, the resolution of the
spectra is enhanced, with, in particular, an increasingly separated
n
1(PO4) contribution from then
3(PO4) domain. Also, the global amount of water associated with the samples progressively de-creases. These observations may be related to an increased degree of crystallinity as can be expected from apatites precipitated in higher temperature conditions. This increase in crystallinity state has been investigated by analysis of then
4(PO4) band (Fig. 3), byfollowing two parameters as inFig. 3b. First, the difference in po-sition between the two maxima of this band was followed versus the maturation temperature, this parameter being related to the level of distortion existing in the PO4 tetrahedrons. Second, a crystallinity index CI (aka “splitting factor”) was evaluated from the “depth” of the pit between the two maxima using a method pro-posed in the literature (Shemesh, 1990; Weiner and Wagner, 1998; Thompson et al., 2011; Termine and Posner, 1966; Weiner and Bar-Yosef, 1990) and consisting of the ratio (after baseline correction) between the sum of the absorbance of the two maxima divided by the absorbance of the minimum between them. Despite non-negligible error bars, the two parameters conjointly suggest an evolution (decrease of splitting and increase of CI) toward better crystallized apatitic systems upon increasing the synthesis tem-perature, which confirms our above hypothesis. It may also be noted that the CI values were found here to range between ca. 3 and 4, which was also the case for pristine sedimentary apatites (Shemesh, 1990) as well as fossil or modern bones (Weiner and Wagner, 1998). Taking also into account the above-mentioned carbonation range of the reference compounds prepared here, the observations confirm that these compounds exhibit physico-chemical characteristics that are in perfect agreement with “target” unknown specimens susceptible to be analyzed (apatites from sediments, bones, synthetic analogs). These reference com-pounds thus appear as particularly relevant for the establishment of an FTIR methodology for carbonate quantification.
3.3. Selection of FTIR contributions to be considered for carbonate quantification
It is essential at this stage to discuss which FTIR contributions have to be considered in view of carbonation quantification. In order to inspect the degree of carbonation of a phosphate matrix, as is the case here, the follow-up of a ratio between a carbonate contribution (numerator) and a phosphate contribution (denomi-nator) appears coherent. Numerous factors such as HPO4:PO4ratio, A:B ratio of CO3, labile surface CO3, and lattice distortion from variable minor element chemistry all affect band position, shape, and intensity. Thus, an area-based method appears preferable to considering peak heights at selected wavenumbers.
3.3.1. Selection of carbonate contribution
As mentioned above, the presence of CO32ions leads to two vibration modes active in IR, namely
n
2(CO3) andn
3(CO3) (Rey et al., 2011). However, the PeOH stretching vibration at 875 cm1 of HPO42 ions, that are also generally present in nonstoichiometric apatites, is superimposed with then
2(CO3) mode which falls typi-cally in the range 840e900 cm1. The consideration of this car-bonate mode to assess the degree of carbonation of apatitic compounds thus becomes problematical. It may be attempted, via spectral decomposition, to separate each contribution arising in this spectral range, especially for removing the part linked to HPO4. However, this task is made difficult by the possible presence of many contributions with maxima found to be rather close in po-sition, including B-type and A-Type carbonates (respectively around 872 and 883 cm1, (Rey et al., 2011)), but also labile car-bonates giving rise to a large band for which the exact position isTable 1
Carbonation levels for the carbonated apatite references prepared in this work, and temperature control conditions.
Sample hac22-0d hac22-1d hac10-15d hac20-15d hac22-15d hac37-15d hac50-15d hac70-15d
Stirring no no yes yes no yes yes yes
Wt%. CO3 3 3 5.9 5.9 5.5 6.8 6.9 5.3
Fig. 1. Typical XRD pattern of the hac22-15d carbonated apatite sample, and index-ation in reference to JCPDS card no. 09-432 relative to stoichiometric hydroxyapatite.
not well-known (carbonation in amorphous calcium phosphate leading to absorption at 866 cm1 (Rey et al., 2011)) as well as the HPO42 contribution at 875 cm1. Moreover, the external titration of HPO42 ions by methods such as thermogravimetry (TGA) or spectrophotometry (e.g. using the yellow
phos-phoevanadoemolybdenum complex (Gee and Dietz, 1953)) is
extremely delicate (Elliott, 1994) in the co-presence of carbonate
ions due to parasite reactions such as CO32þ2HPO42/
CO2þH2O þ 2PO43. Therefore, the use of the
n
2(CO3) does not appear appropriate for the evaluation of the carbonate content in a general situation where the presence of HPO42 ions cannot be excluded.In contrast, the
n
3(CO3) vibration mode is well separated from the main phosphate absorption bands, which makes it suitable for carbonate quantification. In the case of biological specimens, however, a complication arises due to vibrations of collagen (Kimura-Suda et al., 2009), the amide bands of which lead to ab-sorptions typically in the range 1930e1230 cm1. This superim-position of IR bands from carbonate and collagen therefore prevents a direct analysis of mineral carbonation. Chemical treat-ments aiming at dissolving the collagen matrix could also lead to modifications of the apatite features, and it is thus not advised. Since the added complexity is due to the presence of amide bands from collagen, it is, however, theoretically possible to subtract this contribution by subtracting e with an adequate multiplying factor (until minimizing the intensity of amide vibrations in the1930e1230 cm1 domain) e the spectrum of pure collagen
ac-quired in the same experimental conditions. Consequently, whether for synthetic or biological apatitic samples, the evaluation of carbonation seems to be appreciable based on the analysis of the
n
3(CO3) mode. This mode has thus been selected (see the following section for the experimental validation on both synthetic and biological specimens).Fig. 2. FTIR spectra for carbonated apatite reference compoundss: a) typical spectra obtained for various maturation temperatures (for 15 days of maturation), b) zoom on the 400e1800 cm1range, c) detail on then
2(CO3) region, d) indexation of bands (example of sample hac37-15d).
Fig. 3. Analysis of then4(PO4) vibrational domain for carbonated apatite references prepared at various temperatures: a) spectra in the 400e750 cm1range, and b) evolution ofn4(PO4) maxima separation and crystallinity index CI (or “splitting factor”) evaluated from then4(PO4) domain.
3.3.2. Selection of phosphate contribution
Phosphate ions lead to various FTIR contributions. However, since the
n
1(PO4) andn
2(PO4) modes are only poorly active in infrared, considering them for quantification purposes would lead to increased uncertainties. In contrast, then
3(PO4) andn
4(PO4) domains are significantly more intense, which is expected to limit propagated errors. The libration band of apatitic OHions, how-ever, appears at 632 cm1, which superimposes to then
4(PO4) domain. Since apatite compounds are often nonstoichiometric due to the presence of vacancies in calcium and hydroxide sites, the level of hydroxylation may significantly vary from one sample to another, thus modifying the overall shape of the
n
4(PO4) band. As this libration contribution can be non-negligible in intensity but also because it cannot easily be distinguished from the phosphate vibrations belonging to then
4(PO4) domain (unless using time-consuming spectral decomposition methods), the exploration of then
4(PO4) domain for in carbonate quantification methodologydoes not seem appropriate.
Overall, the
n
3(PO4) appears the best choice to assess carbonate contents of apatite. However, especially in low-crystallinity sam-ples, then
1(PO4) singlet vibration is not cleanly separated from then
3(PO4) band (e.g.Fig. 2b), and appears as a shoulder ton
1(PO4). Thus the combinedn
1n
3(PO4) domain appears most practical in avoiding additional spectral treatment to subtract then
1(PO4) contribution.3.4. Exploration of FTIR methodologies
The vibrational domains retained for this carbonation analysis are
n
3(CO3) for carbonate ions andn
1n
3(PO4) for phosphates. Based on our experimental IR spectra, we measured for each of the reference samples, using the OMNIC 8 software, the integrated intensities (¼peak areas) corresponding to these three compo-nents. These measurements were carried out after a preliminary baseline correction of the complete 4000e400 cm1spectrum. The integration of then
3(CO3) band was done in such a way as to include the totality of then
3(CO3) contribution, typically between 1570 and 1330 cm1. Then
1n
3(PO4) contribution was integrated between 1230 and ~900 cm1. This lower limit was selected as the local minimum in order to avoid including the band expanding from ca. 800 to ca. 900 cm1due ton
2(CO3) and to HPO42. The upper limit of 1230 cm1was chosen because collagen subtraction for biolog-ical samples is bound to alter the region 1930e1230 cm1where amide bands are located (Boskey et al., 2005). The evaluation of the band area corresponding ton
1n
3(PO4) was found, in contrast, to be essentially unaffected (data not presented graphically here) by the collagen subtraction between these limits of 1230 and 900 cm1, therefore confirming the possibility of using this wavenumber range. The integration areas of interest for the determination of the carbonate/phosphate ratio denoted “rc/p” between the integrated intensity ofn
3(CO3) and that ofn
1n
3(PO4) are shown graphically in Fig. 4a.The evolution of the amount of carbonate in reference samples (as measured by coulometry) has been plotted inFig. 4b versus the ratio rc/p. Interestingly, a linear trend could be evidenced (see raw data onTable AR1 in the Additional Resources), with good corre-lation parameters (R2¼0.985), leading to the relationship given in Equation(1):
wt:% CO3¼28:62*rc=pþ0:0843 (1)
Despite absolute uncertainties on data points, this correlation confirms advantageously the possibility to exploit IR data for drawing quantitative assessments on the level of carbonation of apatitic compounds, and using the areas of the two spectral
components
n
3(CO3) andn
1n
3(PO4). The ordinate values (y-axis) given by this method are associated with an absolute error close to ±0.5% on the final wt.% CO3. In this Figure, the fitted line was graphically prolonged (dashed line) down to 2 wt.% CO3and up to 13 wt.% CO3to access visually the correspondence between rc/pand wt.% CO3for a larger range of carbonation levels.If the same type of relationship is sought by considering the
n
4(PO4) domain instead ofn
1n
3(PO4), a poorer correlation is reached: when applied to reference samples fromTable 1, a cor-relation coefficient of R2 ~ 0.82 is found (see Fig. AR2 in the Additional Resources). This poor agreement was expected based on the above discussion (see previous section), because the level of hydroxylation of the apatite phase is bound to vary between sam-ples, and then
lib(OH) libration band at 632 cm1cannot be easily separated from the largen
4(PO4) band, therefore generating a bias to the use of then
4(PO4) band in the determination of a carbonation ratio.If rc/pis calculated by considering the area of the
n
2(CO3) band instead ofn
3(CO3), an even poorer correlation is observed with the amount of carbonate of the reference compounds, with a coefficient of R2 ~ 0.46 (Fig. AR2). Again, this illustrates the inadequacy mentioned in the previous section to inspect the carbonation level on the basis of then
2(CO3) band, which in fact also contains a non-negligible and varying HPO4contribution among the samples. Fig. 4. FTIR methodology for carbonate quantification: a) evaluation of the ratio rc/p between the integrated intensity ofn3(CO3) and that ofn1n3(PO4), and b) correlation between rc/pand the carbonation amount (in wt.% CO3) in the apatite phase of syn-thetic reference compounds and for three biological samples.As indicated in the introduction, the use of peak heights rather than areas has been proposed to follow the carbonation level of apatites, especially by considering the maximum at 1415 cm1(in the
n
3(CO3) domain) relative to the phosphate maximum of then
3(PO4) band, around 1040 cm1(exact position depending on the samples). Plotting the carbonate content measured by coulometry versus this height ratio led, when applied to the reference samples, to a correlation coefficient of R2~0.76 (Fig. AR2). Although a rather linear trend can be observed here, the quality of this correlationremains lower than the one obtained using the rc/p area ratio
(R2~ 0.99).
All of these findings validate the rc/parea ratio between
n
3(CO3) andn
1n
3(PO4) as the most adapted FTIR parameter to consider for carbonation quantification in apatites, this ratio being defined as the quotient between the full area of then
3(CO3) band (typically in the range 1570e1330 cm1) and the area of then
1n
3(PO4) band (typically in the range 900e1230 cm1).At this point, it was interesting to check the validity of this % CO3¼f(rc/p) relationship also for biological apatites. Three skeletal specimens (two from bones and one from a tooth), as described in the experimental section, were selected to this end. The absence of calcite as secondary deposit in these biological/fossil specimens was confirmed by XRD analyses as well as IR spectroscopy (absence of the calcite band at 712 cm1). In a first step, the carbonation of each of these three samples was directly measured by coulometry. This was made possible by the occurrence of enough bone/tooth matter for the selected specimens, as 50e80 mg of sample was needed in each coulometry experiment (performed at least in duplicate). As always for coulometry assays, a calibration was pre-liminarily done with barium carbonate (BaCO3). Since skeletal specimens are also associated with an organic matrix, most of which is collagenic in nature, we also ran a test with a known quantity of BaCO3added with bovine collagen (type I from bovine Achilles tendon, Sigma Aldrich), 12 wt.% in proportion, in order to check whether the presence of this protein in the reacting cell could modify the response of the coulometer. Advantageously, no devi-ation of the apparatus outcome was pointed out, confirming that coulometry assays could also be run on biological specimens. Considering bone and tooth samples as containing respectively 20 and ~5% of organic matter, the coulometry results (obtained initially with 50e80 mg of bone/tooth specimen) could be cor-rected to derive the amount of carbonation relative to the mineral phase (apatite only) in these samples. This led to a carbonation level in the apatite phase contained in the biological samples “20th Cent”, “mid-ages”, and “Iron age” of wt.% CO3¼5.1, 4.1, and 6.1% (±0.5%), respectively.
In addition, FTIR spectra were collected for these three skeletal specimens, in the same conditions as was done above for synthetic reference compounds.Fig. 5reports a typical example obtained for such biological specimens. Due to the presence of the organic matrix, the spectral signature of collagen appears clearly on the spectrum with amide bands distinguishable in the region of 1930e1230 cm1, thus partly overlapping with inorganic carbon-ate. In order to take into account, in the %CO3¼f(rc/p) relationship, only the vibrational contribution of carbonate, a spectral treatment was carried out by subtracting a typical spectrum of type I bovine bone collagen (modern collagen from own collection; access to IR spectra for collagen with varying preservation states in link with diagenesis were not accessible to us) until minimizing the amide contributions in the above-cited region (Fig. 5). In practice, this subtraction of the collagen contribution thus consisted in increasing the multiplying factor “
g
” in the global equation [cor-rected spectrum] ¼ [initial spectrum] g
*[collagen spectrum] until obtaining visually a negligible absorption for the amide contribu-tions. This collagen subtraction resulted in spectra judgedsatisfactory in terms of global appearance as compared with usual FTIR data recorded for synthetic carbonated apatites (seeFig. 2). Notably, the
n
1n
3(PO4) domain was found to be only affected around the base of the absorption band without noticeable alteration of its general shape, thus making it potentially usable for quantification purposes. It may be noted that non-collagenous residues may also be present in biological/fossil specimens, however their amounts remain limited as compared to that of collagen. By analyzing by FTIR the organic residue found after acidic dissolution of the apatite mineral, we confirmed for the samples studied here that collagen was main organic component, and that non-collagenous matter ledto very minor modifications of the 1530e1330 cm1 carbonate
domain (Fig. AR3 in the Additional Resources).
After collagen subtraction, the integrated intensities of the full
n
3(CO3) domain (range 1530e1330 cm1) and of then
3n
1(PO4) band (between 1230 and 890 cm1) were measured as done previously for synthetic samples, allowing us to derive the corresponding rc/p ratios. The application of Equation (1) to these data led to the respective carbonate contents of 4.9 ± 0.5, 3.9 ± 0.5 and 5.7 ± 0.5%, for samples “20th Cent”, “mid-ages”, and “Iron age” (to be compared with 5.1 ± 0.5, 4.1 ± 0.5 and 6.1 ± 0.5). A good agreement is, therefore, found between estimated carbonate contents calcu-lated from Equation(1)and coulometric data for these biological samples. The three datapoints corresponding to these biological specimens have been added to the %CO3 ¼f(rc/p) plot inFig. 4b, which shows graphically that the IR-based methodology described in this paper for the quantification of carbonation of apatite phases is also applicable to skeletal specimens, provided that the vibra-tional contribution of collagen is preliminarily subtracted. 4. Concluding statementsThe question of carbonate quantification in apatitic compounds, whether of synthetic or biological origin, is relevant for many reasons. In synthetic systems, the determination of the level of carbonation allows to draw conclusions relative to the degree of “biomimetism” of the sample, for example, as compared with mature or newly-formed bone matter. The presence of carbonation ions can clearly influence crystallization processes and these ions may also stabilize the non-apatitic surface layer on apatitic nano-crystals. Synthetic carbonated apatites could also serve as reference materials in view of the establishment of calibration curves, for example, in relation to biogenic phosphates that may have been Fig. 5. Example of FTIR spectrum for biological specimen (case of Iron age bone sample) and for collagen (modern bovine bone collagen type I from own collection), and subtraction result (obtained by minimizing the intensity of amide vibrations in the 1930e1230 cm1domain).
formed at various temperatures. In this contribution, we noted the direct effect of synthesis temperature on the level of carbonation and on other parameters such as crystallinity, evidenced on the basis of FTIR spectral analysis. In the case of skeletal specimens, the exploration of the carbonate content is of prime importance for characterizing these samples and drawing conclusions on bio-mineralization, diagenetic evolutions, paleoecology, etc., especially by exploiting13C and18O isotopic responses.
In this contribution, based on FTIR data, we discussed which carbonate and phosphate vibrations bands appear the most appropriate for carbonation quantification. We then developed and tested a quantification methodology based on an area ratio be-tween the
n
3(CO3) band and then
1n
3(PO4) contribution, with inte-gration limits that have been defined. We also checked this methodology quantitatively in comparison with direct coulometry measurements performed both on synthetic reference samples (R2¼0.985) and biological/fossil specimens, pointing out a good overall correlation. The absence of carbonated secondary deposits such as calcite should be verified for fossil specimens, for instance on the basis of XRD and/or IR analyses (e.g. absence of sharp band at 712 cm 1).The obtained relationship, expressed by Equation (1) (wt.% CO3¼28.62*rc/pþ0.0843), is intended to serve in the future for more systematic and comparable studies dedicated to carbonated apatites, whether of synthetic or natural origin.
Acknowledgments
This research was supported in part by the Institute of Ecology and Environment (INEE) and the Institute of Chemistry (INC) of the French National Center for Scientific Research (CNRS).
Appendix A. Supplementary data
Supplementary data related to this article can be found athttp:// dx.doi.org/10.1016/j.jas.2014.05.004.
References
Boskey, A.L., DiCarlo, E., Paschalis, E., West, P., Mendelsohn, R., 2005. Comparison of mineral quality and quantity in iliac crest biopsies from high- and low-turnover osteoporosis: an FT-IR microspectroscopic investigation. Osteoporos. Int. 16 (12), 2031e2038.
Cazalbou, S., Eichert, D., Drouet, C., Combes, C., Rey, C., 2004. Biological minerali-sations based on calcium phosphate. Comptes. Rendus. Palevol. 3 (6e7), 563e572.
Drouet, C., 2013. Apatite formation: why it may not work as planned, and how to conclusively identify apatite compounds. Biomed. Res. Int. 2013, 12http:// dx.doi.org/10.1155/2013/490946. Article ID 490946.
Eichert, D., Drouet, C., Sfihi, H., Rey, C., Combes, C., 2007. Nanocrystalline apatite-based biomaterials: synthesis, processing and characterization. In: Kendall, J.B. (Ed.), Biomaterials Research Advances. Nova Science Publishers, pp. 93e143.
Elliott, J.C., 1994. Structure and Chemistry of the Apatites and Other Calcium Or-thophosphates, vol. 18. Elsevier Science, Amsterdam.
Elliott, J.C., Holcomb, D.W., Young, R.A., 1985. Infrared determination of the degree of substitution of hydroxyl by carbonate ions in human dental enamel. Calcif. Tissue Int. 37 (4), 372e375.
Engleman, E.E., Jackson, L.L., Norton, D.R., 1985. Determination of carbonate carbon in geological materials by coulometric titration. Chem. Geol. 53 (1e2), 125e128.
Featherstone, J.D.B., Pearson, S., Legeros, R.Z., 1984. An infrared method for quan-tification of carbonate in carbonated apatites. Caries Res. 18 (1), 63e66.
Gee, A., Dietz, V.R., 1953. Determination of phosphate by differential spectropho-tometry. Ann. Chem. 25, 1320e1324.
Gomez-Morales, J., Iafisco, M., Manuel Delgado-Lopez, J., Sarda, S., Drouet, C., 2013. Progress on the preparation of nanocrystalline apatites and surface character-ization: overview of fundamental and applied aspects. Prog. Cryst. Growth Charact. Mater. 59 (1), 1e46.
Grunenwald, A., Keyser, C., Sautereau, A.M., Crubezy, E., Ludes, B., Drouet, C., 2014. Adsorption of DNA on biomimetic apatites: toward the understanding of the role of bone and tooth mineral on the preservation of ancient DNA. Appl. Surf. Sci. 292, 867e875.
Huffman, E.W.D., 1977. Performance of a new automatic carbon-dioxide coulometer. Microchem. J. 22 (4), 567e573.
Kimura-Suda, H., Kajiwara, M., Matsumoto, N., Murayama, H., Yamato, H., 2009. Characterization of apatite and collagen in bone with FTIR imaging. Mol. Cryst. Liq. Cryst. 505, 302e307.
Kohn, M.J., Schoeninger, M.J., Barker, W.W., 1999. Altered states: effects of diagen-esis on fossil tooth chemistry. Geochim. Et. Cosmochim. Acta 63 (18), 2737e2747.
Kohn, M.J., Schoeninger, M.J., Valley, J.W., 1996. Herbivore tooth oxygen isotope compositions: effects of diet and physiology. Geochim. Et. Cosmochim. Acta 60 (20), 3889e3896.
Landis, W.J., Hodgens, K.J., Arena, J., Song, M.J., McEwen, B.F., 1996. Structural re-lations between collagen and mineral in bone as determined by high voltage electron microscopic tomography. Microsc. Res. Tech. 33 (2), 192e202.
Lebon, M., Müller, K., Bellot-Gurlet, L., Paris, C., Reiche, I., 2011. Application des micro-spectrometries infrarouge et Raman a l’etude des processus dia-genetiques alterant les ossements paleolithiques. ArcheoSciences 35, 179e190.
Lecuyer, C., Balter, V., Martineau, F., Fourel, F., Bernard, A., Amiot, R., Gardien, V., Otero, O., Legendre, S., Panczer, G., Simon, L., Martini, R., 2010. Oxygen isotope fractionation between apatite-bound carbonate and water determined from controlled experiments with synthetic apatites precipitated at 10-37 degrees C. Geochim. Et. Cosmochim. Acta 74 (7), 2072e2081.
Legros, R., Balmain, N., Bonel, G., 1987. Age-related changes in mineral of rat and bovine cortical bone. Calcif. Tissue Int. 41 (3), 137e144.
McElderry, J.D.P., Zhu, P.Z., Mroue, K.H., Xu, J.D., Pavan, B., Fang, M., Zhao, G.S., McNerny, E., Kohn, D.H., Franceschi, R.T., Holl, M.M.B., Tecklenburg, M.M.J., Ramamoorthy, A., Morris, M.D., 2013. Crystallinity and compositional changes in carbonated apatites: evidence from P-31 solid-state NMR, Raman, and AFM analysis. J. Solid State Chem. 206, 192e198.
Pasteris, J.D., Yoder, C.H., Wopenka, B., 2014. Molecular water in nominally unhy-drated carbonated hydroxylapatite: the key to a better understanding of bone mineral. Am. Mineralogist 99 (1), 16e27.
Pellegrino, E.D., Biltz, R.M., 1972. Mineralization in the chick embryo. I. Mono-hydrogen phosphate and carbonate relationships during maturation of the bone crystal complex. Calcif. Tissue Res. 10 (2), 128e135.
Price, T.D., Schoeninger, M.J., Armelagos, G.J., 1985. Bone chemistry and past behavior e an overview. J. Hum. Evol. 14 (5), 419e447.
Puceat, E., Reynard, B., Lecuyer, C., 2004. Can crystallinity be used to determine the degree of chemical alteration of biogenic apatites? Chem. Geol. 205 (1e2), 83e97.
Rey, C., Collins, B., Goehl, T., Dickson, I.R., Glimcher, M.J., 1989. The carbonate environment in bone-mineral e a resolution enhanced Fourier-Transform Infrared-Spectroscopy study. Calcif. Tissue Int. 45 (3), 157e164.
Rey, C., Combes, C., Christophe, D., Grossin, D., 2011. Bioactive ceramics: physical chemistry. In: Ducheyne, P., Healy, K.E., Hutmacher, D.W., Grainger, D.W., Kirkpatrick, C.J. (Eds.), Comprehensive Biomaterials. Elsevier, pp. 187e221.
Roche, D., Segalen, L., Balan, E., Delattre, S., 2010. Preservation assessment of MioceneePliocene tooth enamel from Tugen Hills (Kenyan Rift Valley) through FTIR, chemical and stable-isotope analyses. J. Archaeol. Sci. 37 (7), 1690e1699.
Shemesh, A., 1990. Crystallinity and diagenesis of sedimentary apatites. Geochim. Cosmochim. Acta 54 (9), 2433e2438.
Shimoda, S., Aoba, T., Moreno, E.C., Miake, Y., 1990. Effect of solution composition on morphological and structural features of carbonated calcium apatites. J. Dent. Res. 69 (11), 1731e1740.
Sosa, C., Vispe, E., Nunez, C., Baeta, M., Casalod, Y., Bolea, M., Hedges, R.E.M., Martinez-Jarreta, B., 2013. Association between ancient bone preservation and DNA Yield: a multidisciplinary approach. Am. J. Phys. Anthropol. 151 (1), 102e109.
Sponheimer, M., Lee-Thorp, J.A., 2001. The oxygen isotope composition of mammalian enamel carbonate from Morea Estate, South Africa. Oecologia 126 (2), 153e157.
Suarez, C., Kohn, M., 2011. Does carbonate content of biogenic apatite correlate with body temperature? J. Vertebrate Paleontol. 31, 201e201.
Termine, J.D., Posner, A.S., 1966. Infra-ref determination of the percentage of crys-tallinity in apatitic calcium phosphates. Nature 211, 268e270.
Thompson, T.J.U., Islam, M., Piduru, K., Marcel, A., 2011. An investigation into the internal and external variables acting on crystallinity index using Fourier Transform Infrared Spectroscopy on unaltered and burned bone. Palaeogeogr. Palaeoclimatol. Palaeoecol. 299 (1e2), 168e174.
Trueman, C.N., Privat, K., Field, J., 2008. Why do crystallinity values fail to predict the extent of diagenetic alteration of bone mineral? Palaeogeogr. Palae-oclimatol. Palaeoecol. 266 (3e4), 160e167.
Tütken, T., Vennemann, T.W., 2011. Fossil bones and teeth: preservation or alter-ation of biogenic compositions? Palaeogeogr. Palaeoclimatol. Palaeoecol. 310 (1e2), 1e8.
Vandecandelaere, N., Rey, C., Drouet, C., 2012. Biomimetic apatite-based bio-materials: on the critical impact of synthesis and post-synthesis parameters. J. Mater. Sci. Mater. Med. 23 (11), 2593e2606.
Weiner, S., Bar-Yosef, O., 1990. States of preservation of bones from prehistoric sites in the near east: a survey. J. Archaeol. Sci. 17 (2), 187e196.
Weiner, S., Wagner, H.D., 1998. The material bone: structure mechanical function relations. Annu. Rev. Mater. Sci. 28, 271e298.