HAL Id: hal-01652385
https://hal.archives-ouvertes.fr/hal-01652385
Submitted on 15 Mar 2019
HAL is a multi-disciplinary open access
archive for the deposit and dissemination of
sci-entific research documents, whether they are
pub-lished or not. The documents may come from
teaching and research institutions in France or
abroad, or from public or private research centers.
L’archive ouverte pluridisciplinaire HAL, est
destinée au dépôt et à la diffusion de documents
scientifiques de niveau recherche, publiés ou non,
émanant des établissements d’enseignement et de
recherche français ou étrangers, des laboratoires
publics ou privés.
Interrupted shear of granular media
Alain de Ryck, Rodrigo Condotta, M Lubert
To cite this version:
Alain de Ryck, Rodrigo Condotta, M Lubert. Interrupted shear of granular media. European
Phys-ical Journal E: Soft matter and biologPhys-ical physics, EDP Sciences: EPJ, 2003, 11 (2), pp.159-167.
�10.1140/epje/i2002-10153-6�. �hal-01652385�
Interrupted shear of granular media
A. de Ryck1,a, R. Condotta1, and M. Lubert21 Laboratoire de g´enie des proc´ed´es des solides divis´es, UMR 2392 du CNRS, ´Ecole des Mines d’Albi-Carmaux, route de Teillet, 81013 Albi cedex 09, France
2 Centre Sciences des Processus Industriels et Naturels - ´Ecole Nationale Sup´erieure des Mines de Saint-´Etienne, 158 cours Fauriel, 42023 Saint-´Etienne cedex 2, France
Abstract. The response of a granular material during a stop-and-go shear experiment is investigated using an annular shear cell and silicagel powders of different particle sizes. The experimental results are examined on the basis of the Dieterich-Rice-Ruina model for solid friction. In addition to making this analogy with solid friction, we describe a new instability that is observed when restarting shear, where the powder bed is found to slip and compact for short hold times but only dilates for long hold times. The minimum hold time to restore a non-slip behaviour has been investigated for different size particles and normal loadings. The observed dependencies show analogies between this behaviour and the sliding rearrangements seen above the stick-slip threshold.
PACS. 83.80.Fg Granular solids – 45.70.-n Granular systems
1 Introduction
The mechanical resistance of bulk solids to flow and its temporal evolution is an important topic for the correct handling and storage of these materials. At low shear rates, and for non-cohesive powders, the behaviour observed is similar to solid friction where the shear stress τ necessary to make the powder move is proportional to the normal stress σ. However, the internal coefficient of friction, µ = τ/σ, is not single-valued since, the coefficient of friction to start the flow µsis greater than the dynamic
coefficient of friction µd, necessary to maintain the sliding
at constant velocity. Stop-and-go shear experiments at constant normal loading may demonstrate such be-haviour [1]. These consist in interrupting the sliding for a hold time T before restarting shear. The shear stress then goes through a maximum, which increases logarithmically with the hold time.
In solid friction, the first physical explanation for this ageing is the plastic creep of the contact points between the two surfaces (due to the increase of the real area of contact and to the ageing of the adhesive junction at in-terface). Some recent experiments using polymer glasses at temperatures up to the glass transition temperature confirm these hypotheses [2,3]. A second origin is the con-densation of humidity, which leads also to a logarithmic strengthening with time [4,5]. In this case, ageing should
a e-mail: [email protected]
vanish in dry air, which is what Dieterich and Conrad have observed in rock friction [6].
These two mechanisms also apply in granular friction. But, in this case, there is a third possibility where fric-tion can be changed by small rearrangements between the grains during the creep phase. These rearrangements have been observed numerically in loading experiments [7,8] and shown experimentally by direct imaging in a 2D gran-ular assembly [9].
Here, we present some experimental results of stop-and-go shear experiments for non-cohesive silicagel pow-ders, showing not only this strengthening but also a new temporal behaviour, not previously reported in the case of solid-solid friction. In Section 2, some results of the phenomenological model of solid friction developed by Di-eterich, Rice and Ruina [10,11] are introduced in order to present the granular-friction results given in this paper. In Section 3, the experimental set-up and granular mate-rials are presented. In Section 4, the mechanical response of these granular materials during steady-state shear ex-periments is detailed. Finally, Section 5 describes and dis-cusses the stop-and-go shear experiments.
2 Theoretical background
2.1 The Dieterich-Rice-Ruina model
Logarithmic ageing is embedded in the phenomenolog-ical state-and-rate model formulated by Dieterich, Rice
and Ruina to describe rock-rock friction. This model has been developed from the following experimental evidences: a) The steady-state sliding coefficient of friction decreases logarithmically with the sliding velocity V for numerous materials. b) The static coefficient of friction increases log-arithmically with the contact time between the two solid bodies. c) When a jump is imposed in the driving velocity, the friction force relaxes to its new value over a charac-teristic distance D, which is of the order of a micrometer. The Dieterich-Rice-Ruina model can be written as [10,11]
µ = µ0+ a ln V V0 + b lnV0φ D , (1) with dφ dt = 1 − V φ D , (2)
where µ0 is the steady-state coefficient of friction at the
sliding velocity V0. a and b are two numerical constants
which depend on the material. φ is the age of the contact. Its evolution is given by equation (2): If there is no sliding, dφ/dt = 1 and φ = t. For steady-state sliding, we have φs= D/V and µs= µ0+ (a − b) ln(V/V0).
2.2 Dynamics on an axisymmetric geometry
Disregarding inertia, the equilibrium of a frictional annu-lus of internal and external radii Ri and Ro entrained by
an elastic motor at the rotational velocity ω reduces to 2πσ
Ro
!
Ri
µr2dr = Γ α , (3) where r is the radial co-ordinate. Γ α is the torque de-veloped by the spring of which the angular deformation is α and the elastic constant is Γ . In practical cases, the elasticity comes from the elasticity of the drive motor and the elastic contacts between the two surfaces. This elas-ticity has a feedback on the friction force since the latter depends on the sliding velocity. We have
V = r(ω− dα/dt) . (4)
2.2.1 Onset of instability
If the sliding velocity is taken to be constant at the shear plane (Ro/Ri → 1), a linear stability analysis of the
sys-tem (Eqs. (1) to (4)) shows that it becomes unstable in the case of a velocity weakening force (b > a) when the normal stress σ is higher than the threshold value:
σ1= D b− aΓ 3 π (Ro+ Ri) (R3o− Ri3) . (5) At this threshold, the system oscillates with a pulsa-tion Ω1= ωRo2D+Ri
"
1 − a/b [12].
More generally, taking into account the radial depen-dency of the sliding velocity leads to a threshold value
Fig. 1. Percentage relative difference between the normal stress at the onset of instability in an annular cell and the onset of instability in a linear geometry (continuous lines) for two ratios of outer to inner radii. Same percentage relative difference for the pulsation at the onset (dotted lines).
σℓ, which depends both on the ratio a/b and on the ratio
Ro/Ri. Figure 1 gives the correction in percentage
be-tween σℓ and σ1 and for the pulsation Ωℓ. It can been
concluded from this figure that the hypothesis of constant sliding velocity remains a good approximation for radii ratios Ro/Ri up to 2, or when the coefficient a is close to
b. When not mentioned, the coefficient of friction will be considered as constant in the shear plane and evaluated from the expression 3Γ α/2πσ(R3
o− Ri3).
2.2.2 Creep relaxation
If the motor is stopped from a steady-state regime (α = αs
and φ = φsare constant) at t = 0, the angle α decreases to
insure the continuity of the sliding velocity. We then have dα/dt(t = 0+) = −ω and dφ/dt(t = 0) = 0. (The conti-nuity of the latter is due to Eq. (2).) The time derivative of equation (3): 2πσ Ro ! Ri # a d2α dt2 dα dt + b dφ dt φ $ r2dr = Γdα dt (6) reduces to d2α dt2 ∼ 3Γ 2πσ(R3 o− Ri3)a %dα dt &2 (7) at the beginning of the relaxation. Equation (7) means that the coefficient of friction decreases logarithmically like
µ− µs= −a ln(1 + t/t0) , (8)
with t0= 2πσ(R3o− R3i)a/3Γ ω.
2.2.3 Resuming shear
After a creep period of duration T , the shear driving motor is restarted. This leads to an increase of the shear force,
Fig. 2. Sketch of the experimental set-up.
which goes through a maximum before attaining a plateau value corresponding to the steady-state regime. At the maximum, dα/dt = 0 and equation (3) reduces to
2πσb! Ro Ri r2ln% rωφ D & dr = Γ (αmax− αs) , (9)
where Γ αmax and Γ αs are, respectively, the maximum
shear torque and the torque at steady state. Since the maximum occurs just at the beginning of the resuming, we have φ ≈ T and equation (9) leads to a logarithmic increase of the maximum friction coefficient with the du-ration of creep:
µmax− µs∝ b ln T . (10)
The coefficients a and b are then separately measurable by a series of stop-and-go shear experiments, as described in the following paragraph.
3 Experimental set-up
3.1 The shear cell
The experimental set-up is shown in Figure 2 and de-scribed in detail in [12]. The powder is poured inside an annulus of internal and external radii, respectively 5 and 10 cm and height H = 4 cm. A smaller cell was also used, whose dimensions are all reduced by a factor λ = 3/5. Both cells have a radii ratio of 2 and then, considering the conclusion of Section 1.2, the coefficient of friction will be considered constant on the shear plane.
Shear loading
This annulus is put into rotation by a motor at a rotational velocity ω = 3 · 10−4 rad/s. A cover plate with 20 teeth
(12 for the small cell) of 4 mm height, is placed on the powder surface. This cover plate is loaded by weights and held against rotation by two force transducers (at L = 12.5 cm from the axis of rotation), which measure the force F = Γ α/2L induced by the shear torque due to
the friction between the particles. The friction measured is due to the fact that the powder gets trapped between the teeth of the cover plate, while the powder below is entrained by the rotation of the annulus. A gap between the cover and the annulus prevents friction between them but has the consequence of allowing extrusion of powder during the shear. The powder is also sheared in this gap, but the contribution to the measured torque is negligible, since, on the one hand, the surface times the lever arm is 15% lower than that developed by the base and, on the other hand, the normal loading on the side is expected to be lower than that exerted on the cover plate.
Normal loading
The cover plate is loaded by a weight M placed on a rod hooked on the cover plate. Since the cover plate and the rod are counter-weighted (not represented in Fig. 2 for clarity), the normal stress acting on the shear plane is σ = (M + Mp)g/π(R2o− R2i), where Mp is the mass of
the powder between the teeth (of order 50 g) and g is the acceleration due to gravity.
An inductive transducer measures the vertical dis-placement h of the cover plate caused by dilatancy of the powder sample and the extrusion. All the experiments are performed in ambient air.
3.2 The powders
The powders used are nanoporous silicagel (mean diame-ter of the pores: 60 ˚A) which have been ground and sieved (Fig. 3a). This material absorbs humidity well which en-sures that the mechanical properties are insensitive to air humidity and no electrostatic effects are present when they are handled in ambient atmosphere. Two particle size cuts of similar size spread in logarithmic coordinates have been used: 5 to 20 µm and 60 to 200 µm as measured in ethanol suspension with a Malvern Mastersizer laser diffraction in-strument (Fig. 3b). The finer powder is slightly cohesive. Thus, after a series of shear experiments, the powder re-mains as a block inside the annular cell which may be attributed to the fact that the van der Waals forces be-tween particles are of the same order of magnitude as their weight. The coarser particle size cut is a free-flowing pow-der. Figure 4 shows the averaged shear stress in steady sliding versus the constant normal stress. The data, ob-tained at a rotation rate ω = 3 · 10−4 rad/s, follow the
same line for both cell sizes and particle sizes, which is fitted by µ = τ/σ = 0.68 ± 0.03.
4 Constant rate shear experiments
In permanent shearing, these powders present a stick-slip instability when the normal loading overcomes a threshold value. This instability has been extensively studied in [12] with the same silicagel sieved between 40 and 63 µm and also by Gollub and co-workers [13]. This is illustrated here
Fig. 3. a) SEM images of the silicagels used. Left: 5–20 µm. Right: 60–200 µm. b) Cumulative size distribution of the silicagels used as obtained by laser diffraction in ethanol.
Fig. 4. Mean shear stress in steady sliding versus the nor-mal stress. Open symbols: 60–200 µm silicagel. Solid symbols: 5–20 µm silicagel. Squares: annular shear cell of 5 to 10 cm radii. Circles: smaller cell of 3 to 6 cm radii.
by Figure 5 for the case of the 60–200 µm silicagel in the big cell. The onset of the stick-slip instability, with the occurrence of a small sinusoidal modulation of the shear stress, occurs for a critical loading mass Mc close
to 4 kg. When the loading mass is increased further, the amplitude of the oscillations increases. For a loading mass of M∗ = 6 kg or above, we observe a second instability
where huge sliding occurs, leading to a reorganisation of the grains with a packing-down of several microns. This loss of height is recovered during the stick phase (Fig. 5). The stick-slip instability and the sliding instability, presented in Figure 5, are also observed for different par-ticle sizes and/or cell sizes, as described, respectively, in the next two sections.
Fig. 5. Shear at constant rotational velocity (ω = 3 · 10−4 rad/s) of a 60–200 µm silicagel powder with a normal load of 4 and 6 kg in the annular shear cell of 5 to 10 cm radii. Two upper curves: shear stress versus time. Two lower curves: height of the granular bed versus time.
4.1 Steady-state shearing and the onset of the stick-slip instability
Figure 6 shows the root mean-square deviation of the shear force versus the normal load M for the 5–20 and 60–200 µm silicagel (black and white points, respectively) and the small and big cells (circle and square points, re-spectively). Figure 7 shows the same data expressed as a percentage of the mean force.
At low normal load, the fluctuations of the shear force are proportional to the normal force (dashed lines in Fig. 6) and independent of the geometry. These fluctu-ations are greater for the coarser grains by a factor 3.3, which is close to the square root of the size ratio between the two size distributions. The origin of these fluctuations
Fig. 6. Fluctuations of the shear force versus the loading mass. Open symbols: 60–200 µm silicagel. Solid symbols: 5–20 µm silicagel. Squares: annular shear cell of 5 to 10 cm radii. Cir-cles: smaller cell of 3 to 6 cm radii. Dashed lines: indication of slope 1. The vertical arrows point to the onset of stick-slip instability (Mc= 4 kg for the annular cell of 5 to 10 cm radii; Mc= 12 kg for the annular cell of 3 to 6 cm radii). The horizon-tal arrow points to the limit of sensitivity of the force sensors.
has not been studied and will be examined in a further investigation.
The onset Mc is then determined at the departure of
this linear regime. This threshold value is independent of the size of the particles, to within the precision of the measurements. However, it depends on the cell size: Mc ≈
4 kg for the big cell (open and solid squares in Fig. 6) and Mc≈ 12 kg for the small cell (open and solid circles). This
size dependency is in accordance with equation (5), which predicts that the mass threshold scales with the inverse square of the size cell.
4.2 Sliding instability
On increasing the loading mass past the onset of the stick-slip instability, we reach the second instability where huge rearrangements (sliding) occur. This behaviour is size de-pendent. In Figure 7, the experiments corresponding to the points above the dashed line present sliding. The mass thresholds M∗ to obtain this huge sliding corresponds to
the same amplitude of variation δµ∗ ≈ 1.4 · 10−3 of the
coefficient of friction for both sizes of grain and both sizes of cell.
A qualitative explanation for this second instability, given in [12], is that the rearrangements occur as soon as the sliding velocity exceeds a critical value. This point has been checked by evaluating the maximum of the sliding rotational velocity ω∗
maxat the threshold M = M∗for each
series of experiments. Assuming sinusoidal oscillations it can be expressed as ωmax∗ = ω + 2M∗g'R3 o− R3i ( 3Γ∗(R2 o− R2i) δµ∗Ω∗. (11)
Fig. 7. Amplitude of the fluctuations of the coefficient of fric-tion expressed as a percentage, versus the loading mass. Open symbols: 60–200 µm silicagel. Solid symbols: 5–20 µm silicagel. Squares: annular shear cell of 5 to 10 cm radii. Circles: smaller cell of 3 to 6 cm radii. The dashed line indicates the slippage threshold. The vertical arrows point to the onset of stick-slip instability (Mc= 4 kg for the annular cell of 5 to 10 cm radii; Mc= 12 kg for the annular cell of 3 to 6 cm radii).
Here Γ∗ and Ω∗ are the apparent elastic torque
con-stant and the pulsation of the oscillations at threshold. Γ has been determined using the slope observed when restarting shear after a period of rest (as presented in the next paragraph). As in a previous study with a 40–63 µm silicagel [12], it is found that the sliding instability occurs when the sliding rotational velocity reaches a same critical value of 4.7 ± 0.6 · 10−4 rad/s.
This sliding instability is the ultimate permanent shearing regime observed. When the loading mass M is much higher than M∗, the powder bed reacts as a regular
succession of stick phases and sliding phases.
5 Stop-and-go shear experiments
We now focus on the description of the force response to an interruption followed by a restarting of the shear. Figure 8 shows an experimental time recording of the shear stress τ and sample height h in the case of the coarse particles. In this experiment, the rotation rate is ω = 3 · 10−4rad/s
for t < 0 s (region I), and is stopped between t = 0 s and t = 65 s (ω = 0 rad/s; region II) and set again to ω = 3· 10−4 rad/s for t! 65 s (region III).
The region I is the permanent regime. The shear stress oscillates around 5.85 kPa. In this regime, the height of the sample decreases linearly with time by 0.12 ± 0.01 µm/s due to the extrusion of the particles past the cover.
During the hold time (region II), it can be observed that there is a creep response, and a peak in the shear stress curve when starting the shear rotation again (be-ginning of region III). These two effects are successively described in the two next paragraphs.
Fig. 8. Simultaneous recording of the shear stress (lower curve) and height of the granular bed (upper curve) during a stop-and-go experiment of hold duration T = 65 s. The experiment is performed with the 60–200 µm silicagel and a load mass of 5 kg (2.2 kPa). In regions I and III, ω = 3· 10−4rad/s. In region II, ω = 0 rad/s. Circles: fit of the creep with equation (8). The slope indicated in region I is the extrusion observed during permanent shear at ω = 3· 10−4rad/s.
Fig. 9. Coefficient a versus the load mass. Open symbols: 60–200 µm silicagel. Solid symbols: 5–20 µm silicagel. Squares: annular shear cell of 5 to 10 cm radii. Circles: smaller cell of 3 to 6 cm radii.
5.1 Creep during stop
During the hold time, the shear stress and the height of the powder bed decrease. This relaxation is logarithmic and the time and the coefficient of friction may be fitted by equation (8). Such a fit is shown in Figure 8 as a curve made of circles. It leads to a value of the coefficient a which is found to be of the order of 10−2, as in solid friction [1].
Furthermore this value appears to be slightly dependent on the loading mass, as can be observed in Figure 9, which includes the values extracted by the fit for different normal loads. The white points are for the fine particles (5–20 µm) and the black points for coarse particles (63–200 µm) for both cell sizes.
Fig. 10. Coefficient a versus the load mass for the 5–20 µm silicagel. Crossed circles: experiments performed by increasing the load mass from 100 g to 30 kg. Solid symbols: same points as in Figure 9, obtained by decreasing the load mass from 30 kg to 100 g.
The measurement of a for the fine powder (5–20 µm) is less easy since, as illustrated in Figure 10, the coefficient is less the denser is the powder. In this figure, the upper points have been obtained by increasing the loading mass and the lower points have been obtained by decreasing the loading mass after a 12-hour hold at M = 30 kg. The coefficient a measured in the dense state is similar to the one measured with the coarser powder (Fig. 9).
These experimental observations suggest that a, the coefficient of logarithmic dependence of the coefficient of friction with the sliding velocity, is a function of the pack-ing fraction of the powder. For large particles, the particle bed quickly attains its state of maximal packing fraction and the relaxation response is unique. For the fine pow-der, the kinetics of rearrangements to attain the maximal packing fraction are slower and it is possible to observe the relaxation response of a loose sample.
The other point is that a depends on the loading mass M , and not on the normal stress σ. This feature is in accordance with the Da Vinci-Amontons observation that the friction force is independent of the apparent area of contact.
5.2 Resuming shear 5.2.1 The increase
When the rotation of the lower part at the angular velocity ω is restarted, we observe a linear increase in the shear torque (beginning of region III in Figure 8; a detailed view of that region is shown in Fig. 13a below). The slope gives the apparent elasticity Γ of the system which appears to be dependent on the loading mass. This is illustrated in Figure 11, which includes the experimental results for the two particle size cuts and the two cell sizes. This elasticity
Fig. 11. Elastic torque constant Γ versus the load mass. Open symbols: 60–200 µm silicagel. Solid symbols: 5–20 µm silicagel. Squares: annular shear cell of 5 to 10 cm radii. Circles: smaller cell of 3 to 6 cm radii. The two bars scale, respectively, the λ2 and λ3ratio of the surface and bulk term in equation (12), which should be respected, between the two cells.
has three origins and can be written as 1 Γ = 1 Γapparatus + 1 Γbulk + 1 Γsurface . (12) Here the contribution of the apparatus does not de-pend on the loading mass. Γbulk = µLam´eπ(R4o− R4i)/2H
is the elastic contribution of the whole assembly of parti-cles whose apparent shear modulus µLam´emay depend on
the loading. This term scales with λ3, where λ is the ratio
between the linear size of the big and the small cell. λ = 3/5 in these experiments. Since the elastic torque is mea-sured after a shear and relaxation experiment, we expect that a shear zone has been created, leading to a surface contribution for the elasticity: Γsurface = kπ(R2o − R2i),
where the stiffness k depends on the loading. This surface term scales with λ2. From Figure 11, we deduce (from
the ratio between the measures with the big and small cells) that the surface term is predominant and grows with M1/2. This square-root dependency is different from the linear relationship predicted and observed in solid fric-tion [14], different from the M1/3 prediction for Hertzian
contact, but similar to the shear-modulus–normal-force dependency observed in bulk materials [15]. Various in-terpretations for this M1/2 have been proposed [16,17].
5.2.2 The peak
The linear increase of the shear force when restarting the flow ends with a peak of force before attaining the plateau value, as in solid friction. This maximum of force increases logarithmically with the time of creep T as in equation (10) (see insert in Fig. 12). It is in accordance with other experimental observations [18,19] which found that this logarithmic increase vanishes if the shear stress
Fig. 12. Coefficient b versus the load mass, measured using the annular cell of 5 to 10 cm radii. Open symbols: 60–200 µm silicagel. Solid symbols: 5–20 µm silicagel. Insert: maximum of the coefficient of friction versus the hold time for the 60– 200 µm silicagel with M = 500 g.
is not applied during the waiting time. The experimen-tal coefficient b is plotted in Figure 12 versus the loading mass. We observe that b has the same mass dependency as does a and does not depend on the particle size of the silicagel.
Comparing Figures 10 and 12 suggests that, for the 5–20 µm powder in the loose state, the coefficient a is greater than b, so there is no stick-slip. This is corrobo-rated by the experimental observations. After filling the cell and beginning the shear at high normal load, there is a waiting time before the occurrence of the stick-slip os-cillations. The powder bed compacts and a diminishes till the onset of instability given by equation (5) is attained.
With this last measurement, and using the stick-slip onset of instability (Eq. (5)), we find that the characteris-tic length of the Dieterich-Rice-Ruina model is D = 0.6 ± 0.3 µm for the 5–20 and 60–200 µm silicagel. This length is similar to that previously observed for a 40–63 µm sil-icagel [12] and similar to the D lengths reported for solid friction [1]. This indicates that the particles do not play the role of roughness in solid friction. There remains to in-vestigate the behaviour of a sub-micronic silicagel powder, whose size is less than D.
5.2.3 The instability
When restarting the flow with these silicagel powders, we notice a new instability not observed in solid friction. The granular bed slips and compacts when the hold time is lower than a critical value T∗. This phenomenon is
illus-trated by Figure 13a for a 60–200 µm silicagel powder sheared in the cell of 5 to 10 cm with M = 5 kg. For hold times T below 1 min, there is a slip which decreases the coefficient of friction by 0.15. This slip disappears for hold times greater than 1 min.
These slip events look like the sliding observed dur-ing permanent sheardur-ing at loaddur-ing M > M∗. They are
Fig. 13. a) Peak of friction after a period of rest ranging from 1 s to 18 h. The dashed line gives the slope corresponding to a sliding velocity of 4.7· 10−4 rad/s. b) Height of the powder bed for the experiments of Figure 5b. The zero level is set at the beginning of the resumption of shear.
associated with a settling of the powder bed (Fig. 13b), which is recovered after 5 s of shear (see upper curve in Fig. 8), that is after 100 ± 25 µm of tangential displace-ment. If the hold time T is greater than T∗, the powder
sample dilates during the resumption of shear and recovers the height lost during the creep.
This critical time T∗ increases with the normal
load-ing and depends on the cell size and the particle sizes, as shown in Figure 14. For the same normal loading, T∗
is lower in the smaller cell for the two particle sizes. T∗
also depends on the size of the particles. In this case, the tendency is less clear since for the big cell (5 to 10 cm diameters) the smaller particles lead to smaller T∗ values,
and the contrary for the small cell (3 to 6 cm diameters). However, Figure 14, which displays the mass depen-dency of T∗, can be seen to be quite similar to Figure 2,
which displays the mass dependency of δµ. This empha-sises the fact that the hold time T∗ necessary to avoid
sliding, increases sharply when the loading approaches this onset of sliding instability. To be more precise, the data of Figure 14 have been plotted in Figure 15 versus the reduced load mass M/M∗. The data then collapse into
two curves, depending on the particle size. Such a collapse does not occur when the load mass is rescaled by Mc, the
mass at the onset of shear instability. A link between the
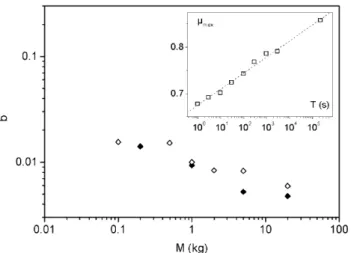
Fig. 14. Minimal hold time to avoid the sliding instability when resuming the shear versus the loading mass. Open sym-bols: 60–200 µm silicagel. Solid symsym-bols: 5–20 µm silicagel. Squares: annular shear cell of 5 to 10 cm radii. Circles: smaller cell of 3 to 6 cm radii.
Fig. 15. Minimal hold time to avoid the sliding instability when resuming the shear versus the loading mass M divided by M∗. Open symbols: 60–200 µm silicagel. Solid symbols: 5– 20 µm silicagel. Squares: annular shear cell of 5 to 10 cm radii. Circles: smaller cell of 3 to 6 cm radii.
two sliding instabilities —one occurring when the loading mass overcomes a critical value (M > M∗), the other one
when restarting a shear flow after a short period of rest (T < T∗)— is thus demonstrated.
This correlation between the two sliding instabilities may come from the fact that both occur when the sliding velocity exceeds a critical value. In Figure 13a, the dashed line gives the slope of the temporal µ curve corresponding to the rotational sliding velocity of 4.7 · 10−4 rad/s
lead-ing to the slidlead-ing instability in permanent shearlead-ing exper-iments. We observe in this figure that the longer is the hold time, the lower is the sliding velocity after the peak of friction. This behaviour, confirmed by the other experi-ments, awaits explanation since the numerical simulations of hold experiments using the Dieterich-Rice-Ruina model lead to the opposite conclusion.
The other remaining issue is to explain why T∗
di-verges at a lower value of the reduced mass M/M∗ for
the finer powder. A plausible hypothesis is that the tex-ture acquired by the shear band is different for the two powders due to the inter-particles forces. These can be considered to be negligible for the coarser particles, but sufficient to induce rearrangements for the finer particles. When removing the cover plate after experiments with the fine powder, a sharp shear zone is observed between two blocks that act like a solid. It is not feasible to access the shear zone for the free-flowing coarser particles; investiga-tion and confirmainvestiga-tion of the hypothesis may best be made by numerical simulations.
6 Conclusion
The friction behaviour of silicagel powders of different par-ticle sizes has been experimentally investigated in an an-nular shear cell, of inner and outer size ratio equal to 2, and thus small enough to allow this device to be consid-ered as being analogue to a linear shear cell. The results may be arranged into two categories.
Size-independent behaviour
These results may be described on the basis of the Dieterich-Rice-Ruina model for solid friction. The coef-ficient a of logarithmic variation of the friction coefficient with the sliding velocity and the coefficient b of logarith-mic variation of the friction coefficient with the ageing time are found to be of the same order of magnitude as in solid friction. They both have very a slight dependence on the normal loading force, which has not been reported for solid friction. Another difference with solid friction is that the creep response depends on the packing fraction of the granular media.
The other characteristic measured is the apparent shear elasticity of this granular media, which appears to be a surface and not a bulk shear elasticity, with a square-root dependency on the normal load.
These results well fit the onset of stick-slip instability observed with these particles, for a renewal length of the population of contacts D of order a micron. This leads to the conclusion that this microscopic length scale is inde-pendent of the size of the particles, at least when their size is greater than D.
Size-dependent behaviour
Beyond these analogies, we have demonstrated a sliding instability which takes place after a short-time creep pe-riod. This behaviour is compared with the sliding instabil-ity observed in the permanent shearing regime for normal loading high enough to ensure the stick-slip instability. In both cases, the sliding occurs when the sliding velocity exceeds a critical value. Contrarily to the onset of insta-bility, this behaviour is size dependent. More theoretical investigation is now needed to identify the origin of this rate-dependent instability and to build a granular friction model accounting for this behaviour.
We thank Julien Robert, student from the IUT of Nancy for his precious help in the experiments, John A. Dodds, Pierre Labourt-Ibarre and Rhodia for their constant interest and fi-nancial support.
References
1. C. Marone, Annu. Rev. Earth Planet Sci. 26, 643 (1998). 2. P. Berthoud, T. Baumberger, Europhys. Lett. 41, 617
(1998).
3. L. Bureau, T. Baumberger, C. Caroli, Phys. Rev. E 64, 031502 (2001).
4. L. Bocquet, ´E. Charlaix, S. Ciliberto, J. Crassous, Nature 396, 735 (1998).
5. N. Fraysse, H. Thom´e, L. Petit, Eur. Phys. J. B 11, 615 (1999).
6. J. Dieterich, G. Conrad, J. Geophys. Res. 89, 4196 (1984). 7. G. Combe, J.-N. Roux, Phys. Rev. Lett. 85, 3628 (2000). 8. L. Staron, J.-P. Vilotte, F. Radjai, Phys. Rev. Lett. 89,
204302 (2002).
9. O. Dauchot, unpublished.
10. J. Dieterich, J. Geophys. Res. 84, 2161 (1979). 11. J.R. Rice, A.L. Ruina, J. Appl. Mech. 50, 343 (1983). 12. M. Lubert, A. de Ryck, Phys. Rev. E 63, 021502 (2001). 13. S. Nasuno, A. Kudrolli, A. Bak, J.P. Gollub, Phys. Rev. E
58, 2161 (1998).
14. P. Berthoud, T. Baumberger, Proc. R. Soc. London, Ser. A 454, 1615 (1998).
15. J. Duffy, R.D. Mindlin, J. Appl. Mech. 24, 585 (1957). 16. J. Goddart, Proc. R. Soc. London, Ser. A 430, 105 (1990). 17. P.-G. de Gennes, Europhys. Lett. 35, 145 (1996).
18. W. Losert, J.-C. G´eminard, S. Nasuno, J.P. Gollub, Phys. Rev. E 61, 4060 (2000).
19. M. Lubert, A. de Ryck, J.A. Dodds, in Handbook of Pow-der Technology, edited by A. Levy, H. Kalman, Vol. 10 (Elsevier, 2001) p. 65.