HAL Id: hal-01626707
https://hal.archives-ouvertes.fr/hal-01626707
Submitted on 7 Mar 2018
HAL is a multi-disciplinary open access
archive for the deposit and dissemination of sci-entific research documents, whether they are pub-lished or not. The documents may come from teaching and research institutions in France or abroad, or from public or private research centers.
L’archive ouverte pluridisciplinaire HAL, est destinée au dépôt et à la diffusion de documents scientifiques de niveau recherche, publiés ou non, émanant des établissements d’enseignement et de recherche français ou étrangers, des laboratoires publics ou privés.
To cite this version:
A Mgaidi, F Jendoubi, Driss Oulahna, M El Maaoui, John A. Dodds. Kinetics of the dissolution of sand into alkaline solutions: application of a modified shrinking core model. Hydrometallurgy, Elsevier, 2004, 71 (3-4), p.435-446. �10.1016/S0304-386X(03)00117-8�. �hal-01626707�
Kinetics of the dissolution of sand into alkaline solutions:
application of a modified shrinking core model
A. Mgaidi
a,*, F. Jendoubi
a, D. Oulahna
b, M. El Maaoui
a, J.A. Dodds
baIndustrial Inorganic Chemistry Laboratory, Chemistry Department, Faculty of Sciences, Tunis 1060, Tunisia b
Laboratoire de Ge´nie des Proce´de´s des Solides Divise´s—U.M.R. CNRS 2392—Ecole des Mines d’Albi Carmaux, Campus Jarlard—Route de Teillet 81013 Albi, France
Abstract
The batch dissolution kinetics of sand particles in concentrated alkaline sodium hydroxide solutions was investigated at high temperature and high pressure. The influence of the particle size, the operating temperature (150 – 220jC) and the hydroxide ion molality on the kinetic rate were studied. Experimental data fit well into a developed model based on the shrinking core model approach in which a variable activation energy term was introduced. Kinetic analysis of the experimental results reveals that the associated energy and the rate-controlling mechanism are dependent upon both sample temperature as well as the extent of the reaction.
Keywords: Sand dissolution; Kinetics; Shrinking core model; Activation energy; Mechanism
1. Introduction
Noncatalytic heterogeneous reactions in solid – liq-uid systems are numerous and of great industrial importance. The reaction rate, the particle size distri-bution, the particles’ shape and their complete con-version time into fluid phase are significant parame-ters for process design progress (Levenspiel, 1972; Villermaux, 1982).
Reactions in which the action of acid solutions on phosphate rock (for the production of phosphate fertilizers) and the dissolution of sand into sodium
hydroxide solutions (for the production of sodium silicate) have been extensively studied establishing kinetic curves (Jendoubi et al., 1997, 1998; Ben Brahim et al., 1997, 1999).
In particular, few papers on kinetic modelling of dissolution of sand into sodium hydroxide solutions under the operating conditions of the wet process (high temperature and high pressure) seem to be published. Moreover, the analysis of the literature shows that many models have been proposed to describe kinetic data in no catalytically heterogeneous reactions. Mathematical models based on the un-steady-continuity equation for a reagent species, in spherical coordinates, have been applied to describe the leaching of several minerals(Bartlett, 1973; Dixon and Hendrix, 1993). The reaction zone model was shown to fit experimentally leaching data over a wide
range of particle sizes and shapes and has subsequent-ly been used as basis for modelling in situ leaching process(Lubej et al., 1999).
Lakatos and Blickle (1990) proposed a model based on the population balance approach to account for the influence of particle size distribution in their kinetic model for noncatalytic liquid – solid reactions. However, no comparison between the experimental results and the computed data was presented.
Some kinetic models proposed in the literature, such as homogeneous model, uniform pore model, grain model and shrinking core model were tested by
Georgiou and Papangelakis (1998) to describe the sulfuric acid pressure leaching of a limonitic laterite. The authors proposed the grain model to describe nickel dissolution kinetics. This model needs some characteristics of the solid particles such as particle radius, molar density and porosity. Experimental data for the reaction between solid lime and gaseous HCl at low temperature have been fitted by Fonseca et al. (1998) using the grain model. This model was suc-cessfully used for a solid that is made up of small nonporous grains, and each of these grains reacted according to the unreacted core model. We can assume that the kinetic models reported are too simple, they did not take into account the change of the solid texture with time and they could only be applicable within the limits of their experiments.
Since 1972,Levenspiel (1972 and references there-in) proposed the unreacted core model to fit some kinetic data for noncatalytic solid – liquid reactions. On the basis of studies of numerous systems, the author concludes that the shrinking core model is the best simple representation for the majority of industrial solid – fluid reactions. Since no ash is formed at any time during reaction, we have a case of kinetics of shrinking particle, and the appropriate term to be used is ‘‘shrinking unreacted particle model’’ instead of ‘‘shrinking core model’’: Under chemical reaction control, these two terms are identical (Levenspiel, 1972).
The shrinking core model was successfully applied
(Greg et al., 2000) to fit the kinetics of extraction of gold(I), silver(I) and Ni(II) cyanide complexes from novel anion exchange resins. However, it is reported by Rahman and Al-Saleh (1999) that the kinetic leaching data of Raney-Ag alloy of different particle sizes into NaOH solutions failed to fit in the shrinking
unreacted particle model. A modified shrinking model was proposed byYoshioka et al. (2001) to study the kinetics of hydrolysis of polyethylene terephthalate powder in sulfuric acid. The authors assumed that the effective surface area was proportional to the degree of degradation of the sample.
Studying copper extraction by hydrochloric acid,
Brittan (1975)proposed the so-called ‘‘Variable Acti-vation Energy Shrinking Core Model’’ (VAESCM), in which the change of the activation energy as the reaction proceeds was taken into account. Veglio` et al. (2001a,b) proposed and used the approach of a variable activation energy on the shrinking core model to describe the kinetics of the manganese acid disso-lution under different experimental conditions (30V TV 70; 75 V particle size V 250 Am).
In this paper, a modified shrinking particle model has been proposed to describe the kinetic of dissolu-tion of sand into alkaline soludissolu-tions under experimental conditions (150V T V 220 jC and 0.47 V P V 2.29 MPa) close to those in the industry of the wet-process sodium silicate production. The attention was directed to the effect of particle size on the reaction rate. The experimental kinetic data were analyzed in order to determine the controlling mechanisms and the under-lying the equations.
2. Theoretical considerations
According to the ratio SiO2/Na2O used in this work, the reaction of dissolution of sand in NaOH solution could be represented by
2SiO2ðsolidÞþ Na2O$ Na2Si2O5 ð1Þ
The fractional amount dissolved was calculated using the following equation:
a ¼ total amount of SiOamount of SiO2 dissolved
2 present in the sand
! "
ð2Þ When the rate-limiting step is a surface reaction, the reaction rate is usually given by expression of the form m0 da dt ¼ mkjSC b 0exp $ Ea RT # $ ð3Þ
where a = extent of dissolution (dimensionless), m0= initial mass of sand (g), t = reaction time (min), kj = a constant factor, S = surface area (cm2
g$ 1), Ea= activation energy (J mol$ 1), C0= the hydroxide ion molality (mol cm$ 3), b = the reaction order with the respect to the ion hydroxide, m = stoichiometric coefficient, R and T the universal gas constant and the absolute temperature.
Using the standard formulation of the shrinking core model (for spherical particles) here, the ion hydroxide molality is considered constant during the chemical reaction, the time required for the conver-siona is given by
1$ ð1 $ aÞ1=3 ¼ t=s ð4Þ
For spherical solid with radius Rpdissolved accord-ing to the surface chemical reaction control, the complete dissolution time (noteds) will be expressed as follows:
s ¼ RpqSiO2
mkCb
OH$ ð5Þ
whereqSiO2is the sand true density in g cm
$ 3, R pis the mean particle radius in centimeters and k is the rate constant (mol min$ 1). In this case, if the shrinking core model is valid, the complete conversion times is given by the slope of the straight line 1$ (1 $ a)1/3 against reaction time.
Considering the variable activation energy term proposed byBrittan (1975) and utilized by Veglio` et al. (2001a) in the modelling of manganiferous ore leaching, the kinetic expression of the sand dissolu-tion has been written as
da dt ¼ a1 Rp exp $ Ea R 1 T $ 1 TV # $ þa2a a 3 RT # $ % & & ðC0 OH$ $ COHst $aÞbð1 $ aÞ2=3 ð6Þ
where a1, a2, a3and b are adjustable parameters; a1is constant (Am M$ b min$ 1); a2and a3 are parameters relating the dissolution extent to the activation energy (a2is in kJ mol$ 1and a3is dimensionless). COHst $, the
stoichiometric hydroxide ion molality requirement according to Eq. (1), was calculated by
CstOH$ ¼½mg=L(½% SiO2
content for each size fraction( 100& MSiO2
ð7Þ
The reference temperature TV was calculated as suggested elsewhere (Veglio` et al., 2001a) and was introduced in the model to reduce the correlation between the activation energy and the preexponential parameter in the Arrhenius expression. All adjustable parameters can be estimated by a nonlinear regression analysis procedure.
3. Experimental section 3.1. Materials
The sand used in the study was provided from the Bou Argoub region of Tunisia. The sample was sieved using ASTM standard sieves, giving particle size fractions of ( + 100, $ 125), ( + 300, $ 315), ( + 400, $ 500) and ( + 850, $ 1000) Am.
Dissolution tests were carried out in stainless steel autoclave of 250-ml capacity placed into a tubular furnace. The autoclave and furnace are equipped with swinging agitator system and heated using the electrical heating. The temperature was regulated at F 1 jC and checked with a Chromel– Alumel thermocouple.
Amount of reagents (sodium hydroxide solution and sand powder with composition of 99.2% of SiO2) corresponding to the reaction stoichiometry were introduced at room temperature, and the autoclave was closed and allowed to heat up to the desired temperature. The heating phase lasted about 30 min before the temperature reached 220jC.
3.2. Definition and analysis
To quantify the effects of the meaningful factors on the silica dissolution into sodium hydroxide solution, the particle size, the reactant molality and the temper-ature were chosen as parameters. Table 1 represents the selected experimental conditions used in this work.
During each experiment, the reaction time was noted from the moment when the autoclave reached the selected temperature. This time has been defined as ‘‘apparent reaction time,’’ since the dissolution has already began during the heat-ing phase. Preliminary experiments have shown that the reaction was detectable at about 150 jC.
At the end of reaction period, the slurry was filtered, and the remaining solid was washed, dried in an oven at 60 jC and weighed. The dissolution extent was calculated according to the expression (2).
The true densities of some solid samples before and after a dissolution time (see Table 2 for overall parameters and range employed in experiments) were measured by volume displacement using an Accupyc 1330 Helium micrometric pycnometer. Specific sur-face areas were measured by Argon adsorption at LN2 temperature (77 K) using BET method. Before measurement, each sample had been degassed at 100 jC for about 4 h. The particle size distribution was measured by laser diffraction using a MasterSizer Malvern 2000 apparatus. Finally, the raw and remaining sand collected were photographed under appropriate magnifications using a scanning electron microscope.
4. Results and discussion 4.1. Ore characterisation
In Table 2, we reported values of the true density, mean particle diameter and the specific surface area for unreacted and residue solids obtained at different stages of reaction. As seen from this table, the true density was not affected by the reaction progress, the mean value was assumed to be on the order of magnitude of 2.6047 g cm$ 3. However, the mean particle diameter (according to laser diffraction mea-surement) decreased from 320 to 240Am after 1 h of dissolution.
Studying the Ottowa sand, particle size fraction 590 – 850 Am, Worley et al. (1996) noted the differ-ence between the geometric and BET surfaces areas. The SBETwas 325 m2g$ 1, and the geometric one was 32 cm2g$ 1. In our case, as it can be seen fromTable 2 that there was no appreciable evolution of the surface area during the dissolution. The SBETobtained in this work was in the order of magnitude of 0.5 m2 g$ 1, a small value but not negligible. The geometric surface area is much lower than the BET surface area that leads to the conclusion that the particles have a relatively important internal porosity. As can be seen fromFig. 1, the volume particle diameter distribution
Table 2
Physical characterizations of solid samples used in experiments (initial conditions: Rp= 153.75 Am, T = 180 jC and initial OH$
molality = 12.5 mol kg$ 1)
Parameters Selected parameters values Apparent leaching time (min) 0 30 60 True densityqSiO2(g/cm
3) 2.6025 2.5948 2.6170
Surface area SBET(m2/g) 0.5267 0.1029 0.7103
Pore diameter 4 V/A (A˚ ) by BET
125.6 110.0 110.4 Mean particle diameter
2Rp(Am)
320 280 240 Fig. 1. Size distribution of the solid particles at different reactiontimes (R
p= 153.75 Am, T = 220 jC and initial OH$ molality =
12.5 mol kg$ 1). Table 1
Experimental dissolution conditions used in this work Test number Particle size (RpAm) T (jC) Initial OH$ molality (mol kg$ 1) Number of experimental points 1 153.75 220 12.5 7 2 153.75 200 12.5 6 3 153.75 180 12.5 6 4 153.75 150 12.5 4 5 153.75 220 8.0 8 6 153.75 220 3.0 8 7 153.75 220 0.5 8 8 56.25 220 12.5 10 9 225.00 220 12.5 9 10 462.25 220 12.5 10
was narrow and mono-modal. The volume diameter is about 240Am after 1 h apparent reaction time.
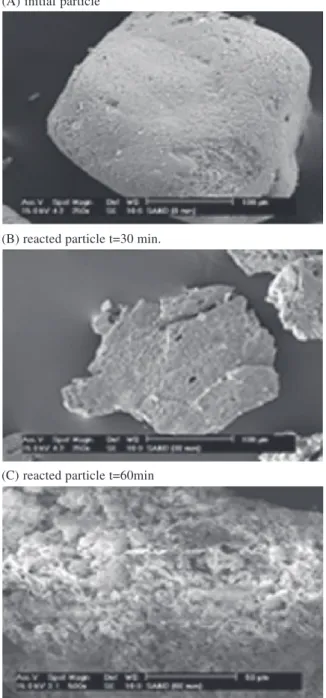
Scanning electron microscope observations of the raw and solid residue samples showed that the basic form and shape were slightly affected by the dissolu-tion. However, the surfaces of grains become rougher with small pores and cracks particularly for the
sample with a high conversion (see Fig. 2). The dissolution seems like a pitting corrosion process.
From the results obtained, it was reasonable to conclude that the dissolution occurred at first at the outer skin of the particle and the zone reaction would move into the solid state. Then, the particle shrank in size during dissolution. This should deter us to test the standard shrinking core model or an opportunely modified translation for the modelling investigation.
4.2. Effect of reaction temperature
In this section, our experiments were carried out in the temperature range 150 – 220 jC, maintaining the particle size constant at Rp= 153.75 Am and the sodium hydroxide solution at 12.5 mol kg$ 1.
For all experimental investigations, the real time of reaction will be given by t =h + h0. h0 represents the time that is required for the reaction to reach a conversion ofa0, andh is the apparent reaction time. Values ofh0used in this work were from our previous works (Jendoubi et al., 1997, 1998). The heat-up period was about 30 min from the room temperature
Fig. 2. SEM observations of the solid residue at different reaction times (Rp= 153.75 Am, T = 220 jC and initial OH$ molality =
12.5 mol kg$ 1).
Fig. 3. Time evolution of the fraction transformed (a) at dif-ferent temperatures (Rp= 153.75 Am and initial OH$ molality =
to the target temperature. The dissolution of sand can begin at about 150jC. Values of h0were in the range of 3 – 7 min. As seen from the experimental results given inFig. 3, the dissolution rate increased with the increasing temperature.
In the case of the classical shrinking core model (1$ (1 $ a)1/3) = kt, the time t for a certain fraction
transformed a can be determined from a set of isothermal experiments using
lnt¼ Const þ Ea
RT ð8Þ
In agreement with the validity of the Arrhenius equation, a plot of ln t against 1/T gives straight lines.
Fig. 4. Plot of 1$ (1 $ a)1/3
versus real reaction time at different temperatures (Rp= 153.75 Am and initial OH$
mol-ality = 12.5 mol kg$ 1).
Fig. 5. Reduced time plots (t/t0.33) for the dissolution of sand at 150,
180, 200 and 220 jC (Rp= 153.75 Am and initial OH$
molality = 12.5 mol kg$ 1).
Fig. 6. Plot of ln ‘‘time to given fraction’’ versus 1/T (K).
Fig. 7. Plot of the ‘‘variable activation energy’’ term against dissolution extent (a).
We observed (seeFig. 4) that the standard formalism of this model fits only the experimental data up to real dissolution time of about 25 min (heating time not included), especially for the two highest temperatures (200 and 220jC). At these temperatures and at higher values ofa>0.7, the liquid phase became more viscous, and we can assume that the dominating reaction pro-cesses was not a single rate-controlling step. According to Levenspiel (1972), a change in activation energy indicates a shift in controlling mechanism of reaction. The reduced time method was used in this context for the kinetic analysis of the experimental data in the temperature range 150 – 220 jC. This method com-pares the experimental data in the form of fraction reacted against reduced time t/ti at definite a levels; with data calculated using a known solid-state reac-tion equareac-tion rate. The reduced time plots represented in Fig. 5 use t/t0.33. Frequently, t/t0.5 has been employed as well as t/t0.66, but in this work, t/t0.33
was applied for the data at 150jC since t0.5could not been determined from the experimental data. As it can be seen from Fig. 5, experimental runs at different temperatures do not show a line on a single curve especially for greatest dissolution extent a (a>0.5). That implies that a variation in the energetics of the reaction occurs throughout the transition.
The activation energy can be determined from rate constant k or using the ‘‘time to a given fraction’’ method. The latter method was used by several authors(Redfern, 1987; Bray and Redfern, 2001 and references therein). Drawing ln t against 1/T for higher values ofa (0.8 < a < 0.9 and 100 < T < 130jC),Bray and Redfern (2001) obtained straight lines with dif-ferent slopes and concluded that the dominant mech-anism of Ca-montmorillonite dehydration changed.
As seen inFig. 6 the plots of ln ‘‘time to a given fraction’’ versus 1/T, for 0.1V a V 0.9 and 150 V TV 220 jC give straight lines with different slopes showing the dependence of the activation energy ona. Points representative of conversions from 0.1 to 0.9 presented in this figure were calculated using the simple first-order exponential function developed else-where(Jendoubi et al., 1997). The variation of activa-tion energy against the dissoluactiva-tion extent is illustrated in Fig. 7. It was found that the activation energy associated to the reaction can be expressed by an empirical equation of the form
EaðaÞ ¼ Eaþ a2aa3 ð9Þ
where Ea, a2 and a3 are adjustable parameters. The value of Ea= 74.39 kJ mol$ 1 falls well within 67 – 77 kJ mol$ 1 reported byRimstidt and Barnes (1980). It is possible to observe from Fig. 7 that there is quite good agreement between experimental and calculated results.
The approach applied by Brittan (1975) and
Veglio` et al. (2001a) was used to take into account the variation of the activation energy with extent of dissolution, and the consumption of NaOH and over time in the data analysis. The proposed kinetic
Fig. 8. Scatter diagram between the experimental extent of dissolution and those calculated using the modified shrinking core model. Runs performed at different temperatures (Rp= 153.75Am
and initial OH$molality = 12.5 mol kg$ 1).
Table 3
Estimated parameters (test: 1 – 7)
Parameter a1(Am M$ bmin$ 1) Ea(kJ/mol) a2(kJ/mol) a3 b (dimensionless)
equation including four adjustable parameters (Eq. (6)) was numerically solved by the Runge Kutta method, and the parameters were fitted by the nonlinear regression analysis using the solver pro-gram of Microsoft Excel with Newton’s method. At the beginning, only the database performed at dif-ferent temperatures were incorporated in the data treatment.
The objective function used was based on a relative deviation between calculated and experimen-tal extent of dissolution and the absolute mean square errors (ER) was calculated by the following equation:
ER¼ 1
N XN
i¼1
ðai;exp$ ai;calÞ2
" #1=2
ð10Þ where N is the number of experimental data and i is the experimental conversion index.
The precision obtained for the data representation was better than 7%. A comparison between the experimental dissolution extents collected at differ-ent temperatures and the simulated data is shown in
Fig. 8. As it can be seen, there is an agreement between simulated and experimental results. Thefinal values of the adjusted parameters are summa-rized in Table 3.
Fig. 9. Plot of 1$ (1 $ a)1/3versus time for different ion hydroxide
molalities (Rp= 153.75Am and T = 220 jC).
Fig. 10. Scatter diagram between the experimental extent of dissolution and those calculated using the modified shrinking core model. Effect of ion hydroxide molality (Rp= 153.75 Am and
T = 220jC).
Fig. 11. Plot of 1$ (1 $ a)1/3
versus real dissolution time for different particle sizes (T = 220jC and initial OH$molality = 12.5 mol kg$ 1).
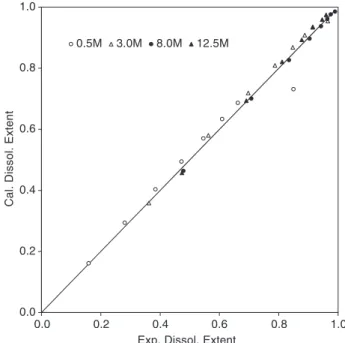
4.3. Effect of OH$ molality at constant particle size Experiments were performed at 220 jC and with particles in the size range ( + 300, $ 315) Am to investigate the effect of OH$ on the dissolution rate. As is possible to observe from Fig. 9, the shrinking core model cannot be employed to fit the kinetic data at different OH$molalities. However, considering the variation of the reagent concentration during dissolu-tion (using VAESCM), the agreement between exper-imental and calculated conversion values was found to be very good (seeFig. 10).
The prediction of dissolution extent at different ion hydroxide molalities is characterized by an rms abso-lute deviation less than 8%. This satisfactory agree-ment was obtained by using the values reported in
Table 3 without new adjusted parameters.
The reaction order with respect to hydroxide ion is 0.45. In the study carried out byWorley et al. (1996), it was reported that the value of the reaction order with respect to OH$ depends on the temperature of dissolution and lies between 0.72 at 100 jC and 0.88 at 200jC.
4.4. The effect of particle size
Experiments were carried out using four different particle size ranges: ( + 100, $ 125), ( + 300, $ 315), ( + 400, $ 500) and ( + 850 $ 1000) Am, while other parameters were kept constant: temperature at 220jC and sodium hydroxide molality at 12.5 mol kg$ 1.
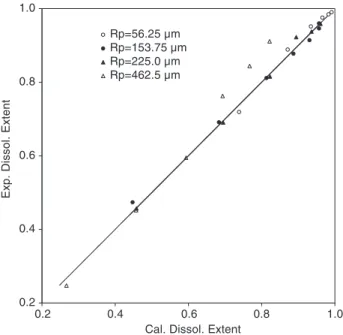
The effect of the particle size on the sand disso-lution is illustrated in Fig. 11. From this figure, one can see that the rate of dissolution increased by decreasing the initial particle radius noted Rp and the plots of 1$ (1 $ a)1/3 according to the standard shrinking core model versus real dissolution time gave two straight lines. So, the SCM used in the standard form was not able to describe the experi-mental data at different particle size. However, by applying the proposed model and readjusting only the parameter a1, a good agreement was observed as it illustrated in Fig. 12. The obtained parameter and root mean square deviation for each particle size are reported in Table 4. The value of the adjustable parameter was expressed as a1/Rp that normally decreases as the particle size increases.
4.5. Kinetic analysis
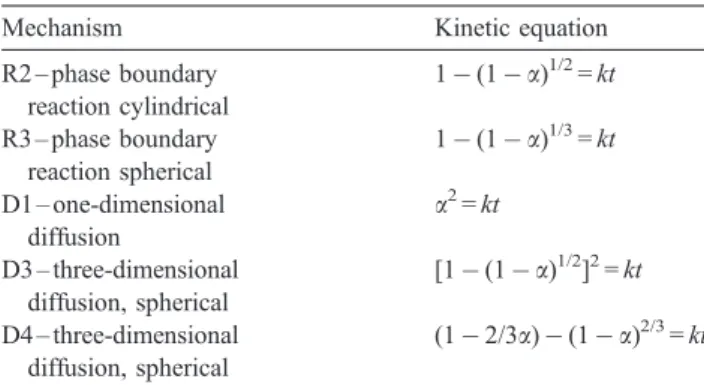
In this paragraph, attempts were made to fit all experimental data (runs at different temperatures, different particle sizes and reactant molality) to a series of a most commonly used solid-state reaction equations, summarized by Table 5. These functions are plotted as dotted lines for the diffusion group and continuous lines for the phase boundary with all
Fig. 12. Scatter diagram between the experimental extent of dissolution and those calculated using the modified shrinking core model. Effect of particle size (T = 220 jC and initial OH$
molality = 12.5 mol kg$ 1).
Table 4
Estimated parameters (test 8 – 10)
Fraction size (RpAm) 56.25 153.75 225.00 462.5
a1/Rp(M$ 0.45min$ 1) 0.527F 0.02 0.158F 0.006 0.131F 0.008 0.053F 0.01
experimental data in Fig. 13. In this figure, we have excluded certain reaction-controlling mechanisms. As can be seen from this figure, the kinetic equation of phase boundary (R2 and R3) is the best fit for the experimental dissolution extent less than 0.7. Over the greatest extent, data were intermediate between the value expected for phase boundary and that expected for diffusion control.
The above conversion time expressions (see Table 5) assume that a single resistance controls throughout dissolution of the sand particle. According to Leven-spiel (1972), the relative importance of the film, ash layer diffusion and reaction steps will vary as disso-lution progresses, and the time to reach any stage of conversion is the sum of the times needed if each resistance acted alone. Madsen et al. (1974) pro-posed the mixture model (layer diffusion + reaction) named reaction zone model for the leaching of low-grade copper sulfide ores. The conversion time expression is t sreaction ¼ ð1 $ ð1 $ aÞ 1=3 Þ þ Bð1 $ 3ð1 $ aÞ23 þ 2ð1 $ aÞÞ ð11Þ
where sreaction is the complete dissolution time given by Eq. (5) and B is a parameter function of De the effective diffusion coefficient in a solid (cm2 s$ 1), the rate constant, Rp, the initial radius of particle. Value of the parameter (B = 2.62) was estimated by a nonlinear regression analysis procedure. As it can be seen from Fig. 13, this model seems to be more suitable to describe the dissolution of sand particles into alkaline solutions. In the future, experimental
data obtained at different stirring speed would be included in the database to obtain reliable kinetic results according to the mixture model.
5. Conclusions
The dissolution of natural sand into alkaline sol-utions at high T and P was investigated by taking into consideration the parameters of temperature, particle size and hydroxide ion molality. The kinetic data fit well to the shrinking core model with variable acti-vation energy. A good agreement between the exper-imental results performed at different temperatures and calculated data have been obtained with a root mean squares (rms) absolute deviation less than 7%. A satisfactory representation of experimental data at different ion hydroxide molalities was obtained and the rms absolute deviation was less than 6%. On the basis of these results, we have extended the represen-tation to the experimental data performed at different particle sizes, and the best fit was obtained by
adjust-Table 5
Solid-state reaction equations used in this work
Mechanism Kinetic equation R2 – phase boundary reaction cylindrical 1$ (1 $ a)1/2 = kt R3 – phase boundary reaction spherical 1$ (1 $ a)1/3 = kt D1 – one-dimensional diffusion a2 = kt D3 – three-dimensional diffusion, spherical [1$ (1 $ a)1/2]2= kt D4 – three-dimensional diffusion, spherical (1$ 2/3a) $ (1 $ a)2/3 = kt
Fig. 13. Plots of the model outlined inTable 5along with total data points performed at different temperatures, different particle sizes and different hydroxide ion molalities.
ing one parameter (a1) and considering one fraction size at a time.
The kinetic analysis proved that the nature of the rate-controlling mechanism was a function of the extent of dissolution, and the reaction was dominated by a combination of two processes (phase boundary and diffusion). The present work is being extended in two directions:
– experimental results on the effect of stirring speed will be included in the database in order to check the effect of diffusion on the reaction rate.
– development of a full model including the evolution of the grain topology and a mixture of particles of various shapes and sizes.
List of symbols
a1 constant in Eq. (6) (Am M$ b min$ 1) a2 adjustable parameter in Eqs. (6) and (9) (kJ
mol$ 1)
a3 adjustable parameter in Eqs. (6) and (9) (dimensionless)
b reaction order with the respect to the ion hydroxide
C0OH$ the initial hydroxide ion molality (mol cm$ 3)
CstOH$ the stoichiometric hydroxide ion molality (mol cm$ 3)
De the effective diffusion coefficient in a solid (cm2s$ 1)
Ea activation energy (kJ mol$ 1) k the rate constant (mol min$ 1) kj a constant factor in Eq. (3) m mass of sand at time t (g) m0 initial mass of sand (g) MSiO2 molecular weight (g mol
$ 1) r rate of dissolution
R universal gas constant (J mol$ 1K$ 1) Rp mean particle radius (cm)
S surface area (cm2 g$ 1) t real reaction time (min) T absolute temperature (K)
TV absolute reference temperature (K) Greek letters
a extent of dissolution (dimensionless) m stoichiometric coefficient
qSiO2 true density of sand (g cm
$ 3)
s complete dissolution time (min) h apparent reaction time (min)
Acknowledgements
The authors would like to thank Professor F. Veglio`, Genoa Albaro Italy for his valuable discussions and literature. The authors express their profound gratitude to the editor and reviewers of Hydrometallurgy for corrections and suggestions.
References
Bartlett, R.W., 1973. In: Evans, D.J.I., Shoemaker, R.S. (Eds.), Int. Symp. on Hydrometallurgy. AIME, New York, pp. 331 – 374. Ben Brahim, F., Mgaidi, A., El Maaoui, M., 1997. Exploration of
mesoporous structure of Tunisian Raw and acid leached phos-phate ore particles. Can. J. Chem. Eng. 75, 759 – 764. Ben Brahim, F., Mgaidi, A., El Maaoui, M., 1999. Kinetics of
leaching of phosphate ore particles in dilute phosphoric acid solutions. Can. J. Chem. Eng. 77, 136 – 142.
Bray, H.J., Redfern, S.A.T., 2001. Kinetics of dehydration of Ca-montmorillonite. Phys. Chem. Miner. 26, 591 – 600.
Brittan, M.I., 1975. Variable activation energy model for leaching kinetics. Int. J. Miner. Process. 2, 321 – 331.
Dixon, D.G., Hendrix, J.L., 1993. A general model for leaching of one or more solid reactants from porous particles. Metall. Trans. B 24, 157 – 169.
Fonseca, A.M., Orfao, J.J., Salcedo, R.L., 1998. Kinetic modelling of the reaction of HCl and solid lime at low temperature. Ind. Eng. Chem. Res. 37, 4570 – 4576.
Georgiou, D., Papangelakis, V.G., 1998. Sulphuric acid pressure leaching of a limonitic laterite: chemistry and kinetics. Hydro-metallurgy 49, 23 – 46.
Greg, W.D., Lawrence, R.G., Lawson, P.J., Rideout, J.A., 2000. Application of the shrinking core model to the kinetics of extraction of gold (I), silver (I) and nickel (II) cyanide com-plexes by novel anion exchange resins. Hydrometallurgy 56 (3), 323 – 336.
Jendoubi, F., Mgaidi, A., El Maaoui, M., 1997. Kinetics of the dis-solution of silica in aqueous sodium hydroxide dis-solutions at high pressure and temperature. Can. J. Chem. Eng. 75 (4), 721 – 727. Jendoubi, F., Mgaidi, A., El Maaoui, M., 1998. The dissolution kinetics of sand as function of particle size. Can. J. Chem. Eng. 76 (2), 233 – 238.
Lakatos, B., Blickle, T., 1990. Effect of particle size distribution on liquid – solid reaction kinetics in solutions. Acta Chim. Hung. 127 (3), 395 – 405.
Levenspiel, O., 1972. Chemical Reaction Engineering, 2nd ed. Wi-ley, New York.
Lubej, A., Koloini, T., Pohar, C., 1999. Kinetics of the dissolution of copper (II) in diluted aqueous hydrochloric acid solutions at different temperature. Ind. Eng. Chem. Res. 38, 4277 – 4283.
Madsen, B.W., et al., 1974. Application of a mixed kinetics model to leaching of low grade copper sulphide ores. Trans. Soc. Min. Eng. 258, 69 – 74.
Rahman, S.U., Al-Saleh, M.A., 1999. Kinetic study of leaching process of Raney silver catalyst. Chem. Eng. J. 72, 229 – 233. Redfern, S.A.T., 1987. Kinetics of dehydration of kaolinite. Clay
Miner. 22, 447 – 456.
Rimstidt, J.D., Barnes, H.L., 1980. The kinetic of silica – water reactions. Geochim. Cosmochim. Acta 44, 1683 – 1699. Veglio`, F., Trifoni, M., Pagnanelli, F., Toro, L., 2001a. Shrinking
core model with variable activation energy: kinetics of maganif-erous ore leaching with sulfuric acid and lactose. Hydrometal-lurgy 60, 167 – 179.
Veglio`, F., Trifoni, M., Toro, L., 2001b. Leaching of Manganiferous ores by glucose in sulfuric acid solutions: kinetic modelling and related statistical analysis. Ind. Eng. Chem. Res. 40, 3895 – 3901. Villermaux, J., 1982. Ge´nie de la re´action Chimique conception et
fonctionnement des re´acteurs, 2nd ed. Lavoisier, Paris. Worley, W.G., Tester, J.W., Grigsby, 1996. Quartz dissolution
ki-netics from 100 – 200jC as a function of pH and ionic strength. A.I.Ch.E. J. 42 (12), 3442 – 3457.
Yoshioka, T., Motoki, T., Okuwaki, A., 2001. Kinetics of hydrol-ysis of poly(ethylene terephtalate) powder in sulphuric acid by a modified shrinking core model. Ind. Eng. Chem. Res. 40, 75 – 79.