HAL Id: hal-02105481
https://hal.archives-ouvertes.fr/hal-02105481
Submitted on 21 Apr 2019
HAL is a multi-disciplinary open access
archive for the deposit and dissemination of
sci-entific research documents, whether they are
pub-lished or not. The documents may come from
teaching and research institutions in France or
abroad, or from public or private research centers.
L’archive ouverte pluridisciplinaire HAL, est
destinée au dépôt et à la diffusion de documents
scientifiques de niveau recherche, publiés ou non,
émanant des établissements d’enseignement et de
recherche français ou étrangers, des laboratoires
publics ou privés.
M. Laneuville, J. Taylor, M. Wieczorek
To cite this version:
M. Laneuville, J. Taylor, M. Wieczorek. Distribution of Radioactive Heat Sources and Thermal
History of the Moon. Journal of Geophysical Research. Planets, Wiley-Blackwell, 2018, 123 (12),
pp.3144-3166. �10.1029/2018JE005742�. �hal-02105481�
Distribution of Radioactive Heat Sources and Thermal History
of the Moon
M. Laneuville1 , J. Taylor2 , and M. A. Wieczorek3
1Earth-Life Science Institute, Tokyo Institute of Technology, Tokyo, Japan,2Hawai’i Institute of Geophysics and Planetology, University of Hawaii, Honolulu, HI, USA,3Université Côte d’Azur, Observatoire de la Côte d’Azur, CNRS, Laboratoire Lagrange, Nice, France
Abstract
The initial distribution of heat sources in crustal and mantle reservoirs plays a major role in the thermal evolution of the Moon. We use new constraints on the thickness of the crust, the size of a nearside low in crustal magnetization, surface composition data from orbit, Apollo samples, and mass balance considerations to generate a set of plausible post magma ocean initial conditions. We then test those initial conditions using the 3-D thermochemical mantle convection code Gaia and compare with observables. Models that use Lunar Prospector gamma-ray spectrometer values of thorium throughout the highland crust cannot sustain long lasting volcanic activity, as low abundances of heat-producing elements are left in the mantle to keep an Earth-like bulk silicate composition. The low magnetic field intensities of the innermost Procellarum KREEP Terrane are consistent with a higher heat production than in the outermost portion and delayed cooling below the Curie temperature of iron metal until after 3.56 Ga when the dynamo field strength is known to have decreased by an order of magnitude. The distribution of crustal heat sources also influences the depth evolution of isotopic closure isotherms for a range of isotopic systems relevant to radiometric dating, which may be important for sample age estimation. Core crystallization can sustain a continuous dynamo for about 1 billion years, after which dynamo activity is potentially more episodic.Plain Language Summary
The lunar surface possesses different features on the nearside and farside hemisphere. In particular, extrusive volcanism is localized on the nearside and is correlated with a surface enrichment in heat-producing elements (Th, U, and K). How representative this enrichment is of the lunar interior and which processes governed the initial localization are important questions to understand the dynamics of planetary differentiation. In this contribution, we investigate how different initial distributions of those elements within major geochemical reservoirs affects long-term evolution through several observables (such as volcanism, paleomagnetic record, and present-day surface heat flow). Among other things, we found that the deep highland crust must contain less heat-producing elements than the surface values to account for farside volcanism. We also discuss the implication of lateral variation in heat-producing element distribution on radiometric dating of lunar samples.1. Introduction
The asymmetric nature of the distribution of radiogenic heat sources on the lunar surface was first made abundantly clear by data obtained from the Lunar Prospector gamma-ray spectrometer (Lawrence, 2003). The observed concentration of heat-producing elements on the nearside hemisphere of the Moon in a region that encompasses the Imbrium impact basin and Oceanus Procellarum, the Procellarum KREEP Terrane (PKT; Jolliff et al., 2000), had a major influence on the global interior evolution of the Moon, including, but not limited to, volcanic activity, magnetic field generation, impact processes, and true polar wander (Hess & Parmentier, 2001; Laneuville et al., 2013; Miljkovic et al., 2013; Siegler et al., 2016; Wieczorek & Phillips, 2000; Zhang et al., 2013; Zhong et al., 2000). We reevaluate the global distribution of heat-producing elements in the Moon and the Moon’s thermal evolution using new constraints based on crustal thickness, the size of a nearside province with low magnetization, surface composition from orbit, Apollo samples, and mass balance considerations. Earlier models of the Moon’s bulk composition (e.g., Longhi, 2006) recognized that the Moon was depleted in the element K compared to Earth, but these studies varied in the estimates of refractory element abun-dances, including U and Th. Estimates fell into two groups: Earth-like bulk refractory silicate contents and enrichments with respect to the bulk-Earth values by up to 50% (e.g., Taylor et al., 2006). The enriched values
RESEARCH ARTICLE
10.1029/2018JE005742 Key Points:
• The distribution of heat sources in the Moon is constrained using crustal thickness, crustal magnetization, composition, and mass balance • The high heat production in the inner
PKT delays cooling of this province until after the dynamo field strength decreased
• The deep highland crust must contain less heat-producing elements than the surface values to account for long-term volcanism
Correspondence to:
M. Laneuville, mlaneuville@elsi.jp
Citation:
Laneuville, M., Taylor, J., & Wieczorek, M. A. (2018). Distribution of radioactive heat sources and thermal history of the Moon. Journal of Geophysical
Research: Planets, 123, 3144–3166.
https://doi.org/10.1029/2018JE005742
Received 29 JUN 2018 Accepted 16 NOV 2018 Accepted article online 22 2018 Published online 18 DEC 2018
©2018. American Geophysical Union. All Rights Reserved.
Figure 1. Distribution of Th on the lunar nearside (left) and farside (right) using a Lambert azimuthal equal projection
(modified from; Mimoun et al., 2012). The Procellarum KREEP Terrane is outlined in white and is defined by the 4-ppm thorium contour. Stars represent the Apollo landing sites, and circles denote the Luna sample return sites. The yellow stars are the locations of the two Apollo heat flow measurements. The farside ellipses are the inner compositional anomaly and outer structural rim of the SPA basin. SPA = South Pole-Aitken.
were motivated largely by Apollo-era estimates for the thickness of the crust that placed a large quantity of refractory elements (such as Al) in the crust. New crustal thickness measurements based on reanalyses of the Apollo seismic data (e.g., Khan, 2002; Lognonné et al., 2003) and gravity data from the Gravity Recovery and Interior Laboratory mission (Wieczorek et al., 2013) point to a thinner crust and no longer require the Moon to be enriched in refractory elements (Taylor & Wieczorek, 2014). These analyses, along with studies that sug-gest the Moon and Earth are nearly identical in terms of several isotopic systems (e.g., Herwartz et al., 2014; Mougel et al., 2018; Sedaghatpour et al., 2013; Young et al., 2016; Zhang et al., 2012), imply that the Moon also has bulk-Earth abundances of the heat-producing elements Th and U, even though new data still indicate depletions in K and other elements with similar volatilities.
Figure 2. Strength of a parameter that is proportional to crustal
magnetization (M) over the nearside hemisphere (Wieczorek, 2018), which shows the size of the low-magnetism region (blue) in comparison to the traditional Procellarum KREEP Terrane boundary defined by 4-ppm Th (white contour). The black contour represents the size of the Imbrium impact basin, the image is presented using a Lambert azimuthal equal projection, and grid lines are spaced every 30∘in latitude and longitude. The parameter plotted is the average dipole moment of magnetized regions of the crust (magnetizationMtimes volumeV) multiplied by the square root of the number of magnetized regions,N.
The global distribution of radiogenic heat sources is best documented by gamma-ray spectrometer remote sensing data from both the Lunar Prospector and Kaguya missions (Kobayashi et al., 2012; Lawrence et al., 2007), while sample analyses from the Apollo and Luna missions pro-vide ground truth at certain locales on the nearside hemisphere. Among the heat-producing elements, thorium is the best constrained from orbit and can be used as a proxy for the other heat-producing elements since thorium, uranium, and potassium do not fractionate among each other significantly during magmatic processes. From global maps (see Figure 1), it is clear that the distribution of thorium is not uniform and that the PKT is highly enriched in incompatible and heat-producing elements. Previously, a contour of about 4-ppm thorium has been used to deter-mine the size of the PKT, and this size has been incorporated into several thermal evolution models (e.g., Grimm, 2013; Laneuville et al., 2013; Wiec-zorek & Phillips, 2000). Sample analyses show that most of the thorium enrichment in the PKT is present in the nonmare crust and that the tho-rium enhancement is not simply a result of the mare basalts themselves (Jolliff et al., 2000). The morphology of impact basins shows that basins within the PKT region form with larger sizes than elsewhere (Miljkovic et al., 2013) and that their viscous relaxation is faster than elsewhere (Kamata et al., 2013). Both of these observations imply a higher than average tem-peratures in this province, suggesting that the entire crust of this region is enriched in heat-producing elements. This enrichment can also be seen from surface heat flow measurements made during the Apollo 15 and 17 missions (Langseth et al., 1976), where the heat flow at the Apollo 15 site
Figure 3. Hypothetical structure of the PKT, where the interior portion with
low magnetic field strengths has higher concentrations of Th, U, and K than the outer portion defined by surface composition data. This geometry corresponds to model 5 (see text for details). PKT = Procellarum KREEP Terrane.
(which lies within the PKT) is higher than that at the Apollo 17 site (which is just exterior to the PKT). Regardless, based on these data and observations, it is difficult to determine if the abundance of heat-producing elements in this region is uniform or not.
In an analysis of the Moon’s magnetic field by Wieczorek (2018), it was noted that the magnetic field strength is extremely weak within the inte-rior portion of the PKT (see Figure 2). In that study, the inversion for a quan-tity proportional to the crustal magnetization showed that this quanquan-tity was about an order of magnitude smaller than elsewhere. This demagneti-zation signature is unlike that associated with any impact basin, and it was suggested that the prolonged cooling of the PKT might have been able to keep the temperature of the crust in this region above the Curie tempera-ture of iron metal (the primary ferromagnetic mineral in lunar rocks) for a significant period of time. In particular, it was proposed that cooling of the crust below the iron metal Curie temperature occurred only after the early high-field dynamo strengths decreased by an order of magnitude around 3.5 Ga (Tikoo et al., 2014). That study argued that the inner PKT region—now defined by the magnetic low—is the core of the heat source enrichment, whereas the remaining part of the PKT (as defined by surface Th abundances) is less enriched (see Figure 3).
The late stage liquid remaining during magma ocean crystallization is naturally enriched in radioactive and other incompatible elements. The fate of that liquid layer, contemporaneously formed ilmenite cumulates, and the subsequent effects on the Moon’s thermal evolution have been the topic of many studies. Models have been proposed for the asymmetric distribution of KREEP, including direct overturn of the ilmentite and KREEP-rich cumulates as a result of their high intrinsic densities (Parmentier et al., 2002), subsequent upwelling (or not) of a KREEP-rich ilmenite layer that may have formed a layer around the Moon’s central iron core (Dygert et al., 2016; Zhang et al., 2017; Zhong et al., 2000), and localization of the KREEP-rich liquid layer following large impact events that thin the crust (e.g., Shearer, 2006). Though the origin of the enrichment of incompatible elements in the PKT, as well as when this occurred, is far from settled, one unanimous conclusion is that the initial distribution of heat sources in the different crustal and mantle reservoirs has a critical influence on the Moon’s subsequent evolution. The localization of KREEP in one hemisphere of the Moon is certainly linked in some way to the observation that the vast majority of mare basalts erupted on the nearside hemisphere (e.g., Laneuville et al., 2013; Wieczorek & Phillips, 2000).
In this contribution, we integrate constraints on radioactive element mass balance to propose and test the consequences of different heat source distributions. Section 2 describes how those models were constructed, which are based on the assumption of bulk-Earth abundances of refractory elements, the most recent esti-mates for the thickness of the lunar crust, remote sensing and sample data analyses, and magnetic field observations. In section 3, we describe the subsequent thermal evolution for each of these models and com-pare with the observations, which include the duration of farside and nearside volcanism, the duration of the dynamo, measurements of surface heat flow, and strength of crustal magnetization. Finally, in section 4, we discuss some implications concerning the distribution of heat-producing elements in the crust and mantle, the timing of crustal magnetization and dynamo activity, and how lateral variations in crustal temperature could affect isotopic closure of common radiogenic systems.
2. Distribution of Th, U, and K
In this section, we describe the constraints on the current and past distribution of heat-producing elements in the Moon. We start with a discussion of the geochemical behavior of thorium, uranium, and potassium and then describe the constraints on their abundances within both the crust and mantle. Following this, we describe several models for how these elements were distributed within the crust and mantle after magma ocean crystallization that will be tested in section 3.
2.1. Geochemical Behavior of Th, U, and K
Thorium, uranium, and potassium have a very similar geochemical behavior in igneous systems, and this allows us to infer the abundances of all three elements if we know the concentration of just one of them. The similarity in behavior is shown by their very low crystal-melt partition coefficients, which are all less than 0.1
Table 1
Estimated Th Concentrations in Major Crustal Reservoirs
Terranea Th (ppm) 1-𝜎 Source
Feldspathic highlands (upper layer) 1.0 0.3 Prettyman et al. (2006) Feldspathic highlands (anorthosite layer) 0.05 0.03 Meyer (2005)b
Procellarum KREEP Terrane-1 (uniform model) 5.7 1.9 Prettyman et al. (2006) Procellarum KREEP Terrane-2 (uniform model) 8.2 4.0 Korotev (2000) Procellarum KREEP Terrane-3 (inner) 8.2 4.0 Korotev (2000) Procellarum KREEP Terrane-3 (outer) 4.2 2.5 This study
aDefined by Jolliff et al. (2000). bAverage of lunar samples 60135, 62236, 62275, and 67016.
(see Table A1). For olivine, augite, ilmenite, and orthopyroxene, the partition coefficients are less than 0.008, whereas for plagioclase, the partition coefficients are somewhat larger and can reach up to a maximum of 0.1 for potassium. Thus, all three elements are incompatible, and their concentrations are not greatly affected by source rock composition or crystallizing phase, unless the source rocks or magmas are rich in feldspar. Th, U, and K correlate closely in lunar basaltic rocks and mafic impact-melt breccias. The Th/U ratio is found to be chondritic, equal to about 3.7 (Lodders, 2003). Using the bulk Moon K of 36.9 ppm from G. J. Taylor and Wiec-zorek (2014) and assuming the lunar bulk Th is the same as the terrestrial value of 0.0795 ppm (McDonough & Sun, 1995), the bulk Moon K/Th ratio is found to be 460. This ratio is much less than the bulk-Earth ratio of 3,000 (McDonough & Sun, 1995), which is an indication of the strong depletion of potassium in the Moon compared to Earth. Despite the depletion of potassium in the Moon, we note that this has only a modest effect on the total heat production early in lunar history. In the following subsections we assess the abundance of Th in the major geochemical reservoirs, as this is the best determined of the elements globally. We then use the Th/U and K/Th ratios to estimate the K and U concentrations.
2.2. Distribution of Thorium in the Crust
The heat-producing elements Th, U, and K are distributed heterogeneously in the lunar crust (Figure 1). As pointed out by Jolliff et al. (2000), the western nearside of the Moon is dominated by a large region enriched in Th, which they named the PKT. The remainder of the lunar surface contains much less Th than does the PKT and is divided into two main regions: the Feldspathic Highlands Terrane and the South Pole-Aitken terrane (Jolliff et al., 2000). We assess the Th distribution in each and summarize our nominal values in Table 1. For the thickness of each crustal province, we make use of the average thicknesses in G. J. Taylor and Wieczorek (2014) using their model 1.
The lunar highlands are rich in plagioclase, with substantial amounts of anorthosite (e.g., Hawke, 2003; Yamamoto et al., 2012). The most anorthositic region of the crust appears to underlie a less aluminous layer (Yamamoto et al., 2012) that is also slightly richer in Th. Lunar meteorites from the highlands (those with bulk Al2O3> 25 wt.%) are consistent with being derived from the upper aluminous layer (Korotev et al., 2003). The
thickness of this upper layer could be up to 10 km (Yamamoto et al., 2012), but based on the revised smaller thickness of the highlands crust, G. J. Taylor and Wieczorek (2014) suggest that a 5-km mean thickness for this layer is more reasonable. We adopt that value here. Data from the gamma-ray spectrometer on the Lunar Prospector mission (Prettyman et al., 2006) indicate that the mean surface Th concentration in the Feldspathic Highlands Terrane is 1.0 ± 0.3 ppm (Table 1), and we assume that this value is representative of the entire 5 km thickness of this layer.
Large outcrops of pure anorthosite (>98 wt.% plagioclase) occur in basin rings (Hawke, 2003; Yamamoto et al., 2012), indicating that deeper levels of the lunar crust are composed of ferroan anorthosite. This does not preclude the presence of more mafic rocks throughout the crust but only indicates that more mafic compo-sitions are relatively rare. We will assume that most of the highlands crust beneath the upper 5-km surficial layer is dominated by anorthosite. Outcrops of anorthosite are too small to determine their Th concentra-tions from orbital gamma-ray data, so we have estimated the composition of these rocks from the four ferroan anorthosite samples for which good analyses of Th are available (see references in Table 1). This results in an average value of 0.05 ± 0.03 ppm that we use for the deeper portion of the Feldspathic Highlands Terrane.
Ryder and Wood (1977) were the first to argue from the occurrence of mafic impact-melt breccias (often called LKFM for Low-K Fra Mauro basalts) sampled at the Apollo 15 and 17 sites that the lowermost crust of the Moon was more mafic than the upper portion of the crust. These impact-melt rocks contain substantial Th, ranging from 8 to 12 ppm in groups defined from lunar samples at the Apollo 14–17 landing sites (Korotev, 2000). If these rocks were present in the crust globally, they would have had a significant effect on the thermal evolution of the Moon. However, there is scant evidence that an LKFM-like crust exists beneath the Feldspathic Highlands Terrane outside of the PKT, such as elevated Th in basin ejecta. Indeed, even for basins like Crisium and Moscoviense that likely excavated mantle materials (Miljkovic et al., 2013), there is no evidence of KREEPy, LKFM-like materials at depth in the crust. Though there is a small enhancement of Th associated with the inner portion of the South Pole-Aitken basin, this region is volumetrically small (see below) and may be instead the result of fractional crystallization of a thick impact-melt sheet (Vaughan & Head, 2014). In our models, we do not include the presence of a lower mafic layer beneath the feldspathic highlands.
The PKT is defined in part by its high Th concentrations (see Figure 1), and we test various hypothesis con-cerning the concentration and distribution of thorium in this region. The average surface composition of this region, using a 4-ppm Th contour and the 2∘ Th map of Lawrence et al. (2000), is 5.7 ± 1.9-ppm Th (G. J. Taylor & Wieczorek, 2014). The entire PKT encompasses 16% of the Moon’s surface area, and for our first PKT scenario, we will assume that this average concentration applies to the entire thickness of the crust within this region. For our second model, we will assume that the mean composition of the Apollo mafic impact-melt breccias (8.2 ppm; Korotev, 2000) is representative of the entirety of the PKT.
As explained in detail in Wieczorek (2018), a region in the central portion of the PKT is found to have sig-nificantly lower magnetic field strengths and magnetizations than does the rest of the PKT. The low-field strengths of this region were ascribed to locally higher concentrations of heat-producing elements that could have caused this region to have temperatures above the Curie point of iron metal either when the core dynamo was operating or when the strongest dynamo field strengths were present. To test this hypothesis, in our third PKT scenario, we will assign a mean Th concentration for the inner region equal to that of the mean composition of the Apollo mafic impact-melt breccias. For this model, the composition of the remainder of the PKT with normal magnetic field strengths will be computed by assuming that the bulk Th content of the PKT is the same as in our first PKT model. This provides a value of 4.2 ppm for the outer region, which is similar to the lowest thorium concentrations that have been used traditionally to define the confines of this terrane. Finally, we note that the mean composition of the surface for the inner portion of the South Pole-Aitken Basin is 1.5 ± 0.4 ppm (see G. J. Taylor & Wieczorek, 2014). Although South Pole-Aitken is an important geologic and geochemical province on the Moon, it makes up only 3.6 wt.% of the crust (G. J. Taylor & Wieczorek, 2014). Given the similarity of the surface composition within this basin and the surrounding highlands, for computational convenience, we have thus used highland concentrations for the heat-producing elements within the entire South Pole-Aitken basin.
2.3. Distribution of Th in the Mantle
Planetary differentiation gives rise to a Th concentration in the mantle that is much lower than in the crust. However, the large mass of the mantle, 95.5 wt% of the silicate Moon, makes its Th content (and K and U as well) an important heat source. We have taken two approaches to estimating the Th concentration in the mantle. One method is to simply use the crustal concentrations and their mass fractions, the mantle mass fraction, and an assumed bulk lunar Th to calculate by mass balance how much Th would be in the mantle if distributed uniformly. For this calculation, we assume that the bulk silicate Moon has the same concentration of refractory elements as Earth (G. J. Taylor & Wieczorek, 2014), and we use the terrestrial value of 0.0795 ppm as determined by McDonough and Sun (1995). This represents the simplest case.
A more complicated case accounts for the likelihood that the mantle beneath the PKT is enriched compared to the mantle beneath the highlands. We can estimate the concentration in the mantle from the Th concen-trations in mare basalts using an appropriate partitioning coefficient. Most of the mare basalts in our sample collection erupted within, or adjacent to, the PKT, and their source regions are thus from the mantle beneath the PKT. Mantle-derived Th could be enhanced by assimilation of Th from KREEP-rich rocks within the crust. Because assimilation is almost always accompanied by fractional crystallization, samples with the highest Mg# are the least likely to have experienced assimilation and most likely to represent primary magmas from the mantle. Hence, we used the Th concentration in pyroclastic glasses (all of which have high Mg#) and
Table 2
Th Concentrations (ppm) in Suspected Primary Magmas
Sample Th Th in mantle source at given melt fraction
3% 5% 10%
Pyroclastic glass beadsa A-11 orange 0.52 0.0156 0.026 0.052
A-12 red 1.1 0.033 0.055 0.11 A-12 green 1 0.03 0.05 0.1 A-12 yellow 1 0.03 0.05 0.1 A-12 red 1.2 0.036 0.06 0.12 A-12 green 0.3 0.009 0.015 0.03 A-12 orange 0.53 0.0159 0.0265 0.053 Mare basaltsb 12002 0.78 0.0234 0.039 0.078 12009 0.88 0.0264 0.044 0.088 14072 1.07 0.0321 0.0535 0.107 15016 0.42 0.0126 0.021 0.042 15555 0.45 0.014 0.023 0.045 70017 0.2 0.006 0.01 0.02 70215 0.33 0.0099 0.0165 0.033 74275 1.2 0.036 0.06 0.12 Average 0.73 0.022 0.037 0.073
aTh data from Hagerty et al. (2006).bTh concentrations from the average of each sample as reported
from numerous sources in the literature.
suspected primary magmas of mare basalts (with high Mg# and no evidence of cumulate phases being present; see Table 2).
It is reasonable to assume that mare basaltic magmas formed by partial melting of mantle cumulates, probably hybridized to varying amounts by sinking dense cumulates (e.g., Ringwood & Kesson, 1976, April). Because they are incompatible (see Table A1), Th, U, and K concentrate in the melt during partial melting. The ratio of concentrations between the melt, Cm, and original rock, Co, is
Cm Co
= 1
D(1 − F) + F, (1)
where F is the melt fraction and D the partitioning coefficient (see Table A1). As the partition coefficients are all much smaller than one, their partitioning behavior is nearly the same, and Cm∕Co ∼ 1∕F. We calculated
the concentration in the mantle source rocks for each primary magma listed in Table 2 for 3%, 5%, and 10% partial melting. The average of all samples gives mantle concentrations ranging from 0.022- to 0.073-ppm Th. The amount of melting in the lunar mantle is not well constrained, but modeling suggests that the very low-Ti and low-Ti mare basalts, which are the most common on the Moon, could have formed by partial melting in the 1–10% range, although other estimates are as high as 30% (see review by Neal & Taylor, 1992). For our modeling, we used the average estimate for primary magma partial melting at 5% and 10%, giving an estimated 0.055-ppm Th in the mean mantle below the PKT. Partial melting also likely took place over a range of pressures (e.g., Elkins et al., 2000; Longhi, 1992; Shearer & Papike, 2005), but this would not greatly affect the behavior of Th and other highly incompatible elements.
2.4. Th Distribution Models
We constructed five different models for the distribution of heat-producing elements in the Moon that span a range of plausible scenarios. We summarize the models, along with their thorium concentrations, in Table 3 and describe the characteristics of each below. These thorium distributions will be used as the post magma ocean initial conditions for the thermal evolution models described in section 3.
Our first reference model, model 1, is defined by a uniform composition mantle. Using a mean thickness of 36.7 km for the Feldspathic Highlands Terrane crust (G. J. Taylor & Wieczorek, 2014), where the upper 5 km is
Table 3
Model Th Concentrations (ppm) in the Crustal and Mantle Geochemical Reservoirs
Crust Highlandsa 0.235 1.0 0.235 0.235 0.235 PKT 5.7 5.7 8.2 5.7 4.2 Inner PKT 8.2 Mantle Highlands 0.0390 0.0078 0.0238 0.0366 0.0366 PKT 0.0390 0.0078 0.0238 0.0550 0.0550
Note. Th/U and K/Th are set to 3.7 and 460, respectively (see text for details). PKT = Procellarum KREEP Terrane.
aIncludes the South Pole-Aitken basin.
composed of a mafic layer and the rest is anorthositic, the average concentration of Th in the crust is calcu-lated to be 0.235 ppm. (We compute the average composition of the crust because the spatial resolution of the numerical model in section 3 cannot resolve the relatively thin upper layer.) The PKT is modeled as hav-ing a uniform Th concentration of 5.7 ppm, which is the average surface composition as mapped by orbital gamma-ray spectroscopy data, and the thickness of the PKT is taken to be 26.4 km (G. J. Taylor & Wieczorek, 2014). Assuming a bulk silicate Earth composition, mass balance constrains the mantle thorium concentration to be 0.039 ppm.
Models 2 and 3 are similar to the first. Model 2 differs in that there is no deep anorthosite layer, and the entire feldspathic crust is taken to have the same composition as the surface (1-ppm Th). Mass balance for the mantle concentration of thorium gives 0.0078 ppm, which is 5 times lower than in model 1. In model 3, the composition of the PKT is taken to be 8.2-ppm Th, which is the average composition of the Apollo mafic impact-melt breccias. With a higher Th abundance in the PKT, the mantle composition is reduced from 0.039-to 0.023-ppm Th.
Model 4 tests the role of mantle heterogeneity on the Moon’s thermal evolution. The feldspathic crust and PKT are taken to be the same as in model 1. Based on our calculated Th abundances of the mare basalt source regions (Table 2), the mantle beneath the PKT is set to have a Th concentration of 0.055 ppm, which is greater than the average mantle composition of the first three models. Mass balance considerations for the remainder of the mantle give a concentration of 0.0366-ppm Th. We note that this value differs only slightly from the average mantle abundance of model 1, because the volume of the mantle beneath the PKT is relatively small.
The last model, model 5, is similar to model 4 but also includes the possibility that the innermost portion of the PKT, as defined by the magnetic low, has a higher heat production than the rest of this province. For this model, we assume that the central portion of the PKT crust has a thorium concentration of 8.2 ppm. The remainder of the PKT is assumed to have a thorium concentration of 4.2 ppm, which was computed so that the bulk PKT thorium content of this model was the same as for models 1, 2, and 4. The mantle composition beneath the PKT is taken to be the same as in model 4, and mass balance requires the composition of the remaining mantle to be 0.0366 ppm, which is, the same as for model 4.
3. Interior Evolution Model and Constraints
In this section, we first describe the methodology by which we model the thermal and dynamo evolution of the Moon. Following this, we describe the observations that are used to constrain our model, which include the longevity of mare volcanism, the asymmetric nature of mare volcanism, heat flow measurements, and paleomagnetism measurements that constrain the duration of dynamo activity.
3.1. Thermochemical Mantle Evolution
We used the 3-D thermochemical mantle convection code Gaia already used in Laneuville et al. (2013) to model the thermal evolution of the silicate Moon, changing only the initial distributions of radioactive
Table 4
Mantle and Core Model Parameters
Symbol Description Value
Rp Lunar radius 1,740 km
Rc Core radius 330 km
Dc Crustal thickness 40 km
Tsurf Surface temperature 250 K
T0 Reference temperature 1,600 K
𝜂0 Reference viscosity 1021Pa s
𝜂max Maximum viscosity 1028Pa s
E Activation energy 3105J/mol
cp Mantle specific heat capacity 1,000J⋅ kg−1⋅ K−1
cc Core specific heat capacity 850J⋅ kg−1⋅ K−1
kcr Crust thermal conductivity 2W⋅ m−1⋅ K−1
km Mantle thermal conductivity 4W⋅ m−1⋅ K−1
kc Core thermal conductivity 50W⋅ m−1⋅ K−1
L Latent heat of melting 3105J/kg
𝜌0 Mantle reference density 3,400 kg/m3
𝜌c Core reference density 7,500 kg/m3
Δ𝜌 Initial solid/liquid core density difference 45 kg/m3
𝛼0 Thermal expansivity 210−5/K
𝛼c Core thermal expansivity 910−5/K
Δ𝜌 Density difference between peridotite and harzburgite 60 kg/m3
C0 Melt fraction required between peridotite and harzburgite 0.3
g Surface gravity acceleration 1.62 m/s2
heat sources (see Hüttig & Stemmer, 2008; Hüttig et al., 2013, for a description of Gaia). Namely, we solve the Navier-Stokes equations in the mantle with an infinite Prandtl number (thermal diffusion is negligible com-pared to viscous diffusion) and under the Boussinesq approximation (no density contrast in the mantle other than in the buoyancy term). As described below, our model of the core differs somewhat from the model used in Laneuville et al. (2014). Table 4 provides a list of parameters used in our models.
We consider heating by radioactive decay, cooling from the surface and heat transfer to and from the core. The reference viscosity corresponds to that of a dry peridotite (1021Pa s at 1,600 K). Melting is considered in the
energy equation by computing the melt fraction with respect to the solidus and liquidus of KLB-1 peridotite (Karato & Wu, 1993). Although the Moon is not anhydrous, use of a dry solidus is still appropriate: Even if the mantle H2O concentration were everywhere like the orange pyroclastic glass source region (∼100 ppm, assuming 10% melting of a source that produced a magma with 1,000-ppm H2O; Hauri et al., 2011), we infer
from experiments on peridotite melting (Médard & Grove, 2008; Médard et al., 2008) that the depression of the solidus temperature would be<10 ∘C, less than the uncertainty in the solidus temperature computation. The boundary conditions are free slip both at the core-mantle boundary and at the surface. The initial radiogenic heat sources are allowed to advect freely with the mantle flow. We present results using a lower bulk viscosity, which influences cooling and melting behavior, in Appendix B.
We compute core evolution including inner core growth according to Nimmo (2015). The energy balance at the core-mantle boundary is
Qcmb= Qs+ QL+ Qg, (2)
where Qcmbis the core-mantle boundary heat flow, Qsis secular cooling, QLlatent heat of crystallization, and Qgis the gravitational potential energy released by inner core differentiation. While that last term is small in
and thus powering a dynamo. In order to compute the power available to the dynamo for dissipation, we calculate the entropy budget
Ek+ EΦ= Es+ EL+ Eg, (3)
where Ekis the entropy contribution due to thermal diffusion and EΦthat due to ohmic dissipation. The same subscript notation as the energy budget is used for the other terms. Solutions where EΦis positive predict the existence of a dynamo and global magnetic field. All contributions can be written as a function of the growth rate of the inner core, therefore, knowing the core-mantle boundary heat flow and the inner core growth rate is enough to model the evolution of the core. We do not consider radioactive heat sources in the core. Assuming a well-mixed core, the temperature profile is obtained by integrating the core-mantle boundary temperature downward along an isentropic gradient (Labrosse, 2003). Crystallization of the inner core is then computed when this temperature profile intersects the liquidus for an Fe-S alloy (Buono & Walker, 2011)
𝜕ri 𝜕t = −1 dTm∕dP − dTa∕dP Ti 𝜌ig 1 Tc dTc dt, (4)
where dTm∕dP and dTa∕dP are the pressure dependences of the melting curve and adiabatic temperature
profile, respectively. Tiand𝜌iare the temperature and density at the inner core boundary, respectively, while Tcis the temperature at the core-mantle boundary. Note that compared to Laneuville et al. (2014), we do not
neglect the partial derivative with respect to composition in dTm∕dP, which is important for the Moon but not
Earth. Any potential inner core is considered isothermal. As an initial set of parameters, the core is assumed to possess 4 wt.% S as an alloying element, with a core radius of 330 km (Weber et al., 2011). Unless stated otherwise, all models are run with a fixed 10-km radial resolution and 60-km horizontal resolution and are integrated forward in time for 4.5 billion years. When the crustal thickness is not exactly 40 km because of model resolution, we scale the concentrations in order for the total mass in the layer to be the same. For a resolution analysis, see Figure C1.
3.2. Description of the Main Observables
One of the main constraints for lunar thermal evolution models is the Moon’s long-lived and highly asym-metric volcanic activity. Crater counting techniques combined with dating of samples have set the range of mare basalt ages to about 4 to 1 Ga on the nearside (Hiesinger, 2003; Morota et al., 2009) and 3.85 to 2.5 Ga on the farside (Haruyama et al., 2009), with potential for even younger extrusions on the nearside (Braden et al., 2014). The total volume of extruded volcanic material has been estimated to be around 107km3(Head
& Wilson, 1992). However, this figure potentially underestimates the total amount of melting as some basalt flows may now be buried by basin ejecta (i.e., cryptomaria; Crites et al., 2015; Whitten & Head, 2015), and the intrusive to extrusive volcanism ratio is unknown (e.g., Prissel et al., 2016).
Based solely on the surface expression of mare basalts, only about 1% of the farside hemisphere has expe-rienced mare volcanism, in comparison to about one third of the nearside hemisphere. Comparing the average thickness of basalts in the South Pole-Aitken basin to those in Oceanus Procellarum suggests that the magma production rate over the farside hemisphere was about a factor of 10 times lower than for the nearside hemisphere (Wieczorek et al., 2001). If volcanism within the Moscoviense impact basin is represen-tative of the farside hemisphere, basalt thickness estimates in this region by Morota et al. (2009) similarly imply that the total volume of magma produced on the farside is about 3 to 10 times smaller than the near-side. This order of magnitude difference in magma production rates between the two hemispheres is one of the most notable aspects of the Moon and should be accounted for by any thermal evolution model that is deemed successful.
The surface heat flow is directly constrained by surface measurements made at the Apollo 15 and 17 landing sites. Using temperature data collected by the heat flow probes, the temperature gradient and thermal diffu-sivity were determined, which permitted to estimate the heat flow to be about 21 and 14 mW/m2at the two
sites, respectively (Langseth et al., 1976). Including a possible focusing effect due to variations in thickness of the megaregolith at the highland-mare boundary, Warren and Rasmussen (1987) proposed a correction to these numbers, lowering them slightly to 18 and 12 mW/m2. However, due to the fact that both heat flow
measurements were made close to the boundary of the PKT and Feldspathic Highlands Terrane, it is not clear if these measurements are representative of either of these two geologic provinces.
A recent attempt has been made to use the Diviner radiometer experiment on the Lunar Reconnaissance Orbiter to estimate surface heat flow in permanently shadowed regions (Paige & Siegler, ). The Diviner instru-ment measures thermal emission of the surface at infrared wavelength, allowing one to estimate the surface temperature. When applied to the permanently shadowed regions near the South Pole, temperatures as low as 20 K are obtained. Assuming that there are no other heat sources present (such as scattered radiation from the crater walls), this thermal radiation must be balanced by heat that is conducted from the interior to the surface. A simple energy balance using the Stefan-Boltzmann law constrains the maximum heat flow from the interior near the South Pole to be 6 mW/m2. This measurement is extremely important, as it is lower than
the Apollo 17 measurement by at least a factor of two, and could be representative of the heat flow of the Feldspathic Highlands Terrane, far from the contaminating effects of the PKT.
Orbital measurements show that portions of the lunar crust were magnetized early in its evolution, and pale-omagnetic analyses of lunar samples provide detailed constraints on how the dynamo field intensity varied over time. Apollo-era paleomagnetic analyses of lunar samples indicated an ancient field with an intensity comparable to that of Earth (>50 μT; Fuller & Cisowski, 1987). More recent studies using improved analyti-cal methods have since confirmed those values and constrain the epoch of Earth-like field strengths to be between 4.2 and 3.56 Ga (for a review, see Weiss & Tikoo, 2014).
At the close of the high-field epoch, paleomagnetic data show that the dynamo field strength decreased pre-cipituously by an order of magnitude from 3.56 to 3.19 Ga. During this time interval, the surface field strength is constrained to be less than 4 μT and could in fact be 0 (Tikoo et al., 2014). One younger sample implies that a weak field was present sometime between 2.5 and 1 Ga with a strength of about 5 μT (Tikoo et al., 2017). This analysis used the Thellier-Thellier double heating method in a controlled atmosphere, and the range of ages provided reflects the uncertainty of when the magnetization was acquired. As of yet, there are no paleomag-netic constraints as to whether the dynamo operated continuously in a weakened state from 3.56 to ∼1 Ga, or if the dynamo operated in a more episodic manner.
For this study, the primary constraint that will be employed will be that a dynamo operated more or less continuously between at least 4.2 and 3.56 Ga. Following this time period, dynamo activity will be permitted but in a potentially episodic and weakened state. As noted by previous studies, the standard magnetic field scaling relations cannot account for the Earth-like field strengths that existed during the high-field epoch. The origin of this discrepancy is not yet understood, and the exact field strengths will thus not be used to constrain our models.
4. Model Predictions
4.1. Melt ProductionA clear observable to be matched by thermal evolution models is the duration and volume of extrusive vol-canism. Figure 4 shows the melt production (left column) and total volume (right column) for the nearside (top row) and farside (bottom row) hemispheres.
The first observation is that model 2 cannot account for the observed long lasting volcanic activity on both hemispheres of the Moon. This model has the highest heat source concentrations in the feldspathic crust and thus the lowest concentrations in the mantle. A global peak in magma production is observed at both 4.4 and 4 Ga, but nearside volcanism stops at 3.5 Ga, and farside volcanism stops at about 3.9 Ga. The short duration of magma production for this model is to be expected; as with more heat sources present in the crust, it is easier for heat to escape to space. In order to explain the long duration of volcanism on both hemispheres of the Moon, the abundance of thorium must be greater than the value for this model, 7.8 ppb, given our initial temperature profile.
Model 3 is slightly better than model 2 in explaining the duration of volcanism but only for the nearside hemi-sphere. In comparison to our reference model 1, this model is defined by having a higher heat production in the PKT and thus a slightly lower heat production in the mantle. With a mantle concentration of 23.8-ppb Th, this model has the second lowest concentration of thorium of all our models. The duration of farside volcan-ism is found to be the same as that of model 2. However, as a result of the enhanced heat production in the PKT, nearside magmatism can be extended until about 2.5 Ga. Thus, in order to explain the duration of farside volcanism, given our initial temperature profile, the thorium content of the farside mantle must be greater than 23.8-ppb Th. We note that even though model 3 has a lower concentration of heat sources in the mantle
Figure 4. Model predictions for magmatic activity. The left column shows the melt production, and the right column
shows the total cumulative melt generated. The top and bottom rows are for the nearside and farside hemispheres, respectively.
than model 1 (40% less), the amount of melt generated is about 15% larger. This illustrates the importance of top-down heating of the mantle by the heat source-enriched PKT.
The remaining three models have similar magmatic evolutions. These models include model 1, with a uniform mantle composition, and models 4 and 5, with enhanced heat production in the mantle beneath the PKT. For these models, nearside volcanism extends up to about 2–2.5 Ga, whereas farside volcanism extends up to about 3–3.5 Ga. These durations are slightly shorter than the observations of nearside and farside volcanism extending to about 1 and 2.5 Ga, respectively, but this difference could probably be accounted for by using different model parameters, such as a different solidus or initial temperature profile.
We note that the total volume of melt generated by our models greatly exceeds estimates of the volume of extrusive mare basalts by a factor of about 100. If the absolute values of total magma generated are accurate, this would imply that a large fraction of melt never reached the surface. The melt might never have separated from the mantle source, it could be present as intrusions in the crust, or it could have pooled at the crust mantle interface. Alternatively, it is also plausible that the amount of melt generated could be an artifact of using an inappropriate solidus for the lunar mantle, and how the solidus changes with the extraction of melt. We note that while other thermal evolution models report the temperature evolution relative to the solidus temperature (e.g., Evans et al., 2014; Zhang et al., 2013; Zhong et al., 2000; Ziethe et al., 2009), they have failed to report the total amount of melt generated in their simulations.
Figure 5. Concentration of Th as a function of time in the Moon. This simulation corresponds to model 5, and each
image is for a plane that passes through both the rotation axis and center of the Procellarum KREEP Terrane. The time of the simulation is noted in gigayears in the center of each image.
Finally, we note that even though we prescribe the initial heat source distribution in the mantle, it is advected by mantle flow throughout the simulation. Figure 5 shows the result of this advection for model 5. As initial convection starts, the enrichment in the mantle underlying PKT is pushed toward the upper mantle and to the edge of the PKT. Convection then brings some of this material to deeper depths and mixes somewhat with the more depleted mantle. The enriched mantle remains largely beneath the PKT during the main phase of mare volcanism, and a small quantity of enriched mantle materials makes it to the farside hemisphere but only after about 3 Ga. At the present time, the most highly enriched mantle is located at shallow depths at the edge of the PKT.
4.2. Surface Heat Flow
A second important observable is the surface heat flow. Following Wieczorek and Phillips (2000), we plot the predicted heat flow as a function of distance from the center of the PKT in Figure 6, along with the observa-tional constraints at their approximate distances. Note that while the “center” and “edge” of the PKT is well defined in our numerical model, they are much harder to define based solely on the Th map of Figure 1. The measurements plotted on the horizontal axis should thus be considered uncertain by approximately 10∘ or more.
The first observation is that all models predict a heat flow less than about 6 mW/m2far from the PKT. This
is considerably lower than the Apollo 17 heat flow measurement of 14 mW/m2but is compatible with the
Figure 6. Predicted surface heat flow as a function of distance from the
center of the PKT and observational constraints. The observational constraints are, from left to right, the Apollo 15 (black/green), Apollo 17 (black/green), and Diviner radiometer (gray) measurements. For the Apollo measurements, the values plotted in black are from Langseth et al. (1976), whereas those in green are the corrected values of Warren and Rasmussen (1987). PKT = Procellarum KREEP Terrane.
and 3–5 predict heat flows far from the PKT of about 4 mW/m2, and
only model 2, which has 1-ppm thorium throughout the entire felds-pathic highlands crust, has a slightly greater value of about 6 mW/m2. We
note that the vast majority of thermal evolution models that have been proposed for the Moon have failed to report the predicted present-day heat flow (e.g., Evans et al., 2014; Zhang et al., 2013; Zhong et al., 2000; Ziethe et al., 2009).
As opposed to the feldspathic highlands, the predicted heat flow within the PKT varies more dramatically among the different models. Models 1, 2, and 4 all have 5.7-ppm thorium within the entire PKT and predict a max-imum heat flow of about 24 mW/m2. In contrast, model 3, which has a
thorium concentration of 8.2 ppm in the PKT, predicts a maximum heat flow of about 33 mW/m2. Model 5, which has an 8.2-ppm thorium
concen-tration in the central portion of the PKT, also has a maximum heat flow of about 33 mW/m2, along with a step at 18 mW/m2between the edge of
the inner and outer portions of the PKT. Though model 5 appears to fit the Apollo heat flow measurements the best, given the uncertainty in where the Apollo measurements are located with respect to the center and edge of the PKT, combined with uncertainty in the composition of the PKT, it is difficult to favor one model over the other.
4.3. Curie Temperature Depth Evolution
To test whether lateral variations in crustal magnetization and strength of the present-day magnetic field could be related to different temperature evolutions of the crust, we computed the depth of the Curie temperature of iron metal as a function of time. In Figure 7, we show the depth of the Curie temperature isotherm (1,053 K) for each of our five models in the center of the PKT, as well as for a point diametrically opposed within the Feldspathic Highlands Terrane.
The first observation is that the Curie temperature depth evolution beneath the highlands is nearly the same for all models. The average thickness of the Moon’s crust is somewhere between 34 and 43 km (Wieczorek et al., 2013) and could be locally as high as about 80 km for some regions on the farside hemisphere. From
Figure 7. Depth of the isotherm corresponding to the Curie temperature of
iron metal (1,053 K) beneath the center of the Procellarum KREEP Terrane (solid lines) and the point antipodal to this province (dashed lines).
this figure, the entire crust of the Feldspathic Highlands Terrane is pre-dicted to have cooled below the Curie temperature of iron in less than 100 Myr for models 1 and 3–5. For model 4, which cannot account for the duration of lunar magmatism, this time interval is extended to about 150 Myr. Thus, as noted by Wieczorek (2018), if the weak magnetic fields that are observed throughout the highlands crust are the result of ther-moremanent magnetization acquired in the presence of a dynamo field, a dynamo must have been operating during the first 100 Myr of lunar evo-lution. This dynamo activity predates the oldest paleomagnetic evidence for a dynamo at 4.25 Ga (Garrick-Bethell et al., 2009, 2017).
The situation beneath the PKT, however, is completely different than beneath the feldspathic highlands crust. In this region, where the average crustal thickness is about 26 km, cooling below the Curie temperature of iron metal is dramatically extended in time. For our models that use tho-rium concentrations of 5.7 ppm within the PKT crust (models 1, 3, and 4), the entire crust cools below the Curie temperature of iron by about 3.9 Ga. For our models 2 and 5, which have thorium abundances of 8.2 ppm in the PKT, cooling below the Curie temperature is extended by about 1.2 billion years, until about 3.3 Ga.
Paleomagnetic analyses of lunar rocks show that the strength of the dynamo decreased by an order of magnitude after about 3.56 Ga. Thus, for a period of about 260 Myr, the deepest portion of the crust within the PKT could have cooled through the Curie temperature of iron metal in the
Figure 8. Evolution of the lunar core over time. (from top left to bottom right) Core-mantle boundary temperature,
core-mantle boundary heat flow, inner core size, and power available for dynamo generation. For the last two plots, the heat flow and power necessary to sustain dynamo activity are plotted by a gray box and horizontal-dashed lines, respectively.
presence of a weak (or absent) field. This would lead to weak magnetizations for the deepest crust and, as a result, weaker present-day surface magnetic field strengths. Nevertheless, our simulations predict that only a small portion of the crust would have escaped being magnetized during the epoch of high-field strengths. Only a few kilometers of crust should have cooled through the Curie temperature after this time (on the order of ∼10% of the local crustal thickness), and this might not be sufficient to account for the weak magnetization of this province.
We note that there are three factors that could have decreased the magnetization of the upper portion of the PKT crust that cooled during the epoch of high-field strengths. First, iron metal retains a stable thermorema-nence below a range of blocking temperatures, of which the highest temperature is the Curie temperature. The low-coercivity fraction of the iron metal grains could thus have cooled through its magnetic blocking temperatures later in lunar history than assumed in Figure 7 (e.g., Garrick-Bethell & Weiss, 2010). Second, the prolonged high temperatures in the crust could potentially have led to some portion of the remanent mag-netization viscously decaying over geologic time (see Garrick-Bethell & Weiss, 2010). Lastly, as described in section 5.1, it would be possible to keep the temperature of the deepest crust above the Curie temperature for a longer period of time if the KREEP-rich materials were preferentially located in the deepest crust. 4.4. Core Evolution and Dynamo Generation
The last aspect of our models that will be discussed is the evolution of the core and the duration over which it can power a dynamo. In Figure 8, we plot the relevant model outputs over time, which include the temperature
of the core-mantle boundary, the radius of the solid inner core, the heat flow at the core-mantle boundary, and the power available for dynamo generation due to chemical buoyancy. All simulations use a bulk sulfur abundance of 4 wt.% for the core, corresponding to an intermediate value to that studied in Laneuville et al. (2014) and Scheinberg et al. (2015).
The temperature evolution of the core-mantle boundary shows that the core cools quickly from about 2,000 to 1,750 K during the first 700 Myr of evolution. After 3.5 Ga, model 2 cools monotonically to a final temperature of about 1,580 K. For the other models, the temperature remains roughly constant from 3.7 until 2 Ga, after which the cooling rate increases. The size of the solid inner core is plotted in the lower left image. In all cases, a solid inner core nucleates early at about 4.25 Ga, regardless of our distribution of heat sources in the crust and mantle. The inner core grows rapidly to a radius of about 250 km at 3.7 Ga, after which, core growth is significantly reduced, reaching a final size of about 280–290 km. The final inner core radius is about 85% of the total core size (which is about 60% of the core mass).
The top right panel shows the heat flow at the core-mantle boundary, as well as an estimate of the amount of heat that can be conducted along the core adiabat (which is between 7 and 8 mW/m2for the range of
temperatures during the simulation and the parameters listed in Table 4). When the core-mantle boundary heat flow is greater than the heat that can be conducted along the adiabatic, a dynamo could be gener-ated by thermal convection. All models predict that a thermal dynamo could have started early, at about 4.4 Ga, lasting for several hundred Myr. For our model 5, thermal convection could have powered a dynamo until about 4 Ga, whereas for the other models, the thermal dynamo could have lasted slightly longer, until about 3.7 Ga.
The lower right panel shows the power available for dynamo generation, which includes the buoyancy con-tribution from inner core crystallization. Whenever this power is greater than zero, a dynamo could have operated. This image shows that when one includes the buoyancy contribution from inner core crystalliza-tion, the dynamo can be extended by about 200 Myr in comparison to thermal convection alone. For models 4 and 5, dynamo generation ceases at about 3.7 Ga, whereas for models 1 and 3, dynamo activity continues up to 3.6 Ga. For model 2 (which cannot account for the longevity of mare basaltic volcanism), dynamo activity extends until about 3.5 Ga.
Our simulations suggest that a core dynamo should have ceased at about 3.7–3.5 Ga. This time period corre-sponds closely to when paleomagnetic analyses show the strength of the dynamo field to have deceased in strength by an order of magnitude or more. This implies that the high-field epoch of lunar magnetism could have been the result of a combination of core crystallization and thermal convection. Following this time period, our simulations suggest that a dynamo could have perhaps have been reactivated later for a short period of time. In particular, for our models 1 and 3–5, the power available for dynamo activity grows from about 3 to 1.5 Ga, at which point the power almost crosses the threshold for dynamo activity. A single paleo-magnetic analysis implies that the lunar dynamo was operating in a weakened state at some point between 2.5 and 1 Ga (Tikoo et al., 2017), and this is potentially consistent with our model that predicts a peak in the power available for a dynamo during the same time period. Episodic late dynamos were also observed in the work of Scheinberg et al. (2015).
5. Discussion
5.1. Distribution of Heat-Producing Elements
Five different models for the distribution of heat-producing elements in the Moon have been constructed, and the implications of these have been tested using several constraints. The models considered different depth distributions of heat production in the highland crust, different distributions of heat production within the PKT, and different abundances of heat production within the mantle beneath the PKT and Feldspatic Highlands Terrane. Most models satisfy one or more of the observation constraints, but one, model 2, appears to be inconsistent with several aspects of lunar evolution.
Model 2 distinguishes itself in that it makes the assumption that the abundance of heat-producing elements in the entire highlands crust is the same as the surface. By placing more heat production in the crust, by mass balance, less is placed in the mantle. As a result, this model cannot account for the duration of volcanism on either the nearside or farside hemispheres. Furthermore, the heat flow predicted far from the PKT is marginally
higher than the upper bound predicted by Diviner measurements (Paige & Siegler, ). When compared with our other models, this implies that the bulk abundance of heat-producing elements in the highland crust must be less than the surface values. The enhanced abundances at the surface are likely a result of a small quantity of contamination derived from basin ejecta, mare basalts, and meteoritic materials.
Our model 3 was designed to test the consequences of having a higher abundance of heat production within the PKT. Here a value of 8.2-ppm Th was used as opposed to 5.7-ppm in models 1, 2, and 4. As a result of the uniform enrichment of heat production within the PKT, by mass balance considerations, the abundance of heat production in the mantle was reduced. The duration of mare volcanism was thus reduced, lasting only until about 2.5 Ga on the nearside and 3.8 Ga on the farside. This shortened duration of volcanism is not consistent with the observations, which predict volcanism until about 1 Ga for the nearside and 2.5 Ga for the farside.
The remaining models 1, 4, and 5 are largely consistent with the duration of volcanism on the Moon. These models predict volcanism on the nearside until about 2 Ga and on the farside until about 3 Ga. These models predict that a dynamo could have been powered by thermal convection and core crystallization until about 3.6 Ga, which is when paleomagnetic analyses show the dynamo field strength decreased by more than an order of magnitude. These models are also broadly consistent with the heat flow constraints, recognizing that it is difficult to provide a distance to the center of the PKT for the Apollo measurements.
Models 1 and 4, however, cannot account for the existence of the region of low crustal magnetization within the center of the PKT. These two models predict that the entire crust would have cooled below the Curie temperature of iron metal before 3.9 Ga, during which time paleomagnetic analyses predict strong sur-face field strengths. Only model 5, which has enhanced heat production within the central portion of the PKT, predicts that some portion of the PKT crust could have escaped cooling in the presence of a strong field. In particular, several kilometers of the deepest crust are predicted to have cooled after the dynamo field strength decreased at about 3.56 Ga, and this portion of the crust is predicted to have a relatively weak magnetization.
Though of few kilometers of weakly magnetized crust is probably not sufficient to account for the magnitude of the magnetic low, there are several ways in which cooling of this province could be even further delayed. First, as shown in Laneuville et al. (2013), the manner by which KREEP-rich materials are distributed with depth in the PKT plays an important role on the cooling of this province. If the heat-producing elements were con-centrated at the base of the crust (as opposed to uniformly distributed through the crust as in our models), cooling would be prolonged. Second, our models do not consider the thermal effects of magma transport through the crust, and this could have acted to keep the central portion of the PKT warmer than our model predicts. Lastly, intrusive magmatism could perhaps be an important process in the central portion of the PKT, and a large portion of these magmas could have been emplaced and cooled after the dynamo field strength decreased.
Taken together, the above considerations suggest that model 5 fits the observations the best. This is satisfying, as the distribution and abundance of heat-producing elements for this model were chosen based on remote sensing observations, sample analyses, and magnetic field observations. This model predicts the existence of a central portion of the PKT with enhanced heat production (when compared to the rest of the PKT), it predicts that the abundance of heat-producing elements in the Feldspathic Highlands Terrane is less than the sur-face abundances, and it predicts that the mantle beneath the PKT is moderately enriched in heat-producing elements when compared to the mantle beneath the highlands.
5.2. Lateral Variations in Isotopic Closure Time
We have shown that the depth of the Curie isotherm for iron metal varies dramatically as a function of time and space. Whereas the entire highland crust cooled through this temperature during the first 150 Myr of lunar evolution, within the PKT, cooling was prolonged for more than a billion years. Similar to the Curie isotherm of iron metal, spatial and temporal variations in the depths of isotopic closure isotherms may be important for interpreting radiometric dating results as well.
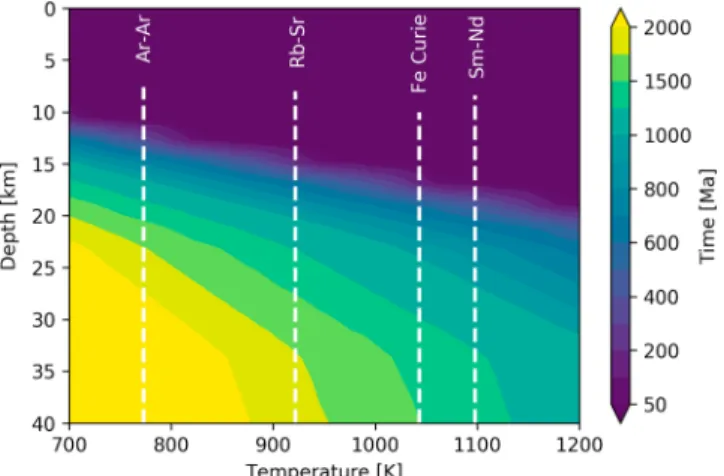
Figure 9. Time to reach a given temperature at a given depth in the center
of the Procellarum KREEP Terran for model 5. Vertical-dashed lines correspond to the isotopic closure temperatures of the40Ar-40Ar,87Rb-87Sr,
and147Sm-143Nd systems (Dodson, 1973) and the Curie temperature of
iron metal.
In Figure 9, we plot the time it takes to reach a given temperature at a given depth at the center of the PKT. Superposed on this image, we plot the isotopic closure temperatures for the40Ar-40Ar (765 K),87Rb-87Sr
(914 K), and147Sm-143Nd (1,090 K) systems (Dodson, 1973), along with the
Curie temperature of iron metal. For the Ar-Ar system, isotopic closure over the upper 10 km of the crust can take a few hundred million years after lunar formation, whereas for the deepest crust, it is predicted to take more than a billion years. For the Rb-Sr system, isotopic closure occurs at similar times: hundreds of millions of years for the upper 10 km of the crust and about 1.5 billion years for the deepest crust. Closure for the Sm-Nd system occurs somewhat more rapidly. Here the upper 15 km of the crust passes through the closure temperature in the first 200 Myr, whereas the deepest crust reaches the closure temperate about 1 Gy after lunar formation. As discussed by McCallum and Schwartz (2001) and McCallum et al. (2006), prolonged cooling of rocks within the PKT could give rise to different Rb-Sr, Sm-Nd, and Pb-Pb ages for the same sample.
The Imbrium impact occurred within the central portion of the PKT at about 3.85 Ga (e.g., Stöffler & Ryder, 2001), and ejecta from this basin have been sampled at many, if not all, of the Apollo landing sites (e.g., Haskin et al., 2003). Our results imply that care must be taken when interpreting the radiogenic ages of rocks exca-vated from the Imbrium impact. Rocks derived from the upper portion of the crust could yield radiometric ages that are hundreds of million years younger than their crystallization ages, whereas the deepest rocks could have passed through their isotopic closure temperatures only after being excavated by the Imbrium impact. Differences in isotopic closure times as a function of location on the lunar surface, depth in the crust, and timing of excavation by impacts may help explain some paradoxical results concerning the ages of the anorthosites and Mg-suite rocks (see Borg et al., 2015, 2017).
5.3. Model Sensitivities
All models presented here use the same initial temperature profile, which corresponds to the “intermediate” profile used in Laneuville et al. (2013). The simulations are too numerically demanding to test all possible initial conditions, but we know from previous work that different initial temperature profiles could change the melt production histories. Regardless, caution should be used when interpreting the absolute melt volumes, given that the solidus of the lunar mantle is not known with certainty nor is the ratio of intrusive to extrusive volcanism.
Our simulations predict similar histories for the lunar dynamo, with a dynamo starting early, turning off close to 3.6 Ga, and perhaps being reactivated for a short time period close to 2 Ga. This behavior is relatively insen-sitive to the variations among our five models. Nevertheless, it should be emphasized that other models have used drastically different initial conditions and assumptions for the distribution of heat-producing elements, and these scenarios could lead to different dynamo histories. Models that start with a dense ilmentite layer enriched in KREEP-rich materials around the core can delay the onset of dynamo activity by about 200 mil-lion years (e.g., Zhang et al., 2013), though recent constraints on viscosity of ilmenite make such a scenario less plausible (Zhang et al., 2017). Indeed, a lower viscosity for the ilmenite cumulate layer allows for a more efficient cooling of that layer. The reduction in heating rate also reduces buoyancy gain due to thermal expan-sion and therefore the potential for instability. Zhang et al. (2017) model results suggest a relatively stable partially molten ilmenite bearing cumulate layer that has surrounded the lunar core to the present day. We note that these and other models (such as Zhang et al., 2013; Zhong et al., 2000; Ziethe et al., 2009) have not attempted to account for the Apollo or Diviner heat flow measurements, which, in our opinion, any thermal evolution model should strive to satisfy.
Finally, we note that recent magnetohydrodynamic simulations have demonstrated the existence of a hys-teresis effect for liquid metals in rapidly rotating spheres (Kaplan et al., 2017). This work shows that subcritical flow could be maintained longer than expected and therefore possibly extend the duration of purely ther-mally driven dynamos. Nevertheless, for current magnetic field scaling laws, the magnetic field amplitude