© EDP Sciences 2002
Buying behavior study with basket analysis:
pre-clustering with a Kohonen map
P
IERRED
ESMET*
Abstract. – From the products bought, by basket analysis we seek to infer interest, values and choice criteria and predict purchase probabilities for other products. This statistical approach relies on the existence of a few general under-lying clusters which enables the prediction of general and specific buying behavior. Compared to traditional clustering methods, a Kohonen map, a neural network, allows the projection and clustering of data for which the proximity presents a meaning or interest. Beyond the interest of these neural networks for graphic repre-sentation, this article suggests different ways of articulating general and product-specific typologies which are illustrated on a real database of buyers’ behavior in a book club. The results clearly show a significant improvement with regards to the results obtained with current models using either RFM segmentation or logistic regression.
Classification Codes: M31 (Marketing).
Introduction
Segmenting a marketing target makes it easier to adapt the offer (price, service) and the communication to the economic value of the segment and to their sensitivities. There are many useable variables to separate the groups and they can be classified into different categories: attitudes, socio-demographic characteristics, geographical, frequentation of the media and distribution channels, relationship with the company and purchasing behavior (Blattberg and Sen, 1974). This last group of variables has become the object of a growing interest because the information allies availability, precision, and certainty with a real behavior on behalf of the target (Manchanda, Ansani and Gupta, 1999). The interest for buying behavior is further strengthened when the decision-maker no longer has to manage a few products, as a producer situation at the heart of the traditional marketing approach, but a large number of products, even a full distributor’s assortment. Basket analysis consists in studying the products bought simultaneously by the cus-tomer (Julander, 1992). The basket can be conceived at various levels of aggregation:
* Prof. Pierre Desmet, University Paris IX-Dauphine, place du Maréchal de Lattre de Tassigny, 75775 Paris Cedex 16, France. E-Mail: [email protected]
according to the time aggregation (a specific shopping trip or the products bought over a given period), according to the product aggregation (an item or a product class) or according to the product characteristics (brand, promotional references, price zones). Furthermore, the analysis can be aimed at the products or the client. When the interest is oriented towards the product, analysis of simultaneous purchases allows the identifica-tion of the relaidentifica-tionship between the demands of the product (independence, substituidentifica-tion, complementarity) and, at the same time, eliminates simple co-incidence (i.e. simulta-neous purchase of products because of their buying frequencies or the path followed during a shopping trip). From a consumer perspective, the question is to determine specific preferences for goods, brands or product characteristics and media captured in the database by binary variables. It can also be used to predict purchase probability for a product, and this research concentrates on this point.
One difficulty comes from the fact that this issue concerns two levels of decision. At a high, strategic, level the manager needs a general understanding of buying behavior and a stable and meaningful segmentation. But at a low tactical level, the objective is to obtain the most accurate prediction for the buying behavior of a product or a commercial offer, the overall or historic consistency of the segmentation frame being no longer an important criterion. Currently, the recommended solutions are: (1) the segregation of the two points of view in different approaches: segmentation and prediction being two different steps or (2) their integration in the same methodology. In the first solution, segmentation, more precisely clustering, is done on a selection of variables after reduc-tion of the dimension of the number of variables by factor analysis. There are numerous criticisms of the traditional approach which concern the method itself as well as its adap-tation to the objectives. Indeed, the limits of the cluster analysis algorithms are well known (instability, a priori choice for the number of groups, large differences in group sizes) and, above all, a simplistic segmentation frame, containing only a few segments to ease understanding. This frame cannot be used at the tactical level to forecast buying behavior and penetration rate for very different products.
In the second more recent approach there is a search for maximization, simultaneously or alternatively, of the two criteria, predictive capacity and segment consistency, by using sophisticated techniques and specific algorithms, (Aurifeille, 2000; Wedel and Kamakura, 1997). This approach gives priority to a more tactical view i.e. to the predic-tive ability regarding the demand for a product or a particular offer and does not provide a stable segmentation frame.
Within the framework of the traditional approach, it is suggested that two steps be kept, segmentation then prediction, and the proposal of two levels of segmentation for successively reaching an understanding of behavior and obtaining a good prediction of the buying behavior for a given product. The first segmentation needs to be very stable and contains a large number of segments, which in a second segmentation are recom-posed into some larger target segments. The first level insures the stability and consist-ency needed for the definition of marketing segments, which cannot be guaranteed by traditional cluster analysis algorithms.
The desired characteristics of the first segmentation are not suitable to the traditional, hierarchical and nodal, clustering methods. Cluster instability due to the absence of prox-imity constraints is associated with poor prediction power. Furthermore, the nature of the
basket analysis problem induces a large number of products, and so the size of the distance matrix (product × product) is potentially very large. These characteristics points to the use of a solution based on neural networks such as the self-organizing maps (SOM or Self-Organizing Map) developed by T. Kohonen which organize the data as cells in a large space with a spatial coherence: nearby segments have values closer than distant segments.
The rest of the article is organized as follows: in the first part presents the methodology and recalls the principle of the Kohonen map, and in the second part illustrates the use and benefit of the methodology by a marketing application on the customer database of a book club.
1. Methodology
The methodology has two steps, first segmentation and secondly, the use of predictive models using the segment-related information. The segmentation is obtained by a self-organizing neural network, Kohonen map, applied to the basket information and the basic principles of this clustering method are presented first, which offers the specific advantage of imposing a relationship constraint between adjacent segments. The first segmentation can be followed by a second one designed to reduce the effects of small sizes for segments. The various methodological steps are described and then the evalua-tion criteria clarified.
1.1. The Kohonen maps
A Kohonen map, or self-organizing map, is a set of neurons organized according to a fixed net of pre-determined size. Each neuron is defined by two pieces of information: on the input layer by its composition or vector of weights and on the output layer by its spatial coordinates. On the output layer, the neurons are connected to their neighbors so that similar neurons at the entry level will be closer to one another on the output layer than the more dissimilar neurons. The connection structure and the distance function determine the topology or structure of the map. The neurons are organized in a signifi-cant bi or tri-dimensional order in. Kohonen (2000) indicating that, in this sense, an SOM network could be interpreted as a similarity graph and a topological diagram.
According to Patterson (1986), this type of competitive neural network completes a data compression and a projection and, possibly, when supervised, a recognition: for each vector, or entry pattern, a neuron index is associated as well as its vector prototype. It is particularly suitable when data are numerous, and redundant with spatial proximity and when the distribution of the initial variables is unknown, i.e. in the absence of a structural model. By imposing the spatial consistency of the neurons, a specific charac-teristic of SOM compared to other self-organized competitive networks, it protects the continuity and the relationship of the groups.
1.2. Methodological steps
Consumer buying behavior, which corresponds to the expression of the preferences for products coming from the members of the family, is expected to be coherent. So, there
are numerous variables describing purchases which can be correlated either directly or indirectly by an effect of interaction.
The main idea of the methodology is to first establish a map containing a large number of segments based on basket data to help in the understanding of the associations between the products. It is one of the strengths of SOM that it allows the use of very expressive graphic representation, which can help in choosing the explanatory variables or representative behavior. In addition to this purely descriptive use, the intuition at the origin of this work is that this basket information is rather stable and could be used as a basis to support the development of specific models for each tactical problem studied. So a meta-segmentation of the segments of the basket analysis map would be determined by product.
The methodology consists of the following steps:
– Basket analysis: Analysis of the descriptive variables of buying behavior with a neural network of the Kohonen map type. This is done with a structure (sheet, trellis, torus) which must be pre-determined. Furthermore the choice of dimensions for the output layer, a 10 × 10 or a 15 × 5 trellis for example, influences the quality of the projection significantly and is a question to be solved.
– Meta-segmentation: Constitution of meta-segments, by putting together neighbouring Kohonen prototypes, to assure a small number of customers in each of the types and to obtain a better predictive power. The nodal clustering analysis method (K-means) used imposes the a-priori choice of the number of groups to establish. This decision is taken automatically by the minimization of the classification error by iterative clustering (from 3 to 25 groups).
– Predictive model: A logistic model, estimated by regression, will take into account the information provided by the former steps either under the form of supplementary explanatory variables, for which the value is the observed purchase frequency, or by the estimation of a separate model for each meta-segment.
Compared to the methodologies looking at the simultaneous maximization of the predictive capacity and segment homogeneity, the main difference lies in the number of groups. In these methods, the number of groups is determined a priori: so it varies according to the problem studied. Here, what is very much sought is the stability of the first segmentation by Kohonen map, corresponding to a managerial perception/under-standing of the market and consumer behavior. The main disadvantage is the absence of information on the optimality of the analysis used with regard to the predicted variables.
1.3. Criteria for comparison
Comparison of the efficiency of the methodology is carried out using two criteria: predictive validity and the stability of results obtained on two samples (work and test). Observed purchase frequencies are compared for 20 quintiles (with a 5% step) ordered by decreasing frequencies.
– The predictive validity is measured by the discrepancy between the true buying percentages in the work and test samples compared to a naïve model for which every quintile has the same average buying frequency. The greater the distance between the frequencies the more the model is capable of isolating customers with very low/high
buying frequencies, with the managerial interest being to obtain a maximum number of purchases for a minimum number of commercial messages sent.
– The stability of results is measured by the distance between the buying frequencies observed by quintile for the working and test samples. A large number of parameters and very precise adjustment on the working sample can, in fact, indicate a local adaptation and damage the predictive quality of the sample test.
In both cases, it is the square root of the sum the squares of the discrepancies that serves as an indicator (RMSE).
2. Illustrative Application
The steps of the proposed methodology were applied to the issue in a correspondence book club where the marketing manager had to work out a model to predict response to the sale of a new book “Art History of Florence” on the basis of pieces of information stored in a database regarding the previous buying behavior of other books.
2.1. Data description
The database, graciously supplied by the Direct Marketing Association whose help is hereby acknowledged, contained information about the orders of 50,000 customers (date, article bought, demographic variables...). The sample was broken down in a random manner into two sub-samples: a working sample of 20,000 and a test sample of 30,000 customers. These two samples presented no significant difference for the variables used. The variable to predict is the purchase (binary variable) of a book Art History of Florence for which the buying frequency was 9%. The “basket data” are counts for the number of books bought in each of seven categories of book: dictionaries and reference books, cookbooks, children’s books, teenagers’ books, art books, Do-It-Yourself and geography books. In addition, few other descriptive variables will be used for the predic-tive model: a binary demographic variable (Male = 1 / Female = 0), and three general descriptive variables of the relationship (recency of the last purchase, the frequency and amount of the purchases over the period studied), these variables drive the traditional Recency-Frequency-Monetary segmentation.
An exploratory factor analysis (Principal component analysis) of the basket data frequencies, showed that the first factor, explaining more than 40% of the inertia, is associated to the general activity (the buying frequency for all products) and that the following axes represented the various book categories with a decreasing percentages of inertia. As the Kohonen map corresponds to a projection on the first two dimensions only, this projection could correspond to a significant loss of the initial information.
The investigation of the interactions between the basket data (book categories) and the purchase of the book on Art History of Florence by the CH-AID software highlighted the major role played by the variable “purchase of art books” confirming the coherence of the customer's behavior. Interaction effects have also been identified between this variable and, initially, the purchase of geography books for the biggest buyers, secondly, recency of the last purchase for the average buyers and, thirdly, the type for the
non-buyers of art books. The purchase of a dictionary or a DIY book could also be associated to a higher book buying frequency for the least active buyers. So basket data could bring interesting information in the predictive model.
2.2. Comparison of the methodologies
To settle the interest of the proposed methodology, two variants of the methodology based on the preliminary determination of a Kohonen map were compared to two clas-sical methodologies (RFM segmentation and Logistic regression).
– RFM Segmentation (model 1) consisted in computing the values of an indicator for groups established by crossing the three RFM variables: recency, frequency and amount of money. The variables recency and frequency were broken down into 5 modalities then crossed. The cells were regrouped if necessary to obtain a minimal number of consumers for each group. An indicator was then calculated by attributing a value to each modality (1, 2, 4, 8, 16 for frequency and 1, 2, 3, 6, 12 for recency). The amount variable refines the indicator by three modalities, each one regrouping a third of the sample. This approach is deterministic. Statistical approaches using a regression model have also been proposed for RFM (Bauer, 1988), however the statistical estimation of the effects does not always allow the interactions between the variables to be highlighted. On this data-base, the deterministic approach is chosen as the reference as it gave slightly higher results to those of the econometric approach while offering a greater simplicity.
– Logistic Regression (model 2): The purchase probability, or score, is obtained by fit-ting a logistic regression with all the explanatory variables (RFM, descriptive variables and basket data) on the purchase of the book on Art History of Florence. This model, known under the acronym FRAT (for Recency, Frequency, Amount and the Type of goods) induces an improvement of the segmentation by way of taking into account the categories of bought products; it should thus have a better predictive power than RFM segmentation which doesn't.
The two other models (models 3 and 4) take advantage of the projection of the basket data carried out with a Kohonen map. The predictive models are both based on a logistic regression with descriptive and RFM variables and basket data are introduced by a variable containing the mean purchase frequency observed on the working sample of the prototype they belong to. These models had two steps: (1) basket data projection with a Kohonen map and (2) logistic regression and they differ in the way prototypes or meta-segments are built.
2.3. Kohonen maps
Kohonen map were defined by the SOM algorithm using MATLAB software and avail-able on the Internet (Vesanto and Alii, 1999). A map was developed from the basket data on the number of books bought in each of seven categories for each customer. The soft-ware determines the neurons weights by a batch treatment starting from an initial config-uration using the first two axes of a PCA. According to the authors this initialization allows a very significant reduction in convergence time compared to a random initializa-tion of the weights.
The quality of the map is appreciated in regard to two indicators, the quantization error (projection) and the topological error.
– The quantization error (or projection error) is the average distance (mean square devia-tion) between the input layer and the prototype at which it has been attributed.
with an input vector and its prototype in the output layer; – The topological error considers the proportion of observations for which the closest prototypes (BMU for best-matching unit) are not themselves closely related. The advan-tage of this measure is that results are easy to interpret and directly comparable between different mapping.
with if the first and second BMU's of are not adjacent units, otherwise zero.
The choices of the structure and the size of the neural network (topology) is an impor-tant question that can cause a structural error if the topology is not adapted to the data structure. Table 1 presents the attempts made to clarify the first choice, that of a struc-ture, in sheet, cylinder or torus. If the topological error of the cylinder was lower than that of the sheet for the large structures, the sheet structure was always the best for the quantization error whatever the size of network (5 × 5, 10 × 10 and 15 × 15). So it was the sheet structure with a hexagonal relationship between the cells, rather than oblong, that was retained so as to have a greater number of connections between the neurons in the output layer.
The increase in the size of the structure allowed a specialization of the neurons but led to a decline in the number of observations for every prototype. Different maps, both by their size (4 to 900 neurons) and by their symmetric or non-symmetric structure, were estimated and the results presented in Table 2. For example, a 5 × 10 sheet of 50 neurons has values of 1.560 for the quantization error and 0.061 for topological error.
TABLE 1. Quantization and Topology errors according to configuration. Spatial structure of neurons
Size (Nb neurons) Average error Sheet Cylinder Torus
5 × 5 QuantizationTopology 1.7000.017 1.7250.046 1.8260.122 10 × 10 QuantizationTopology 1.4360.105 1.4410.075 1.4920.230 15 × 15 QuantizationTopology 1.2270.074 1.2280.049 1.2610.182 εq 1 N ---- Xi–mc i=1 N
∑
= Xi mc εt 1 N ---- u X( )k k=1 N∑
= u X( )k = 1 XkIf the mean squared errors tended to decrease with the number of neurons, the structure has also a significant effect because, for example, the quantization error of a structure of 150 neurons in 15 × 10 was lower than that for a larger structure of 200 neurons in 20× 10. As far as is known, there is no particular rule for the choice of the structure and a parsimonious structure (5 × 10) was chosen with more neurons on the second dimen-sion since it can be observed that the quantization error increases when the number of neurons in this direction is reduced.
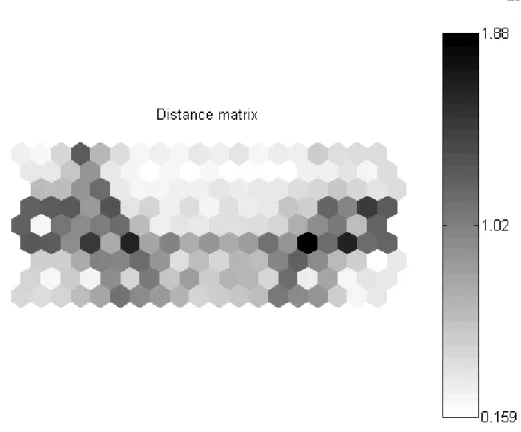
The Kohonen maps lend themselves particularly well to the graphic display of infor-mation. As shown in Figure 1, a projection in a supplementary variable of the predictive variable shows the location of the segments with high buying frequencies. The constraint of contiguity gives a behavioral coherence to the closest segments and facilitates an understanding of the behavior. The comments made when looking at the results of the preparatory techniques (PCA and CHAID) appear clearly: the buying frequency is higher at the bottom of the graph (frequent buyers) than at the top, and thus the first fac-torial axis is found on the vertical axis.
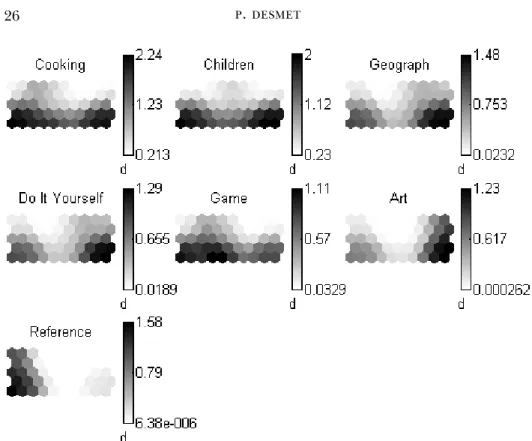
The results are presented in a graphic form. Figure 1 is the Kohonen map for the output layer. The indexation of the colors allows the identification of the zones of the map where the distance between the neurons is small (whiter color) or large (darker color) and, thus, giving a first visual approach to cluster analysis. Figure 2 projects every variable of the buying profile in the output layer space allowing the localization of the high values of the variables (darker color) as well as their closeness. Figure 3 illustrates every output neuron, positioned in the space, on the level of each variable of its input vector. The interpretation of the map is therefore made easier and shows that the small buying frequencies for the book are situated mainly at the right-hand side of the graph, whose purchases are concentrated on the dictionaries.
TABLE 2. Projection and Topology errors for a sheet.
Size (Nb neurons) Structure Errors Size (Nb neurons) Structure Errors
Quantization Topology Quantization Topology
4 2 × 2 2.069 0.000 150 15 × 10 1.291 0.157 9 3 × 3 1.939 0.020 10 × 15 1.341 0.050 16 4 × 4 1.785 0.017 200 20 × 10 1.308 0.082 25 5 × 5 1.700 0.017 10 × 20 1.232 0.076 50 5 × 10 1.560 0.061 225 15 × 15 1.227 0.074 10 × 5 1.630 0.127 400 20 × 20 1.091 0.116 75 15 × 5 1.481 0.130 625 25 × 25 0.824 0.077 5 × 15 1.453 0.052 900 30 × 30 0.744 0.106 100 10 × 10 1.436 0.105 20 × 5 1.510 0.101 5 × 20 1.403 0.068
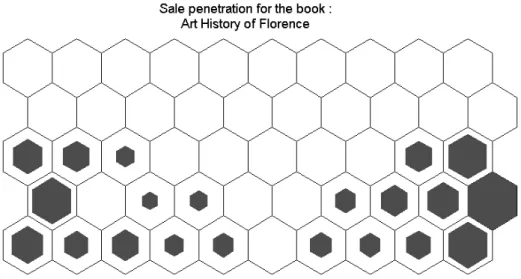
The fundamental assumption is that the typology obtained by this map is stable and represents coherent reading behavior. Beyond this “strategic” interpretation, a “tactical” use is also possible. To identify the potential buyers of the new book, an operation was thus conducted on a sample test. A graphical presentation of the response rate for each cell (Fig. 4) allowed the localization of prototypes having the strongest probability of a response for this specific case (Art History of Florence). Differences in color intensity clearly show that there is an association of the purchase probability for the book with the purchase of books in other categories.
Beyond this graphical presentation, the result of the map is also directly useful in a score model and two variants of the methodology were investigated.
Typology of the 50 prototypes (model 3): The choice of a 5 × 10 sheet structure leads to the definition of the map by the 50 prototypes or weight vectors of the original variables. The segment information is introduced in the predictive model by a supplementary explanatory variable: the average of the observed buying frequency in the working sample.
Typology in some meta-groups (model 4): To reduce the consequences of the errors due to the projection of the patterns on the prototypes, the structure of the map is increased (25× 25). But the number of prototypes has become too large to be able, in a reliable way, to use the observed frequency as an indicator for every prototype. So, the segments
are grouped in meta-segments by K-means clustering on the distances defined by the prototype coordinates in the output space. The SOM sub-routines gives typological nodal clustering (K-means) for different numbers of group and a statistic (statistic of Davies-Bouldin, 1979) to choose the cluster assuring the best conservation of the initial informa-tion. A 15-group analysis minimizes this criteria.
A last possibility, estimation of a model for each group could also be envisaged. This variant of the methodology would be closer to that previously mentioned which tried to optimize the typology and prediction simultaneously. This would lead to a much larger number of parameters.
2.4. Results
The results of the comparative analysis appear in Table 3. The file is ordered on the individual predicted probability to buy the book and then divided into 20 quintiles, each with 5% of the customers. For example, 1.9% for model 1, working sample, means that there is a purchase frequency of only 1.9% for the new book in the quintile with the lowest predicted purchase probability. The global adjustment index is the mean square difference between the observed response and the mean response rate (9%) and the
Fig. 2. Graphical presentation of the location of the various books bought on the prototypes
stability index is the mean square difference between the observed frequencies for the working and test samples.
For this kind of situation, the best predictive model is the one that can identify the cus-tomers with the highest purchase probability. Comparing to a naïve model constantly predicting the average observed frequency (9%) for all the quintiles, the RFM model (model 1) represented a significant improvement with a highest response percentage of 20.8% on the working sample. So, the percentage of buyers in the best quintile is more
Fig. 3. Graphical presentation of the profiles according to their spatial location.
than two times higher the one obtained with a random choice and selecting the 7 best quintiles will increase the response rate from 9% to 14.6%. However, as expected, the results of the RFM segmentation are rather poor with a small increase over the naïve model (global adjustment = 0.221) and not very stable, with a large deviation for the observed frequencies between the samples. It provides the worst result in comparison with other models both from the predictive point of view and for stability.
TABLE 3. Methodologies: Comparative Results.
Quintiles RFM Model Logistic regression FRAT Model
Two steps models with Kohonen maps and logistic regression 50 prototypes
Map 5 × 10
15 groups Map 25 × 25
Model 1 Model 2 Model 3 Model 4
Sample Working Test Working Test Working Test Working Test
1 1.9% 1.2% 0.6% 0.3% 0.5% 0.3% 0.6% 0.3% 2 2.8% 2.3% 1.5% 1.2% 0.7% 0.7% 0.7% 0.7% 3 3.9% 3.4% 1.7% 1.6% 0.9% 0.8% 1.1% 1.0% 4 4.1% 5.8% 1.8% 1.8% 1.0% 1.2% 1.2% 1.4% 5 5.0% 6.0% 1.9% 2.1% 1.4% 1.3% 1.3% 1.5% 6 5.5% 6.6% 3.1% 2.2% 1.6% 1.8% 1.5% 1.5% 7 5.8% 7.1% 3.4% 3.0% 1.7% 2.4% 2.3% 2.1% 8 6.4% 7.1% 3.8% 3.0% 2.6% 2.4% 2.4% 2.5% 9 7.0% 7.8% 4.0% 3.4% 3.4% 3.2% 3.8% 2.7% 10 7.1% 8.2% 4.4% 4.4% 4.1% 3.3% 4.2% 3.2% 11 8.6% 8.2% 5.6% 5.3% 4.3% 4.2% 4.8% 5.0% 12 8.9% 8.9% 6.7% 6.4% 4.4% 5.7% 4.8% 5.7% 13 9.0% 11.3% 7.4% 6.5% 6.1% 6.1% 5.9% 6.7% 14 10.5% 11.8% 7.5% 7.6% 7.3% 6.2% 8.7% 6.7% 15 10.9% 11.8% 8.6% 10.6% 9.5% 8.9% 8.9% 8.6% 16 13.8% 13.9% 10.2% 12.1% 12.2% 11.6% 9.7% 11.1% 17 13.9% 14.3% 14.4% 14.1% 15.5% 15.6% 14.6% 14.4% 18 15.9% 14.7% 19.1% 19.6% 18.8% 20.3% 19.7% 20.9% 19 16.5% 16.0% 26.5% 26.9% 29.5% 28.3% 29.4% 30.0% 20 20.8% 18.6% 47.9% 49.1% 55.5% 56.6% 54.8% 55.3% Global adjustment Stability 0.221 0.086 0.489 0.041 0.576 0.033 0.567 0.037
The results are very significantly improved by logistic regression including frequen-cies per book categories (basket data). For model 2, the purchase frequency of the last quintile is more than two times higher than the one obtained for the RFM model (47.9% on the working sample). The stability is also sharply improved and the distance from the observed frequencies between the two samples is reduced by more than a factor of two (0.041 against 0.086).
As expected, the use of the raw information supplied by the 50 prototypes in model 3 offers a better solution, because this methodology is potentially richer in information. The inclusion of a Kohonen map as a first step, drive to better results than those of the traditional approach (model 2) both from the point of view of the predictive capacity (0.576 against 0.489) and of the stability of results (0.033 against 0.041). Compared to the model with a variable for each book category, the advantage is the introduction of a single supplementary explanatory variable and so less sensitivity to the possible coline-arity of the purchases in various categories because the correlation was taken into account in the prototypes. The distribution of the purchase frequencies shows an evident superiority on the highest quintiles (predicted frequency of 56.6% against 49.1% for the sample test).
However, further tests show that the integration of the variable (purchase frequencies per cell) stemming from the Kohonen map was not sufficient to summarize the whole information contained in the basket profile for the various book categories. When only this variable was introduced into the logistic model, the predictive capacity indicator deteriorated sharply (from 0.576 to 0.395 for the working sample) and the indicator of the stability of results also dropped (from 0.033 to 0.053). This revealed the existence of underlying interactions between the variables that were not sufficiently taken into account by the prototypes coming from the Kohonen map.
Another pitfall of this methodology is that the consideration of detailed information in a large number of prototypes could also lead to an unstable model when the number of observations is too small for some prototypes, which was not the case here. Model 4 is an attempt to avoid this pitfall by building a more stable meta-segmentation on the neurons of a large Kohonen map. In this case, the map that corresponded to a low value of the errors of quantization and topology is (25 × 25) and the 625 prototypes were regrouped in 15 meta-segments. Comparing with model 3, which uses 50 prototypes, the introduc-tion of the average purchase frequency for each segment in an addiintroduc-tional explanatory variable, along with demographic and RFM variables, with a logistic regression (model 4) leads to slightly lower results for the global adjustment and for the stability as well, but is always notably superior to those of the FRAT regression (model 2). Thus it could an interesting alternative when the complexity of the problem requires a large map.
Conclusion
The integration of “basket” variables describing the buying behavior according to the type of products bought constitutes a real improvement in the predictive modeling of buying behavior. However, if the number of products is large, it leads to the search for an analytical indicator that would allow the characterization of profiles of closely related behavior, often called “patterns”. A neural network approach, the Kohonen map,
completes a clustering by offering the advantage of a coherent spatial configuration as well, because closely related “patterns” in the input layer were effectively projected onto closely related neurons in the output layer.
The objective of this empirical study was to confirm the interest of a two-step method-ology: the application of a Kohonen map as an initial step to obtain a stable segmentation for the construction of a predictive model for a specific product in a second step. Infor-mation coming from the segmentation is included as an additional explanatory variable whose values are the purchasing frequency observed on the working sample directly from the prototype or at the meta-segment level.
The spatial segmentation obtained with a Kohonen map-type neural network allowed the buying behavior of the segments for various products to be highlighted graphically. The presented information was closely related to that stemming from factorial analysis but however, with the advantage of nearby groups having closely related behavior, and the disadvantage of a reduced projection on two dimensions whilst the PCA highlighted that other dimensions had significant weights.
Beyond this use of making the global understanding of a market easier, the behavior of which is supposedly coherent in terms of the buying frequency of various products, the potential interest by a predictive use was verified on an empirical application. Even if these results still have to be confirmed on other databases, the empirical application has shown that the proposed methodology led to significantly improved results compared to a standard model of a logistic regression in as far as the prediction of buying behavior is concerned.
References
Aurifeille J.-M. (2000) A Bio-mimetic approach to marketing segmentation: Principles and comparative analysis, European Journal of Economic and Social Systems 14, pp. 93-108. Bauer C. (1988) A Direct mail customer purchase model, Journal of Direct Marketing 2,
pp. 16-24.
Blattberg R.C, Sen S.K. (1974) Market segmentation using models of multidimensional purchasing behavior, Journal of Marketing 38, pp.17-28.
Davies, D.L., Bouldin D.W. (1979) A Cluster separation measure. In: IEEE Transactions on Pattern Analysis and Machine Intelligence, PAMI-1 2, pp. 224-227.
Julander C. (1992) Basket analysis: A new way of analysing scanner data, International Journal of Retail and Distribution Management 20, pp.10-18.
Kohonen T. (2000) The Self-Organizing Map (SOM), http://www.cis.hut.fi
Manchanfa P., Ansari A., Gupta S. (1999) The “Shopping Basket”: A Model for multicategory purchase incidence decisions, Marketing Science 18, pp. 95-114.
Patterson D.E. (1966) Artificial Neural Networks: Theory and Applications. Prentice Hall, New York.
Vesanto J., Himberg J., Alhaniemi E., Parhankangas J. (1999) Self-Organizing Map in MATLAB: The SOM Toolbox. In: Proceedings of the Matlab Conference, November 1999, Espoo, Finland, pp. 35-40.
Wedel M., Kamakura W.A. (1997) Market Segmentation: Conceptual and Methodological Foundations. Kluwer, Dordrecht.