The Value of Capital Market Regulation: IPOs versus Reverse Mergers
49
0
0
Texte intégral
(2) CIRANO Le CIRANO est un organisme sans but lucratif constitué en vertu de la Loi des compagnies du Québec. Le financement de son infrastructure et de ses activités de recherche provient des cotisations de ses organisations-membres, d’une subvention d’infrastructure du Ministère du Développement économique et régional et de la Recherche, de même que des subventions et mandats obtenus par ses équipes de recherche. CIRANO is a private non-profit organization incorporated under the Québec Companies Act. Its infrastructure and research activities are funded through fees paid by member organizations, an infrastructure grant from the Ministère du Développement économique et régional et de la Recherche, and grants and research mandates obtained by its research teams. Les partenaires du CIRANO Partenaire majeur Ministère du Développement économique, de l’Innovation et de l’Exportation Partenaires corporatifs Banque de développement du Canada Banque du Canada Banque Laurentienne du Canada Banque Nationale du Canada Banque Royale du Canada Banque Scotia Bell Canada BMO Groupe financier Caisse de dépôt et placement du Québec DMR Fédération des caisses Desjardins du Québec Gaz de France Gaz Métro Hydro-Québec Industrie Canada Investissements PSP Ministère des Finances du Québec Power Corporation du Canada Raymond Chabot Grant Thornton Rio Tinto Alcan State Street Global Advisors Transat A.T. Ville de Montréal Partenaires universitaires École Polytechnique de Montréal HEC Montréal McGill University Université Concordia Université de Montréal Université de Sherbrooke Université du Québec Université du Québec à Montréal Université Laval Le CIRANO collabore avec de nombreux centres et chaires de recherche universitaires dont on peut consulter la liste sur son site web. Les cahiers de la série scientifique (CS) visent à rendre accessibles des résultats de recherche effectuée au CIRANO afin de susciter échanges et commentaires. Ces cahiers sont écrits dans le style des publications scientifiques. Les idées et les opinions émises sont sous l’unique responsabilité des auteurs et ne représentent pas nécessairement les positions du CIRANO ou de ses partenaires. This paper presents research carried out at CIRANO and aims at encouraging discussion and comment. The observations and viewpoints expressed are the sole responsibility of the authors. They do not necessarily represent positions of CIRANO or its partners.. ISSN 1198-8177. Partenaire financier.
(3) The Value of Capital Market Regulation: IPOs versus Reverse Mergers* Cécile Carpentier†, Douglas Cumming‡, Jean-Marc Suret§ Résumé / Abstract Nous étudions les conséquences économiques des exigences en matière de réglementation des valeurs mobilières dans une situation où l’asymétrie informationnelle est importante et les contraintes réglementaires limitées. Au Canada, les entreprises peuvent s’inscrire en Bourse alors qu’elles ne rapportent pas de revenu. Elles peuvent utiliser le processus classique du premier appel public à l’épargne ou utiliser une méthode d’inscription déguisée par prise de contrôle inversée. La supervision des autorités en matière de valeurs mobilières est plus légère dans ce cas, et le processus d’inscription se fait beaucoup plus rapidement. En tenant compte des multiples caractéristiques incluant l’endogénéité du choix du mode d’entrée, nous montrons que le choix du mode d’entrée et donc de la rigueur de la supervision influence de façon significative la valeur et la performance boursière à long terme des émetteurs. Nos résultats suggèrent que l’entreprise qui se soumet à une supervision plus stricte diminue l’asymétrie informationnelle, le coût du capital, la dispersion des anticipations et les erreurs d’évaluation des investisseurs. Mots clés : Divulgation, réglementation des valeurs mobilières, prise de contrôle inversée, norme minimales d’inscription en Bourse. We analyze the economic consequences of disclosure and regulation within a context of significant information asymmetry and lenient regulation. In Canada, firms can enter the stock market at a pre-revenue stage by fulfilling each of the requirements of an initial public offerings or using reverse mergers. This backdoor listing method implies a smoother oversight by the securities commission and a shorter process based on private placements. Controlling for several dimensions, including self-selection, we find that the choice of the listing method and regulation strictness significantly influence the value and long-run performance of newly listed firms. These results are consistent with theories suggesting that a commitment by a firm to a stricter regulatory oversight lowers the information asymmetry component of the cost of capital, reduces the heterogeneity of expectations and mispricing. Keywords: Disclosure, Securities Regulation, Initial Public Offerings, Reverse Mergers, Listing Standards. Codes JEL : G24; G32; G14; G1. *. We owe thanks to the participants to the CELS meeting at Cornell in September 2008 and mainly Bernie Black for helpful comments. † Professor, Laval University and CIRANO Fellow, Faculty of Administrative Science, School of Accountancy, Pavilion Palasis-Prince, 2325 de la Terrasse, Laval University, Québec (Québec) Canada, G1V 0A6, phone: 418 656 2131 #6385, fax: 418 656 7746, email: [email protected]. ‡ Associate Professor, Ontario Research Chair and CIRANO Associated Fellow, York University - Schulich School of Business, 4700 Keele Street, Toronto, Ontario M3J 1P3, Canada, phone: 416 736 2100 #77942, fax: 416 736 5687, email: [email protected]. § Professor, Laval University and CIRANO Fellow, Faculty of Administrative Science, School of Accountancy, Pavilion Palasis-Prince, 2325 de la Terrasse, Laval University, Québec (Québec) Canada, G1V 0A6, phone: 418 656 7134, fax: 418 656 7746, email: [email protected]..
(4) I. Introduction Security issuance is subject to the risk that corporate issuers will sell bad securities to the public (La Porta, Lopez-De-Silanes and Shleifer 2006; Campbell 2009). The “appropriate” or “fair” level of regulatory requirements for new listings is subject to ongoing debate. Several authors argue for easing the rules for smaller entities (Cohn 1999; Chiu 2003; Friedman and Grose 2006). Campbell (2009 p.1) states that “one of the most curious and misdirected regulatory approaches of the Securities and Exchange Commission is the Commission's relentless refusal to permit small businesses to solicit broadly for external capital.” In the U.S. the listing process is generally considered long and costly, especially for small and medium-sized companies (Cohn 1999). Thus, some authors recommend that firms should be allowed to list without fulfilling the full initial public offering (IPO) disclosure process, and even further recommend that Reverse Mergers (RMs), also known as a backdoor listing method, can be a useful tool for smaller firms (Heyman 2007). Because the variation between the characteristics of newly listed firms is limited without a „left tail‟ of low quality issuers, analyzing the effect of listing and disclosure requirements is an empirical question difficult to address in the U.S. context. As such, recent studies of the effects of regulation on the cost of capital use cross-national comparisons (La Porta, Lopez-De-Silanes, Shleifer and Vishny 2002; Hail and Leuz 2006) or regulatory changes in foreign countries (Black and Khanna 2007). In this paper, by contrast, we approach this issue by comparing IPOs and RMs in a non-U.S. context where the regulatory standards for listing are extremely low. In Canada, regulators allow easy access to the market via RMs, and new listings are divided almost equally between RMs and IPOs. In an IPO, the firm has to meet all the regulatory requirements, provide a prospectus and comply with a strictly defined and clear process. This process takes generally six to twelve months. In sharp contrast, the RM process is not defined in Securities Laws and is more opaque and complex. This listing method presents the unique characteristic that the main disclosure is required after the main financing has been completed. Moreover, all the operations can be closed in one or two months, a situation less favorable to an accurate analysis of the information. Such backdoor listings have acquired a bad reputation (Pavkov 2005; Floros and Shastri 2009; Gleason, Jain and Rosenthal 2009). RMs and IPOs exhibit similar characteristics in Canada -- such as size, profitability, and shareholding. We estimate the effect of regulatory requirements on the value and the long-run.
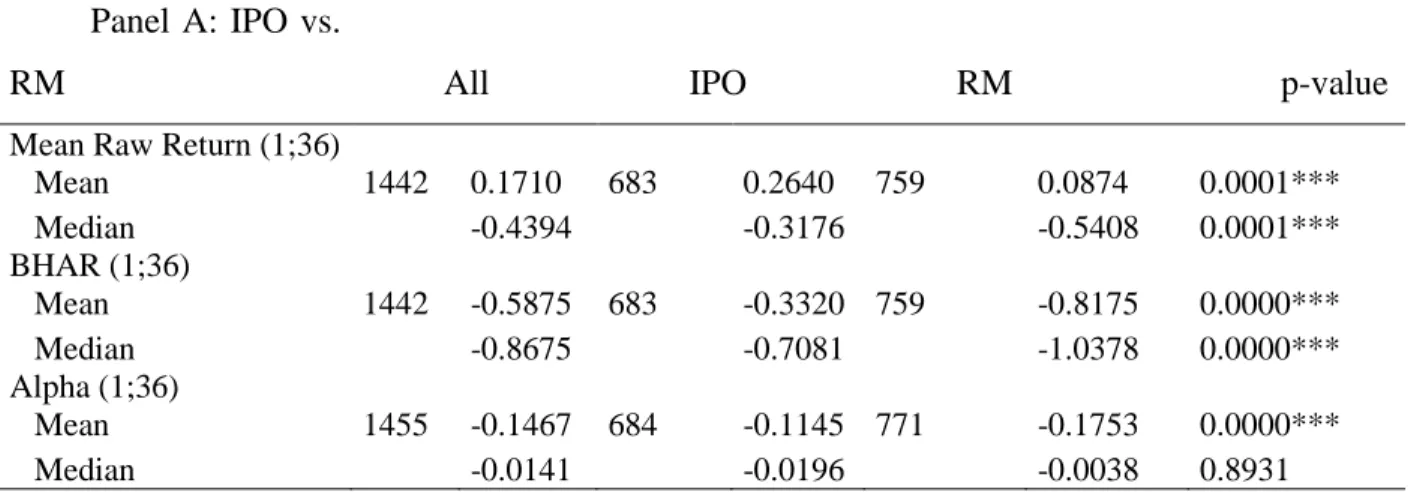
(5) 1. performance of the newly listed companies. Hence, this paper enables an analysis of the effects of lax regulatory requirements for listing in a developed market with potentially more pronounced effects than in the U.S. The low listing requirements create a situation with massive asymmetric information, risk, and uncertainty faced by the purchasers of newly listed firms. The analysis of backdoor listing effects is of interest in several countries where RMs are becoming common. Such RMs generally use cash shells, including the Investment Companies in the U.K. and the U.S. Special Purpose Acquisition Corporations (SPACs) (Berger 2008). In the U.S., 1065 RM listings are reported from 2004 to 2008 (Feldman 2009 p.3). Accordingly, RM are overriding the IPO market, where 672 deals only are reported on the Jay Ritter website.1 Based on a sample of 1,455 IPOs and RMs between 1993 and 2003, with both short- and long-term performance data up to the latter part of the pre-crisis period, comprising more than 60% of the new listings population, our findings are as follows: 1: Low listing requirements negatively affect investor wealth. The long-run returns that follow Canadian IPOs and RM listings are extremely poor. They are significantly lower than those reported for IPOs in other countries. The proportion of negative raw or excess returns can reach 60% to 70% depending on the specification. The assessment that higher initial listing requirements protect investors is confirmed in our context of very low listing standards. 2: A careful analysis of the return distributions indicates that a few newly listed firms produce huge returns. A preference for skewness can explain why the investors still participate in these offerings, since they resemble lottery stocks. Investors involved in IPOs and RMs do not exhibit the characteristics of rational behaviour in the classical mean-variance scheme. 3: Even if RMs and IPOs share many characteristics, the analysis of the self-selection problem indicates that the lower quality firms opt for the less regulated RMs to obtain a public listing. RMs are smaller firms, more often exhibit negative earnings, and often do not have revenues. This observation is in line with the “lemon market” proposition stated by Black (2001). Black (2001) considers that rigorous disclosure rules are a precondition for a strong securities market, and our findings are strongly consistent with this proposition. 4: If timely disclosure and the rigorous process associated with the IPO are informative above and beyond the lighter regulation surrounding RMs, then IPOs should have a lower cost of. 1. See: http://bear.warrington.ufl.edu/ritter/IPOs2009Factoids.pdf.
(6) 2. capital than RMs. Thus, IPOs should receive higher valuations. We evidence a strong effect of the choice of listing mode on the value that the firms can obtain for the new shares issued during the listing. In terms of the earnings, the multiple obtained through IPOs is twice that observed for RMs. We carefully control for the other dimensions that can influence the valuation, including but not limited to self-selection between the two listing modes, in order to carefully assess the observed effect of the listing process and requirement. 5: Both IPOs and RMs are overpriced, as evidenced by the long run underperformance of both groups of issuers. Biases, including overconfidence and overoptimism, are likely to be larger for RM than for IPOs. Asymmetry and opacity are higher for RMs than for IPOs, and timely disclosure is only available for IPOs. Accordingly, valuation mistakes should be observed more frequently for RMs than for IPOs. Moreover, the cost of capital increase linked with the listing choice is likely to prevail during a long period of time. Then IPOs should exhibit better long-run performance. Indeed, we find that IPOs have less negative long-term returns than RMs. All else being equal, investing in firms that list with certified and timely disclosure is better than investing in firms that bypass the strict IPO process. In our analyses, we control to the fullest extent possible for the other possible determinants of performance and self-selection. These results suggest that for both the issuer and the investors, there is significant benefit to voluntary submit themselves to the stricter requirements of the IPO process. Overall, our results suggest that disclosure characteristics including timeliness, certification and approval by securities commissions have a significant economic impact. These results are consistent with theories suggesting that a commitment by a firm to a stricter regulatory process mitigates information asymmetry and thereby lowers the cost of capital. These results are also consistent with the hypothesis that timely and certified disclosure reduces mispricing. This paper is organized as follows. In Section II we develop propositions in the context of the related IPO and RM literature. In Section III we introduce the data and present summary statistics. We explain our empirical methods in Section IV, and we present our econometric results in Section V. Section VI describes policy implications and concludes.. II. Related IPO and RM Literature and Propositions.
(7) 3. We first present the distinctive characteristics of the Canadian market and RM listings in Canada. Then we present the elements of market valuation theory required to discuss the effects of the choice of the listing method on prices and long-run performance. Lastly, we present our propositions. A. IPOs and RMs in Canada Minimum listing standards and securities regulation limit a firm‟s access to stock markets based on firm size and earnings, among other things, and they require extensive information disclosure in the way of promoting market quality and investor protection (Macey and O'Hara 2002). Minimum listing standards are strikingly different in Canada and the U.S. To highlight the characteristics of the Canadian market, it is worth briefly reviewing the situation in the U.S. In this country, securities regulation requires that firms that seek listing comply with a prospectus requirement that must be filed with the Securities and Exchange Commission (SEC) as part of a registration statement. The SEC's rationale has been that regulators are gatekeepers whose strict requirements protect investors and market integrity and thereby reduce the cost of equity for listed firms. U.S. regulations on security issuance have increased in recent years. When revising the Penny Stock Rule in 2005, the SEC required that newly listed firms to have positive net income, that the market value of their listed securities be at least $50 million, and that the securities‟ minimum bid price be $4 per share. The SEC also strongly limited a firm‟s capacity to escape the initial listing requirement by using a RM. SEC Rule 419 severely restricted Blank Check Companies, commonly used in the 1980s as shell companies to facilitate RMs. On January 4, 1999, the SEC approved the “eligibility rule,” which required all domestic Over-the-Counter Bulletin Board firms to comply with the reporting obligations under the 1934 Act (Bushee and Leuz 2005). The first distinctive characteristic of the Canadian securities market is its very low level of listing requirements. For a listing on Tier 2 of the junior market -- the TSXV -- a firm must meet the following conditions: stock price over CAN$0.15 and post-IPO net tangible assets and market capitalization higher than CAN$500,000.2 The TSXV has no requirements for issuers‟ profitability. As a result, from 1986 to 2006, more than 80% of listing firms report negative 2. Corresponding values for NASDAQ from June 1999 to June 2001 were US$4 (price), US$4 million for shareholders‟ equity, and US$5 million for market capitalization..
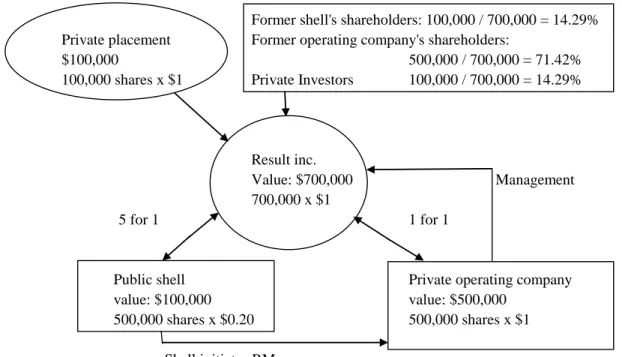
(8) 4. earnings at the time of listing, and close to 50% report no revenues. The pre-IPO median shareholder s‟ equity (total asset) in newly listed companies was CAN$260,000 (CAN$710,000) and the median IPO gross proceed was CAN$670,000 (Carpentier, L'Her and Suret 2010). In the U.S., for penny stocks IPOs, the median total asset was US$7.16 million and the median gross proceed was US$5.5 million (Floros and Shastri 2009). Canadian newly listed companies are approximately 10% the size of U.S. penny stock IPO firms. This implies that entrepreneurial ventures have access to the stock market, and that they constitute the bulk of the entering firms. Such ventures could not enter the other junior markets in the world.3 This is an important point, because the problems of information asymmetry and adverse selection are particularly acute for entrepreneurial ventures seeking for external equity financing. The second distinctive feature of the Canadian market is the promotion, by the exchange, of RM listings and the low level of regulatory constraint that is placed on firms that opt for this method. An RM is a method used by a private firm (the entrant firm) to become publicly traded without issuing an IPO. We illustrate a classical RM transaction in Figure 1. The RM listing includes a merger between a public shell company, which is generally inactive, and privately held operating company. Canadian shell generally has a very low market value, and Figure 1 illustrates a typical shell with a value of CAN$100,000, based on 500,000 shares priced at CAN$0.20. Currently operating closed firms that seek listing usually have a much higher value: for example 500,000 shares priced at CAN$1. The resulting company, here named Result inc., is a product of the merger of the two former firms. This merger entails generally an exchange of shares:4 the shareholders of the entrant firm and of the shell exchange their shares for those of the new entity, Result inc. The difference in value between the shell and the operating company means that the shareholders of the private operating company will acquire the majority of the. The “new” markets in Europe devoted to growing companies generally require minimum gross proceeds of Euro5 million (CAN$8 million). Several junior markets, like the AIM, First North or NZAX apply principles-based listing requirements. They do not require a numerical threshold but require the entrant to get a sponsor. The average gross proceeds of the IPO firm joining AIM in London is equivalent to CAN$15 million. On First North, in the Nordic countries, the mean market capitalization was equivalent to CAN$85.53 million. In 2009, January, the 34 small firms listed on the NZAX had a total capitalization of NZ$633 million, for an average (post crisis) capitalization equivalent to CAN$12.5 million. Even if they use principles in lieu of rules, these exchanges do not list entrepreneurial ventures at early stages. 4 Most often, RMs involve the acquisition by the listed shell of either the assets of a private firm or all of its outstanding shares in exchange for the shares of the shell. If the shell acquires all or part of the outstanding shares of the private firm, the private firm becomes a subsidiary of the shell. 3.
(9) 5. shares of the resulting entity. This transaction is called an RM because the shareholders of the private company ultimately control the public shell company. As a result of the RM, the private company becomes public by buying the shell, without issuing a classical and reviewed prospectus, selling new shares to the public, or meeting the minimum listing requirements. “Classic” shells are once-active companies that failed to develop and ceased or strongly reduced their activities, but have kept their stature as public companies. “Manufactured” shells are created specifically from nothing, using the Capital Pool Program (Carpentier and Suret 2006). After the RM, the private firm (the resulting firm) becomes publicly traded and has to comply with the ongoing listing requirements. At this stage, disclosure requirements are similar for RM and IPO firms. Newly listed companies using an RM are exempt from filing a prospectus and need not comply with the registration requirements prevailing for IPOs. RMs, amalgamation, or other similar procedures are used to take advantage of the prospectus and registration exemptions in provincial securities legislations (Brock, 2000). This legislation implies that the RM firms cannot issue shares publicly. They get the cash available in the shell and, in the majority of the cases we observe, they issue shares privately. The private placements associated with an RM are generally too small for institutional investors. In Figure 1, we consider that private investors get a participation of CAN$100,000. That gives them a 14.29% proportion of control. Then, if we omit the transaction cost, the value of Result inc. is equal to CAN$700,000 [CAN$500,000 (the entrant) + CAN$100,000 (the shell) + CAN$100,000 (the private placement)]. [Insert Figure 1 about here] B. The regulatory dimension IPOs and RMs differ along two main dimensions related to regulation: 1) complexity and diversity and 2) disclosure, including the certification, approval and timeliness dimensions. As a result of the weaker regulatory oversight, the asymmetry of information is likely to remain stronger for RM than for IPOs and the RMs perception by the market is generally negative. Complexity and diversity: in contrast to IPOs, RMs are not defined in the Securities Laws or Rules of the main provinces (Petit 2002).5 The regulator is involved indirectly in the 5. In Canada, securities laws are administered and enforced by a provincial securities commission. A concerted effort toward harmonizing and streamlining securities regulation across Canada by establishing.
(10) 6. transaction because it implies an acquisition, exchanges of share or a material changes. The RM can be structured in several ways and the sections of the Law evocated in the transaction differ according to the structure of the deal.6 As stated by Feldman (2009 p.145) in RM “there are many tricks and traps that are easy to fall into even if one is an experienced securities attorney, auditor, investment banker or operating company executive.” Lastly, RMs are also complex operations from an accounting point of view and the analysts of the securities commission in the Quebec province7 noted that the accounting treatment applied by many issuers with respect to RMs does not follow GAAPs. The commission required many issuers to file restated financial statements. The RM complexity implies that these operations are less easy to understand and appraise than classical IPOs. Disclosure: Policy 5.2 Changes of business and reverse take-overs of the TSXV Corporate Finance Manual (as at June 30, 2001) describes the RM disclosure requirements for the period under analysis. First, when an agreement in principle is reached, the issuer has to prepare and submit to the corporate finance department of the exchange a comprehensive news release that includes the date of the agreement and a description of the assets, business, property or interest. a uniform securities regulation regime is in the works. However, during the period we analyze, several differences existed between the provinces, mainly in the area of exempt placements where private placements associated with RMs take place. 6 As an example, Petit (2002, p.41) contends that the exchange of shares included in the transaction constitute a placement that can be related to 6 different sections of the Securities Law. RMs can be structured as an exchange of shares, an asset acquisition, properties or interest therein. Petit (2002, p.35) describes six of the possible paths for completing a RM. Several RM include an amalgamation process. This is an example of such a transaction, related to Pason Systems Inc, on line on the British Columbia Securities Commission Web site: “The Filer is a public company amalgamated under the Business Corporations Act (Alberta) on November 1, 1996. The amalgamation was part of an overall transaction which occurred on October 31, 1996 whereby Mark 8 Ventures Inc. (“Mark 8”) pursuant to an acquisition agreement among Pason Systems Corp., all of its shareholders and Mark 8, acquired all of the outstanding shares of Pason Systems Corp. on the basis of 38,843 common shares of Mark 8 for each Class A common share of Pason Systems Corp. A total of 10,176,860 common shares of Mark 8 were issued to the shareholders of Pason Systems Corp. in connection with such acquisition. Following this acquisition, Mark 8 amalgamated with 693867 Alberta Ltd. a wholly owned subsidiary of Mark 8 to form the Filer. Prior to November 1, 1996 the Filer (or Mark 8) had no significant assets and was inactive. The reverse takeover, which occurred on this date, represented a transition in the business of Mark 8 from an Alberta junior capital company to an oilfield service company specializing in drilling instrumentation systems.” The intricacy of the various methods that can be used are exposed in details by Feldman (2009) or Sjostrom (2008). 7 See AMF Staff Notice – Reverse Takeovers, http://www.lautorite.qc.ca/files/pdf/reglementation/valeursmobilieres/0-avis-amf/2006/2006juil07-avis-reversetakeovers-en.pdf.
(11) 7 therein to be acquired. However, the main filed document is the information circular8 that is prepared in accordance with securities laws. Basically, as stated by Brock (2000 p.3),9 RMs and IPOs imply the production and filing of similar documents. However, several important differences exist between the two listing methods. In the IPO case, a preliminary prospectus is submitted to the securities commission. Then the issuer has to get a preliminary visa and the prospectus is resubmitted in the final version to obtain the definitive visa. The new issue promotion is strictly regulated during this process. The RM information circular has simply to be filed but it is not reviewed by the securities commission.10 Moreover, the investment banker plays a significant role of certification during the IPO process and reputable investment bankers are generally associated with lower IPO underpricing. They contribute to reduce the asymmetry of information (Jenkinson and Ljungqvist 2001). RMs do not involve investment bankers at all. The information circular is thus neither approved nor certified. Timeliness: The IPO prospectus is a prerequisite to the sale of shares. This is not the case for the information circular in an RM. The main objective of this document is to inform the existing shareholders about the proposed merger. It should be filed before the shareholders meeting. According to Policy 5.2 (at 5.8) “any concurrent transaction must be disclosed.” This implies that the private investors should book their placement before the release of the information circular. To verify this important point, we analysed in depth the various documents associated with two groups of RMs. This first group of 33 RMs report no financing, while the second group of 15 other RMs was randomly selected. In the first group, we detected 17 cases without any placement and 16 cases of private placements completed before the RM, in the shell or in the operating company. These placements were not mentioned in the circular. In the second group, the private placements are completed or booked before the release of the circular and. A filing statement replaces the information circular when the transaction is at arm‟s length and a meeting of security holders is not otherwise required by law. Differences between both documents are not material and they can be neglected here. The differences in disclosure between IPOs and RMs were eliminated in 2005, following the adoption of NI 51-102 (Section 4.10), and the related amendments to this instrument that were adopted during the subsequent years (after the period in our dataset). 9 The content of the circular is defined in the FORM 51-102F5 document, available at : http://www.msc.gov.mb.ca/legal_docs/legislation/notices/51_102f5_2nd.pdf 10 This can explain why, in some transactions, the information was far from the prospectus level (see, as an example, the Augusta Metals Incorporated-CyberCom System, in 2000, where the sole financial statements available are those of the inactive shell). 8.
(12) 8 announced in the circular.11 In terms of disclosure, RM constitutes an unique situation where the information is disclosed after the financing. This is a significant difference with the IPO process, where the offering can only be done several months after the filing of the preliminary prospectus. Gleason, Rosenthal, and Wiggins (2005) estimate that IPOs take a minimum of 6 months while RMs take between 1 and 3 months. Such a fast process is not favourable to a good analysis of the available information. We have illustrated in Appendix the time line of a RM listing using a capital pool shell and the sources of informational asymmetry.12 Asymmetry: In an IPO, the asymmetry exists mainly between the investors and the owner of the private company, and it is reduced by the prospectus and the involvement of reputable intermediaries. The preliminary prospectus is available several months before the issue. Upfront, RM firms are generally more opaque than IPO firms (Floros and Shastri 2009). The RM involves several stakeholders with diverse sets of information, mainly when the shell is a capital pool company (Carpentier and Suret 2006 p.51). As illustrated in the Appendix, an RM involves the promoters of the shell, who are the first to identify the target firm. The promoters sometimes know the target firm at the inception of the shell.13 The shell‟s shareholders are composed of three groups. The first group provides the seed financing of the shell and is likely to share some information with the promoters. The second group invests at the shell IPO, when the target cannot be mentioned by Law. The third group trades the shell shares before the RM, but generally discovers the target at the pre-meeting filing.14 The managers of the target own private information but this information will become public only after the closing of the financing. Private investors implied during and after the merger can perhaps analyze preliminary draft of the 11. The sole exception is a placement completed several months after the RM. A typical information circular reports that the extraordinary meeting will be held to approve the RM and: “To consider and, if thought advisable, to pass an ordinary resolution approving a private placement, in which related parties of the Company will participate, consisting of 6,830,000 units of the Company at $0.12 per unit, with each unit comprising one common share and one share purchase warrant entitling the holder to purchase a further common share for a period of two years (…)” (Transac Enterprise corp., on July 10, 2003). 12 We illustrate the case of a RM listing that uses the capital pool company program, because this is the most common case in our sample. RMs on classical shells present similar characteristics, but the exact characteristics of the shell, including potential hidden liabilities, add a supplementary dimension to the information problems. 13 This assumption is based on the fact that several RMs occur a few weeks after the shell creation, and on the observation that several shell promoters are also involved in the target company. 14 To confirm this point, we selected the 50 RMs that exhibit the higher pre-merger returns. The maximum monthly return we observed is 90.9%. We carefully scrutinize SEDAR to conclude that no piece of disclosure related to the forthcoming RM has been published for any of these shells..
(13) 9. circular, but the final version of the circular has to include their commitment. Joint to the fact that the circular had not been under review by the securities commission, the RM listing is favourable to large asymmetry of information between the various stakeholders involved in the transaction. This situation, together with the penny stock characteristics of shell shares and a long history of fraud, has given a bad reputation to RM listings. Bad reputation: In North America, RMs are often associated with fraud by regulators, academics and practitioners.15 On April 14, 2004, the SEC announced it would monitor shell companies more aggressively to curb abuses in "backdoor" RMs. Changes in regulatory oversight resulted from concerns that RMs involve shells, where insiders utilize schemes to sell stock to unsuspecting shareholders, and then dump the shares themselves (Gleason, Rosenthal and Wiggins 2005). Some fraud methods, including “Boiler Rooms,” are often mentioned in the context of RM, including by the Assistant Manager of Investigations of the Ontario Securities Commission (Hubley 2002). In Canada, RMs often use cash shells, that are prone to insiders trading (Chen 2000). They are “on average high risk, under-performing ventures, where agency problems play an important role, and should therefore be looked upon carefully by potential investors” (Rosenboom and Vasconcelos 2009, p.1). The bad reputation of RM is partially inherited from the blind pools and penny stock experimentations. In Canada, RMs are mainly done on capital pools company, and this program is a clone of the U.S. badly perceived Blind Pools/Blank-Checks program (Heyman 2007). An important implication of this reputational effect for our study is that RM firms can be seen as more risky and of lower quality than similar IPO firms for a long period of time because the private firms‟ managers have decided to bypass the certification associated with the IPO process. Feldman (2009) underlines that winning market support is the major challenge for RM firms. Positive announcements by the resulting issuers could partially resolve this reputation effect. However, because RM firms are generally at a prerevenue stage and will not be profitable before three to five years, the higher cost of capital should prevail during a long period of time.. A quick search on Factiva (November 5, 2010) using “reverse merger” and “fraud” provided 298 references from 1998 to 2010. For Molloy (2006, p.4): “the benefits ascribed to the reverse merger process are ephemeral at best and (…) the quick entry into the public markets without the discipline of the traditional IPO process is hardly beneficial to shareholders.” See also the section 8, entitled “Shady Technics” in the Feldman‟s reference book on RM (Feldman 2009). 15.
(14) 10. We analyze a situation where entrepreneurial ventures enter a stock market. In this context of large information asymmetry, they can choose either to use a quick, opaque and badly perceived listing method or to submit themselves to the strict requirements and time-line of an IPO. The first choice implies that the firm offers a non-approved and non-certified disclosure, available only after several investment decisions by the shell‟s shareholders and private investors have been done. We contend that this choice should influence the firm value at the listing time and firm long-run performance. However, whichever the listing mode, public firms should generally fulfill the same ongoing disclosure requirements.16 This implies that investors access the same set of information for IPO and RM issuers after the listing. C. Pricing hypothesis According to the rational expectations hypothesis, the poor quality of issuers, their opacity and the possibility of opportunistic behavior by managers should be fully anticipated by investors. As evidenced by a large literature based on cross listing and changes in listing, firms that submit themselves to a stricter regulatory process, including higher disclosure, enjoy a decrease in their cost of equity and an increase in their value (Hail and Leuz 2006). A large body of theoretical research supports a link between information and the cost of equity (see Healy and Palepu 2001 for a review). Another stream of research considers that the cost of equity is higher when the transaction costs and illiquidity are higher. Because more disclosure increases the liquidity of shares, it also potentially reduces the cost of equity. Following both tracks, the effects of disclosure on the cost of capital may be more important when the asymmetry of information is large. The disclosure content is not the sole relevant characteristic that impacts the cost of equity. The credibility and timeliness of the source of disclosure affect their impact on firm‟s cost of equity capital (Kothari, Xu and Short 2009). Accordingly, rational investors will associate a higher cost of capital to an opaque firm that list using a lax regulated process than to a similar firm that discloses timely information in a strictly regulated process. In such a rational world, the prices are set low enough to ensure the investors a fair rate of return after the listing. This mechanism is likely to be modified by behavioral considerations if irrational investors influence the pricing. Behavioral explanations are 16. However, venture issuers listed on the TSXV are submitted to smoother disclosure requirements than mature issuers, since 2007 (Sarra 2009). This cannot influence our analysis..
(15) 11. generally proposed to explain the long run underperformance following IPOs (Jenkinson and Ljungqvist 2001). Behavioral theories assume the presence of “irrational” investors who bid up the price of IPO shares beyond their true value. Miller (1977) proposes that the price around the time of new listing is set mainly by the most optimistic investors, when short sales strategy cannot be implemented as in IPO and RM. Individual investors exhibit stronger behavioral biases when stocks are harder to value and when market-level uncertainty is higher (Kumar 2009). Marciukaityte, Szewczyk and Varma. (2005) propose optimism as the main explanation for underperformance following private placements, because the issuers are generally small, young firms with high information asymmetry and too little history to predict their future performance. Eckbo, Masulis and Norli (2000, p.253) assert that SEO issuers‟ underperformance is largely driven by relatively small stocks. Brav and Gompers (1997) argue that the underperformance is not an IPO effect, but a characteristic of small, low book-to-market (high-growth) firms. Chou, Gombola and Liu (2009) conclude that overall, investors may be overly optimistic about the prospects of growth firms. In such a context of irrational pricing, we can expect valuation errors to be higher for more opaque firms affected by large informational assymetry. According this “overoptimism” effect, the stock price should be a positive function of the information asymmetry. In such a setting, the gap between the observed prices and the long run “true” value of a stock depend on the relative strength of the cost of capital and of the overoptimism effects. We contend that the cost of capital effect is likely to override the overoptimism effect for two main reasons. First, irrational investors should be a minority because they are likely to be driven out of the market by poor returns. Second, the missing element in the Miller (1977)‟s model is the fact that the overoptimism effect should be anticipated and accounted for by the other investors in the market (L'Her and Suret 1995). This feed-back effect should mitigate the divergence between the rational price and the one stated by the optimistic investors. At this stage, higher prices are still expected for IPOs than for RM. The investors‟ characteristics can mitigate this effect. In theory (and in the U.S.), private placements are subscribed by large institutional investors, who can be considered as less prone to irrational behavior. Indeed, in the U.S., although the shareholders not participating in the placement experience post-issue negative long-term abnormal returns, the participating investors purchase the shares at a discount, get cash flow rights and earn normal returns (Chaplinsky and.
(16) 12. Haushalter 2010). The situation is very different in Canada, where private placements are generally subscribed by groups of individual investors. To illustrate this point, we carefully analyze the characteristics of the providers of private equity in Canada, using a sample of 744 private placements from 2001 to 2005. We observe that a very small proportion of private placements are invested by institutional investors (less than 2%) or by people who are important shareholders after the placement and can be considered insiders. Even for small placements, we observe numerous investors (10 on average) and a significant proportion of 32.39% of the private placements had been subscribed by 21 investors or more. The lack of skill and rationality of Canadian private equity investors is illustrated by their negative excess returns, even when this return is adjusted for the discount (Carpentier, L‟Her and Suret 2010). This allows us to consider that investors involved in private placement surrounding RMs do not have private access to information, and can be prone to the same irrational behavior than IPO investors. In our setting, two opposite effects influence the observed issue price: a cost of capital effect that decreases the value of the more risky and opaque firms and an overoptimism bias that increases the price of the firms where the information asymmetry is larger. We now turn toward the consequence of these two effects on the long run underperformance. According to the classical interpretation of the Miller (1977)‟s proposition, the long run return will be a negative function of the over optimism bias, because information will drive the stock price toward its equilibrium value. This remains true if we consider that the cost of capital differences will be erased with time. However, if the difference between the costs of capital subsists for a long period of time, the long run performance should be lower for the firm that list with the larger asymmetry of information.17 D. Regulation, disclosure and valuation. 17. Let us illustrate this analysis by a numerical example. Two similar firms with expected cash flow of $10 list using an IPO and an RM respectively. Rational investors set the cost of capital to 10% for the IPO and 15% for the RM. The rational values are set to $100 and $66.67 respectively. Optimistic investors add a premium of 10% for the IPO and 20% for the RM. If the irrational investors are able to set the issue price, the IPO is now worth $110 and the RM $80. We assume now that both costs of capital remain unchanged after the listing, due to the bad reputation of the RM firm. Optimistic investors do not influence the price on the secondary market. After 3 years, the respective market prices will be $100 and $66.67 respectively for the IPO and the RM and the associated raw returns are -10% and -16.7%. In the case where the RM firm is able to reduce its cost of equity at the level enjoyed by the IPO firm, both market values are equal at year 3 and the long run return of the RM firm is higher than the return of the IPO firm..
(17) 13. RM firms are generally at an earlier stage of development and the proportion of firms reporting no revenues is larger in this sub sample. They are more opaque (Floros and Shastri 2009) than IPO firms and constitute real valuation challenges. The asymmetry of information is also likely to be larger in the case of RM, for the reasons exposed in the previous section devoted to the regulatory dimension. If credible (certified) and timely disclosure indeed reduces the cost of equity, then firms that opt for RM listing should have lower value than similar firms that choose to fully disclose using a prospectus and the IPO process, in a world of rational expectations and pricing. According to the Miller‟s (1977) proposition and the behavioral finance literature in the particular context of small capitalization, the listing price is set mainly by the most optimistic investors. This price diverges from the present value of future cash flows set by the average investor (the intrinsic or true value), and the divergence is a function of the heterogeneity of expectations. The RM price should be higher than the IPO price, everything being equal. However, the Miller‟s analysis neglects the fact that the future cash-flows are discounted at a higher price, on average, if the uncertainty is greater. If we consider this dimension, the relationship between the price and uncertainty depends on the relative strength of the cost of capital effect, that decreases the average price set by rational investors, and the irrational premium set by most optimistic investors. Uncertainty sharply increases the cost of capital, as evidenced by the very high rates of 36 to 45% required by venture capitalists to invest in early stage venture (Manigart, Waele, Wright, Robbie, Desbrières, Sapienza and Beekman 2002). We expect that the cost of capital effect dominates the irrationality effect and we predict that RM are priced lower than IPOs. In other words, we contend that irrational investors can play a role, but that rational investors are numerous enough to dominate the effect of irrational investors.. E. Listing method and long-run performance The RM choice is likely to increase the cost of equity, and accordingly to depress the stock value, during a long time for several reasons. First, RMs have a bad reputation and the lack of reputable intermediaries is likely to give the investors a limited trust in RM firms, as in the case of direct public offerings (Trainor 2003). Anand and Johnson (2006 p.6) report that both firms and investors consider that information asymmetry and the resulting discount can drive direct.
(18) 14. offer toward a death spiral. They underline the pivotal role of underwriter to certify the value of the issue. Feldman (2009 p.89) contends that winning market support is crucial for RM firms, because “some suggest that reverse mergers, special purpose acquisition companies and others alternatives to IPOs simply are not viable because the post trading in the stock is often weak and subject to manipulation.” Second, in Canada, IPO and, in a larger extent RM firms can be considered as start-ups. Given their limited operating history, such firms are arguably the most opaque firms in the economy (Cassar 2004). As IPO firms, RM firms should comply with the ongoing disclosure requirement. However, RM firms have generally a very limited stream of new and positive information to report following the listing. On average, the proportion of RM firms reporting no revenues or negative earnings increases during the years following the listing.18 Third, RMs rely on private placement. According to Ou and Haynes (2006, p.158), the private equity market “often involves rather complex contracts that are informationally opaque and contrasts significantly from the more informationally transparent public stock (…) markets.” In such a context, the reputational effect of the listing choice is likely to increase the cost of equity for a long period of time. If valuation errors are larger for RMs than for IPOs and if the cost of capital effect persists in the long run, one should expect lower long run returns for RM than for IPOs, despite the fact that IPO prices are higher than corresponding RM prices at the listing time.. F. Testable propositions We specifically test the following two propositions: First, if prospectus disclosure, credibility and timeliness is more informative than the shady RM process, then IPOs incur a lower cost of capital than RM listed firms and experience a higher valuation.. 18. The analysis of the post-RM operating performance confirms this proposition. During the third fiscal year after the listing, the proportion of surviving RMs firm without revenue had slightly increased from 30.22% for the listing year to 33%. The proportion of negative earnings has increased from 71.85% to 77%. The financial situation of firms does not improve following RMs..
(19) 15. Second, if the choice of the RM listing method increases the cost of capital in the long run and induces larger valuation error linked with asymmetry and heterogeneity of expectations, then IPOs exhibit better long-term performance than RM. Our empirical tests extend the previous literature by providing new analyses of full disclosure listings, including a prospectus and a structured process monitored by the securities commission (in the case of IPOs), and a less structured and less certified process essentially monitored by the exchange (in the case of RMs). We account for the fact that performance differences between IPOs and RMs are not solely attributable to the disclosure effect. First, in the case of IPOs, prestigious investment bankers or venture capitalists can also be involved, while they are absent in RM listing. These reputational intermediaries can influence the pricing and the long-run performance of newly listed companies. We control for the involvement of such intermediaries in the robustness check on our results. Second, an IPO gives rise to a more liquid secondary market for the stocks than an RM, and the illiquidity discount thus negatively affects RM pricing. We implicitly control for the liquidity by including the firm size in the various models. Third, we consider that the TSXV is a less liquid market than the senior exchange, the TSX. We test for the robustness of our model to the inclusion of a dummy variable to differentiate the firms listed on both markets. Fourth, RM firms rely on private equity. Private placement investors generally are considered as well informed and knowledgeable. However, in Canada, the small size of the private placements linked to RM listing prevents institutional investors from being significantly involved in these transactions. In the following sections, we test these two propositions in the Canadian context. We control for differences among IPOs and RMs with an extremely detailed dataset that is described in the next section.. III. Data and Stylized Facts A. Data sources We use a hand-collected sample of new listings on the TSX and TSXV (and its predecessor exchanges). We collected and documented the new listings from 1993 to 2003, including RMs.
(20) 16. and IPOs, and consider performance data to December 2006 before the financial crisis. We do not consider the IPOs of Capital Pool Companies19 (CPCs) when these entities simply collect some cash, but we consider all the Qualifying Transactions (QTs) that enable a closed operating corporation to list on the exchange.20 We collected the lists of IPOs from FPInfomart.ca. We exclude IPOs resulting from the creation of income trusts, because they are essentially the continuation, in another form, of a previously existing public firm. We also exclude the few cases of privatization of state-owned firms and demutualizations, for similar reasons. We detected 1,024 IPOs from 1993 to 2003. Prospectuses are available in SEDAR since 1997. 21 We obtain those of earlier years from the Autorité des Marchés Financiers du Québec, investment bankers, and academic libraries in several provinces. We took the remaining accounting information from old versions of Thomson‟s Cancorp Financials (the accounting database). To compile the RM data, we used four sources. First, these operations were systematically reported by the TSXV review from 2001. Second, for the earlier years, we used a keyword scan, programmed on the accounting database, to detect each mention of a RM or reverse takeover in financial statements and notes. Third, we scanned the stock market database (Datastream) to track the typical pattern of shells involved in an RM: a penny stock increases sharply in value for a few months before a trade suspension, and trading generally restarts under a new symbol. Finally, we scanned the Canadian business newspaper databases (via Factiva and Eureka.cc) to identify all RM announcements. We then cross-checked these sources and analyzed each transaction to confirm that the detected cases indeed consisted of RMs associated with new listings. To compile a list of the CPCs, we used the new issues published by Financial Post and searched the Exchange reviews and SEDAR to determine whether the new issue was a CPC. QTs were identified for each CPC using the TSX Web site, along with SEDAR, the Survey of Predecessor. 19. A CPC is a shell company listing with a number of restrictions. These restrictions are described on the TSX webpage: http://www.tsx.com/en/listings/listing_with_us/ways/capital_company.html. See also Carpentier and Suret (2006). 20 On the AIM, the Investment Companies can be considered equivalent to the CPCs, although they should raise a minimum equivalent to CAN$6 million, against CAN$300,000 for CPCs. In the U.S., the Special Purpose Acquisition Corporations (SPACs) play a similar role, but for larger transactions (Berger 2008) 21 SEDAR, the Canadian equivalent of the U.S. EDGAR, was implemented in 1997. See http://www.sedar.com.
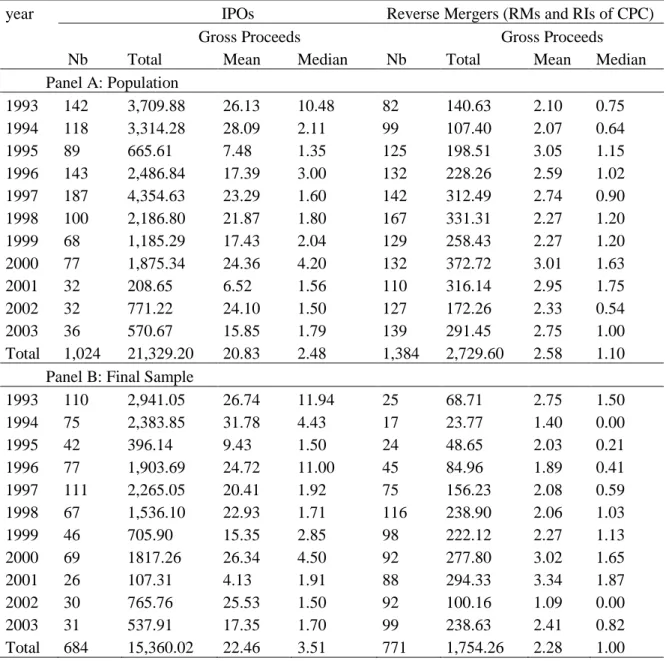
(21) 17 and Defunct Companies published by the Financial Post, Lexis-Nexis, and Internet browsers.22 We detected 1,384 RMs from 1993 to 2003. We collected the main characteristics of the entrant firm from the accounting database and SEDAR. Often, firms use backdoor listing methods to access the market without issuing equity, or they delay the offering for several weeks or months. Using SEDAR since 1997 and FPinfomart.ca for the earlier years, we analyzed each transaction to determine the amounts collected around the time of listing. We consider that financing is associated with a backdoor listing if it occurs during the 12 months following the listing. In Canada, there is no equivalent to the CRSP delisting codes. Therefore, we hand checked the status of all the issues as of June 30, 2007. For each of the delisted stocks, we identified the approximate date of delisting, the reason for, and the exact circumstances of the delisting. Our information came from the TSX Web site, SEDAR, FPinfomart.ca, the securities commissions‟ cease trade orders, Factiva, and research tools on the internet. The data allow for a correct treatment of the last returns for each truncated stream of returns. There are frequently incomplete series because of the high delisting rates of the small issuers we study. However, the incomplete series cannot be deleted if one expects to limit the survival bias. We summarize the population (Panel A) and the final sample (Panel B) in Table 1. We reduced the sample to the observations for which complete data are available at the listing time and whose returns can be estimated during the 36 months following the listing. Panel A illustrates the growing popularity of RM listing in Canada. For the entire period, we observe 1.35 RM for each IPO. However, since 1998, this ratio has reached 2.33 (804 RMs against 345 IPOs). The growing popularity of RMs as a listing tool reinforces our interest in the present study. The amounts of money collected in both types of listing are in the same range: the median IPO gross proceeds are CAN$2.48 million and the median private placements occurring during RM are CAN$1.1 million. Both are very small relative to the U.S. criteria. Gleason, Rosenthal and Wiggins (2005) report a median transaction value of US$31 million for their 121 RMs. [Insert Table 1 About Here]. 22. The rules of the program required that a CPC completes its QT in the 18 months following its creation. In 2001, the rules governing the program changed, to allow the QT to involve a public firm. In such cases, the QT become equivalent to a private placement, and we deleted these cases which do not imply a new listing..
(22) 18. Panel B reports the number and characteristics of the final sample. The missing values reduce the number of IPOs from 1,024 to 684. The final sample represents 66.8% of the population. The corresponding number is 55.7% for the RMs, because the collection of accounting data is generally more difficult for them because of the lower disclosure level. The missing observations increase the median gross proceeds of IPOs from 2.48 to 3.51, indicating that we lost the smaller issuers. No such effect is detected for RM. In the population, as in the sample, the large difference between median and mean amounts collected at the listing time indicates that a few very large transactions are included together with a large number of very small placements. B. Valuation Metrics We follow the strategy of Kim and Ritter (1999) and Purnanandam and Swaminathan (2004) who respectively analyze the IPO‟s valuation at the prospectus and at the market prices, based on the common multiple of sales, earnings, or book values. This method requires an estimation of the multiples for each company in the sample, and then expressing this multiple relative to a benchmark. The IPO value is given by Vi= Offer pricei x Shares outstandingi,t0 where the number of shares outstanding is estimated at the end of the year of the issue (t0). If an RM is part of a private placement, then we use the price per share of the private placement, and our estimation is similar to the case of an IPO. This is in line with the literature (Dai 2007). When the RM occurs without a private placement, we use the first market value available after the RM to substitute for the unobservable offer price. Because we consider the total number of shares of the resulting firm, our estimated value reflects the combined value of the entrant; that is, the shell plus the private placement (the value of Result inc in Figure 1). To be consistent in the estimation of valuation ratios, we also consider the total revenues and earnings of the entrant, plus those of the shell, as follows. Revenues, earnings, and shareholders‟ equity are estimated at the closing of the year preceding the listing. For RMs where the financial statements of the private entity are not available, we infer the accounting number of the entrant firm from the consolidated financial statements for the year including the RM as follows: EARN t-1 = EARN t0 – EARN of shell t-1, with EARN = Total earnings..
(23) 19 REV t-1 = REV t0 – REV of shell t-1, with REV = Total revenues SE t-1 = SE t0 – SE of shell t-1 – EARN t0, with SE = shareholders‟ equity. We include the book-to-price ratio, to obviate the lack of positive earnings, and even of sales in a large proportion of the sample. We define the raw valuation metrics of a firm i as follows: S/Pi = REVi / (Offer Pricei x SOi) E/Pi = EARNi / (Offer Pricei x SOi) B/Pi = PSEi / (Offer Pricei x SOi) With SO = shares outstanding after listing REV = Total revenues before listing EARN = total earnings before listing PSE = Post-money Shareholders‟ equity We estimate the comparable values for the universe of the Canadian listed firms included in the successive versions of the accounting database, using the market value at the end of each month. Then we set up three groups by size based on total assets, and we split the population according to 2-digit SIC codes. Then, we further split the sample according to profitability, as in Bhojraj and Lee (2002), indicating that considering the profitability of comparables will improve the accuracy of relative valuation models. The relative valuation ratio for a firm i is given by the raw valuation metric of the firm i divided by size/sector/profitability median valuation metric for the listing month and the two preceding months.23 For example, relative E/PIPO = E/PIPO / E/PComp where E/PComp stands for the median ratio of comparable firms. All statistics and models are presented for relative valuation metrics. C. Stylized facts In Table 2, we report the main characteristics of the samples of IPOs and RM listings, along the median characteristics generally used in the analysis of the IPOs. The gross proceeds and the pre-listing shareholders‟ equity indicate that both types of listing mainly involve tiny capitalized stocks, with a few exceptions that explain the large differences between medians and means. The shareholders‟ equity is CAN$400,000 before RMs and CAN$1.19 million before the IPOs. The RMs have a median private placement of CAN$1 million, and the IPO median gross proceeds are CAN$3.51 million. The difference between these two groups of listing is statistically significant.. 23. We include three months in the estimation of the median ratio to circumvent the low number of observations in several sectors..
(24) 20. RM listed firms are younger than IPOs: 6.07 years vs. 9.81. Both groups report very small median revenues of CAN$200,000 (RMs) and CAN$880,000 (IPOs). The proportion of newly listed firms reporting negative earnings before the listing for RMs and IPOs is 71.85% and 59.94%, respectively. Both groups are financially constrained and, without the cash injection, they would have negative cash after the listing. The last three rows of Panel A report the relative valuation metrics. These valuation ratios are estimated by dividing the value indicator by the price (E/P), which is then expressed relative to their comparable. As a consequence, a low value of this metric indicates that the firms we analyzed are valued more highly than their peers. For earnings- and sales-based ratios, the median is in the vicinity of 50%. This indicates that the median newly listed firm is valued much more highly (by approximately two times) than firms similar in terms of sector, size, and profitability. This finding also indicates that, for a large proportion of our sample, the valuations are optimistic. The valuation appears to be higher for RMs than for IPOs, but this result should be analyzed cautiously, because the other characteristics of the issuers are not accounted for. However, the mean ratios are higher than 1. This indicates that, on average, newly listed firms are valued less highly than comparable non-issuers. The large difference between the mean and the median indicates that the distribution of the valuation metrics is skewed. [Insert Table 2 About Here] Panel B reports tests and comparisons for the dummy variables. The proportion of new listings that report no revenue is similar in the two groups, around 30%. We also report the proportion of firms reporting revenues but negative earnings. It reaches 44.49% in the RM group vs. 30.26% in the IPO group. Both types of listing seem to be used by emerging firms, but the RM listing attracts a larger proportion of loss reporting firms than the IPO. The proportion of IPOs and RMs observed in the High-Tech and Materials-and-Energy sectors is similar. Many of the RM-listed firms (35.67%) are audited by one of the Big Five (Four) auditors. This is truer in the case of IPOs (44.01%), and the difference between the groups is significant. It is surprising to observe such high involvement of prestigious auditors in very small and generally still developing firms. The pre-listing market returns are significantly higher in the case of IPOs than RMs; this is in line with the link between public equity issuance and market sentiment..
(25) 21. IV. Methodology A. Self-selection Problem There is a self-selection problem in the choice of RMs and IPOs. This choice should be explained by the managers‟ long-run objectives (an unobservable set of variables) together with an observable set of variables. If managers want to develop the firm, they should consider listing through an IPO, which provides a more liquid market and potentially reduces the cost of equity because of the higher level of disclosure. If the managers‟ objective is to disinvest, or if they want to maintain a large degree of control over the public firm, then they will put less emphasis on these considerations and will prefer the RM listing option. Moreover, several exogenous and endogenous variables also can explain the choice. For example, IPOs can be easier and more frequent in hot issue markets. An RM would be the optimal choice if the required amount of money were small. The managers‟ objective is unobservable. We use the two-stage procedure of Heckman (1979) to estimate the self-selection model (similar to that used in closely related contexts; see, e.g., Choi 2007; Choi, Nelson and Pritchard 2009). In the first stage, consistent estimates are obtained from a probit regression of the dummy variable DIPOi, that equals 1 if the company i lists after an IPO, and 0 otherwise, on Zi, a vector of explanatory variables. These estimates are used to compute the inverse Mills ratios (IMR), λ0i. Then, in the second stage, the long-run returns and valuation equations are estimated by OLS with the IMR included as an additional explanatory variable (Heckman‟s Lambda), which is implemented using SAS where both subsequent outcomes are observable. Our self-selection model is given by: DIPOi = a1 + a2 DHTi + a3 DNRi + a4 DOGi + a5 LogAsseti + a6 Rm12m1i + a7 DNEi + a8 Pre B/Mi + ui. (1). This model is based on the general idea that better companies opt for the most stringent listing mode, to signal their quality, and to create the favorable conditions for future growth.24. Professionals present the RM listings‟ advantage (through the CPC program) as follows: (1) provides alternative access to capital when the firm is at too early a stage for a broadly distributed regular IPO, or the IPO market is not strong enough in general; (2) VC financing is not viable or management prefers not to use; (3) desire for a transaction that can retain higher ownership; (4) time to be a public firm; (5) greater flexibility, certainty, and control in the going-public process; and (6) going public transaction costs are known for the private firm. Source: Accessing Growth Financing Through the CPC Program. October 16, 24.
(26) 22. This relation between disclosure and future growth is evidenced by Hyytinen and Pajarinen (2005), who observe that firms in need of external finance voluntarily look for good disclosure quality. Sjostrom (2008 p.8) writes that in general only lower quality firms undertake RMs, because more attractive financing options are available to higher quality firms. Hence, going public through an RM signals to the market that the firm has probably been passed over by underwriters and is therefore of low quality. Moreover, we consider that the choice of the listing mode can be linked to the industry. As an example, the mining sector has a long tradition of RM, and the CPC program was initiated in the provinces where the Oil-and-Gas and mineral sectors are important. We include three dummy variables (DHTi, DNRi, and DOGi) that take the value 1 if the firm belongs to the Technology, Natural resources (Mineral), and Oil-and-Gas sector, respectively. The other firms fall into disparate activity sectors. We consider that the level of asymmetry is decreasing with firm size. We control for size by including the natural logarithm of pre-listing total assets (LogAsseti). The lack of positive earnings is the primary indicator of a low-quality issuer. We control for this dimension by including DNEi, a dummy variable that equals 1 if the issuing firm reports negative earnings before the listing. We consider that negative earnings are also a proxy for the heterogeneity of the expectation and information asymmetry. The probability of public firms issuing private over public securities is positively related to the measures of asymmetric information (Gomes and Phillips 2007) The choice of a RM listing implies that the secondary market for stocks will be less liquid than after an IPO, although in the Canadian case the differences are likely to be small. We propose that the firms will use an IPO listing more frequently when they have more growth opportunities. We use the classical measure for the relative weight of the growth opportunities, the book-to-market ratio. We estimate this ratio before the listing to avoid capturing a post-listing valuation effect. Pre B/M is estimated by dividing the shareholders‟ equity at the end of the previous fiscal year by the simultaneous market value.25 A high value of this ratio indicates a lack of growth opportunities. We expect a negative association between this ratio and the choice of an IPO. Firms are more likely to issue public equity than private equity when the market conditions 2006, presented by: Sean D. Caulfeild. Perley-Robertson, Hill & McDougall LLP, http://www.ocri.ca/events/presentations/dollars_sense/nov062.pdf 25 When the shareholders‟ equity at t-1 (SEt-1) was not available, we infer this value with the following expression: SE t-1 = SE0 – GP – EARN0, where GP and EARN stands for the gross proceeds of the IPO or private placement and EARN for the net earnings of the listing year, respectively..
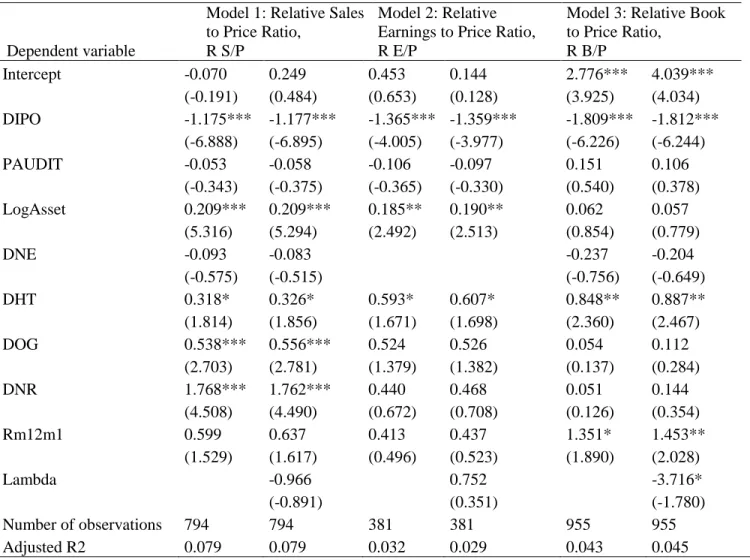
(27) 23. appear to be favorable (Gomes and Phillips 2007) We estimate this dimension by the market return during the 12 months preceding the listing (Rm12m1i). The constraint level and the age also can explain the choice of the listing mode, but they cannot be estimated for a sizeable part of our sample of RMs. Accordingly, we cannot use these variables for the whole study. However, we report the results for the sub-sample in Table 3. Heavily constrained firms are of lower quality and they need cash rapidly. Using an RM can provide cash more rapidly than using an IPO. However, doing an IPO can be difficult for a distressed firm. For each firm, we estimate the financial constraint indicator proposed by DeAngelo, De Angelo, and Stulz: pro forma cash/TAi= [cash, deposit, and short-term investment in year 1, less the gross proceeds of the issue] divided by the total assets in year 1. [Insert Table 3 About Here] Based on previous U.S. evidence, we consider that the choice of an IPO is more likely when the firms are larger, of better quality (reporting positive earnings), have superior growth opportunities, and when the market is more favorable to the IPO. Because of the high pricing for high-tech stocks that prevailed during a large part of the studied period, we suggest that there will be more IPOs in this sector. Table 3 summarizes the results of the model of choice used to control for the self-selection problem. The model is highly significant. All of the variables have the expected sign, except for the DNR dummy. The probability of the choice of an IPO is higher in this sector, a result that can be traced to the very good performance of this sub-sector in the stock market, in line with the increasing price of natural resources since 2000. B. Relative Valuation Metrics Our main hypothesis is that the choice of the listing mode influences the cost of equity. A firm should be valued more, all else being equal, when the listing follows an IPO rather than an RM. We analyze the valuation as stated by the investment bankers (in the case of IPOs) or by the private investors (in the case of RMs). Then, our logic is more in line with Kim and Ritter (1999) than with Purnanandam and Swaminathan (2004) who explain the market price following the IPOs. Using ordinary least-squares regressions, we explain the relative valuation metrics by the listing choice (DIPO) and by several control variables. The most important of these variables is the choice of a prestigious auditor (PAUDIT): it takes a value of 1 if the auditor is one of the Big Five (Four). Our second hypothesis is that prestigious auditors can have a positive influence on.
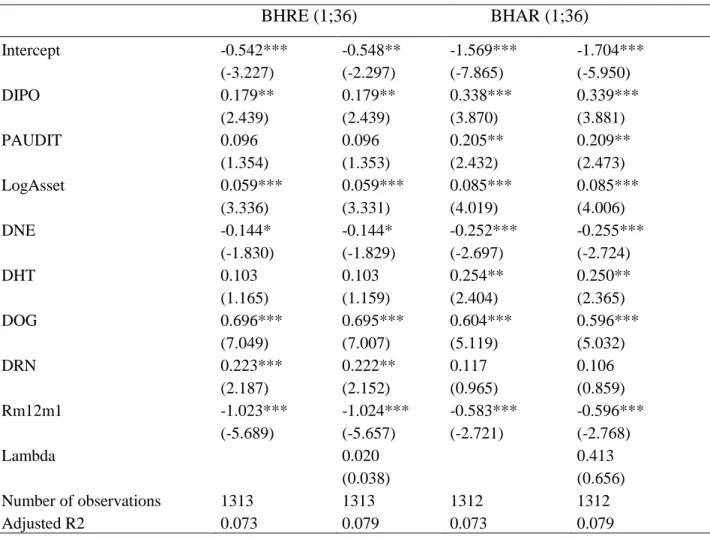
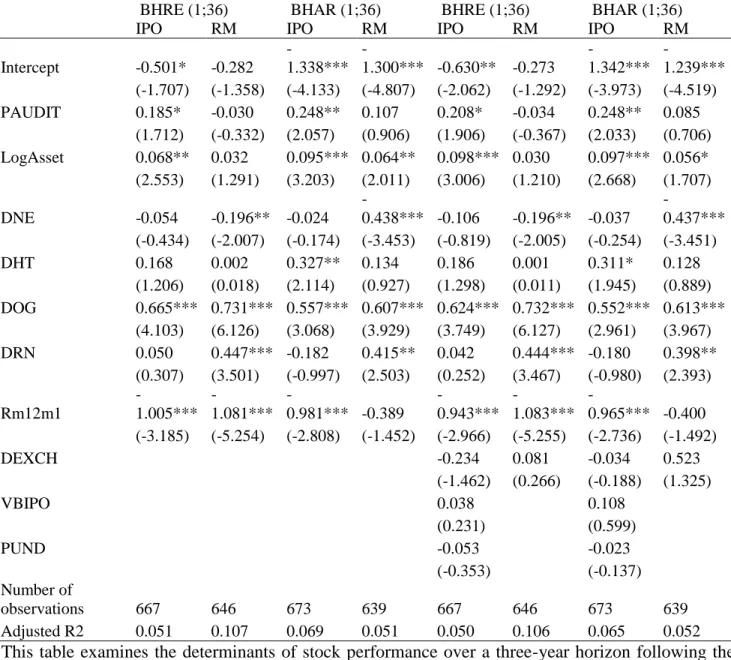
(28) 24. valuation, above and beyond the effect of the listing mode. We include additional control variables to consider two dimensions: the first is risk -- larger firms and those with positive earnings should obtain higher multiples, because they constitute less risky investments. All else equal, the required cost of equity should be lower. Second is sector: the accounting rules governing R&D reporting, such as the ones related to resource companies, are likely to influence the earnings and book values of the firms in these sectors. We can expect to observe systematic differences between the valuations in these different sectors. Moreover, the expectations of future revenues also may have systematically influenced market values. We control for the return of the market during the year preceding the listing to consider the potential effect of timing. We can expect higher values following the periods of rally in the market. To handle the self-selection problem previously discussed, we add the Heckman‟s lambda estimated in the probit model. This variable controls for the unobservable factors that influence the choice of the listing mode. C. Long-run Return Estimates The analysis of long-run returns is a complex empirical problem, particularly for penny stocks, whose distribution of returns is highly influenced by a few extremely high returns. The estimation of abnormal returns in such situations calls for particular care. Mainly, the test based on averages could have low predictive power because returns are strongly influenced by the right tail of the distribution.26 As a first step, we estimate the raw geometric returns for each issuer, for the 36 months following the issue. These returns are neither adjusted for the market nor for other factors like size and risk. However, in the area of very small capitalization, the adjustments allowing for estimation of excess return could produce significant noise, and the analysis of raw returns is of interest. As a second step, we estimate abnormal returns using the event-time methodology (BHAR, namely the investor‟s experience measure). These returns are estimated against reference portfolios composed of firms of comparable size and book-to-market ratios.27 To construct the. 26. The estimation of excess returns can also be complicated, because the returns on the benchmark portfolios, also composed of small capitalized stocks, can be heavily skewed. This is why we analyze the raw returns together with the excess returns. We cannot use accounting measures of performance because the majority of our firms report negative earnings. 27 Several authors use control-firm benchmarks in lieu of, or in complement to, the portfolio benchmark. We opt for portfolios. The characteristics of our sample are very specific, including a high proportion of.
Figure


+6

Documents relatifs
We have planned four days of scientific presentations and debates organized as oral and poster communications which will center around 5 major topics: Food and nutrient
A Lawrence oriented matroid [Lawrence et Weinberg, 1981] is the uniform oriented matroid obtained as the union of r uniform oriented matroids of rank 1 on the same ground
These Sherpa projeclS resulted from the common interest of local communities, whereby outsiders, such as Newar and even low-caste Sherpa (Yemba), could contribute
We study the probability of selling a product containing social or environmental claims based on different levels of cues (the non-verifiable green communication) and hard
In sum, these periods of stability are characterised by the fact that the elasticity of expectations is less than one (J. In this Keynesian vision, periods of instability
It is plain that we are not only acquaintcd with the complex " Self-acquainted-with-A," but we also know the proposition "I am acquainted with A." Now here the
The world supply of vegetable oils includes an abundance of an unsaturated and omega 6 (or n‐6) C18 fatty acid, linoleic, which has been declared for decades
