To link to this article:
DOI:10.1016/j.ndteint.2016.10.003
http://dx.doi.org/10.1016/j.ndteint.2016.10.003
This is an author-deposited version published in: http://oatao.univ-toulouse.fr/
Eprints ID: 17511
To cite this version:
Barus, Matthias and Welemane, Hélène and Collombet, Francis and
Pastor, Marie-Laetitia and Cantarel, Arthur and Crouzeix, Laurent and
Grunevald, Yves-Henri and Nassiet, Valérie Bonded repair issues for
composites: An investigation approach based on infrared thermography.
NDT & E International, vol. 85. pp. 27-33. ISSN 0963-8695
O
pen
A
rchive
T
oulouse
A
rchive
O
uverte (
OATAO
)
OATAO is an open access repository that collects the work of Toulouse researchers and
makes it freely available over the web where possible.
Any correspondence concerning this service should be sent to the repository
administrator: [email protected]
Bonded repair issues for composites:
An
investigation approach based on
infrared thermography
M. Barus
a
,
b
,
H.
Welemane
b
·
*
,
F.
Collombet
a
, M
.
L. Pastor
c
, A. Cantare
JC
, L. Crouzeix
a
,
Y.H.
Grunevald
<l
,
V. Nassiet
b
a Université de Toulouse, UI'3, IUT-ICA, Toulouse, France" Laboratoire Génie de Production (LGP), INP-ENIT, Université de Toulouse, Tarbes, France c Institut Clément Ader, IUT de Tarbes, Dpt GMP, Tarbes, France
d Composites Expertise & Solutions (CES), Castanet Tolosan, France
A R T I C L E
I N F O
A B S T R A C T
Keywords: Composite repair Experimental procedure Infrared thermography Heat transfer Numerical modelAn original approach based on active Infrared Thermography (IT) addresses the very challenging issue of the nondestructive analysis of bonded repaired CFRP laminates. Difficulties corne from the weak property contrast between parts of repaired assemblies and thickness of the joint. Strong attention is given here to the control of experimental tests conditions (heat Joad, boundary conditions), which allows to develop a physically consistent numerical mode) of the thermal problem. Comparison between measured and simulated surface temperature fields shows very good agreement regarding temporal and spatial evolutions for composites with different lay-up and offers new solutions for the NonDestructive Testing (NDT) of bonded repaired composites.
1. Introduction
Design of modern aircraft structures is mainly based on the use of large and noneasily dismantled composite parts. One of the main challenges for aeronautics stands thus in finding relevant and efficient solutions for their structural repair to account for local damages that may be induced in service (bird or vehicle collisions, impacts during plane loading/unloading or maintenance operations, ..). This question is specially difficult to address in the context of CFRP with complex and anisotropie mechanical behavior, but raises for a few years now a growing interest in view of economic issues [1].
The repair purpose is to restore structural properties and strength of the original design. Today, doublers-based solutions using mechani- cally fastened extra layers of reinforcement are the most conventional techniques for primary structures since they ensure redundancy in
structural elements. Yet, it is to note that such process often leads to the creation of new damages during drilling and bolting/riveting phase
[2] and, in all cases, leads to extra weight for the repaired structure since the patch dimensions (thickness and surface) may be significant compared to the damage extent. For adhesively bonded repair however,
the removed damaged volume is reconstructed by bonding a patch of same material as original on the parent one. This reduces additional
weight and tends to preserve the original aerodynamic profile (flush surface), which is of great interest for the repair of external skin panels for instance [3,4]. In case oflaminates, such repair procedure achieves also significatively the Joad transfer within the repaired area, providing a uniform shear dominant stress state and minimizing peel stresses in the adhesive layer [5,6].
For bonded repairs, adhesive bonding of the parent and repair materials requires most attention. The bond strength depends on several factors (type of adhesive, surface aspect, joint design, curing conditions,...) and, above all, is extremely sensitive to the existence of defects (porosity, kiss-bonding, delamination) inside the glue joint. In order to contribute to the reliability assessment of such repair technique, this work intends to provide a nondestructive approach based on active InfraRed Thermography (IRT) able to capture infor- mation on bonded joints of repaired primary structures. Precisely, IRT is an optical measurement technique of surface thermal fields usually used for the investigation of structural health (conventional NDT) or damage monitoring in aircraft structures [7,8]. In the active config- uration, the acquisition of infrared radiation emitted at the part surface and induced by an excitation source (such as ultrasonic waves [9], electromagnetic fields [IO], vibrations [11] and, most often, light source [12,13]) allows to identify defects inside materials. It is to note
•Corresponding author.
E-mail addresses: [email protected] (M. Barns), [email protected] (H. Welemane), [email protected] (F. Collombet), marie.laetitia.pastor@iut-tarbes. fr (M.L. Pastor), arthur.cantarel@iut-tarbes. fr (A. Cantarel), laurent.crouzeix @iut-tlse3.fr (L. Crouzeix), [email protected] (Y.H. Grunevald), valerie.nassiet @enit.fr (V. Nassiet).
YB
-Classical IRT set up
- Classical IRT set up
+
foam - New experimental strategyJ
d
.,
J
Y profile tiT(K) 2.5 1.25 Y profile tiT (K) 0.8 0.4a)
b)
c)
3 2.5g
i::: 0 · 1:::<Il.
>,
.... ....S'
1.5 0.5 0 0 20 40 60 80 100Distance along Y profile (mm)
d)
Fig. 1. Surface temperature variation AT for an Jnconel materia!: conventional device (a), insu!ated sample (b) and new procedure (c).Thermal fields (a,b,c) and Ytemperature profiles (d) at t=l2 s (step heat Joad begins at t=2 s). (For interpretation of the references to color in this figure caption, the reader is referred to the web version of this paper .)
Lamp
--- ---
'-shutter Sample Optical \ Convergent Jens cj> 65 mm,
axis focal lenght 250 mm
a
)
Sample (mat black) lnsulating material Holding pointsb)
Fig.2. Optical system (a) and sample insulation on back-side (b).that some post-processing of derived thermal fields may be necessary to reveal and localize more precisely these heterogeneities [10,14,15].
Regarding applications in the repair context, active IRT usually focusses on the detection of artificial defects introduced within the glue joint: Teflon inserts to simulate delaminations and disbondings [16- 18], grease mould release to represent kiss-bonding or dry fibers to account for porosities [19]. IRT is Jess common in the repair field. The detection capacity of this technique is essentially related to a high
property contrast - and thus gap in thermal response - between different parts of the repaired assembly. That is why existing works often deal with optimal configurations such as composite patch pasted on metallic [16,17] or concrete parent structure [18,20], or association of parent and patch made of different composites [21].
The configuration considered in this study corresponds to the industrial context of repaired aircraft primary structures, namely of carbon-epoxy composites (parent and patch) bonded by an epoxy glue.
2.3
Due to the very slight difference in the thermal behavior of constitutive parts of the repaired assembly, the nondestructive investigation of the bond joint represents a very challenging issue. Contrary to classical NDT investigations, such a question requires here to contrai as much as possible experimental conditions of active IRT tests. In this way, a specific device for heat load has been designed to master the distribu- tion and localization of the heat Joad and the boundary conditions (Section 2). This allows at the same time the definition of a finite element numerical mode! physically consistent with tests conditions (Section 3). From these results, it becomes possible to study the very complex situation of repaired assemblies and to compare measured and simulated temperature fields for different composites lay-up (Section 4).
2. New experimental strategy
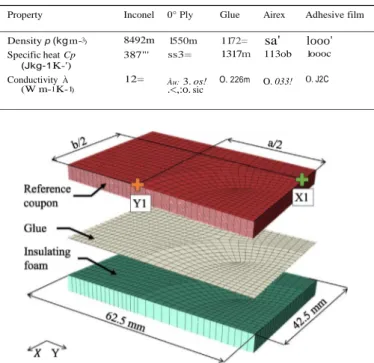
Table 1
Fig. 3. Specific experimental device.
Insulating foam
y
("\v
Fig. 4. Schematic representation of the thermal problem.
Current active thermography devices are mostly based on hetero- geneous lighting and generally suffer from edge effects [22,23]. Let consider for instance an Inconel plate submitted to a step heat load of 10 s generated by a halogen lamp (maximum power of 1000 W). Inconel sample of 0.9 mm thickness is painted with black color (so as to consider the emissivity of carbon, € = 0.98) and thermal acquisition is done using a FLIR Titanium SC7000 retrofitted camera (InSb sensors, thermal resolution of 25 mK, focal plane of 320x256 pixels) associated with Altaïr software. Fig. 1a of the surface thermal variation
t;,.T = T (t) - T0 (t = 0) field and Fig. ld of the related Y temperature
profile typically illustrate inconsistencies associated to such a config- uration, namely local overheating of the part surface, local cooling on edges and even heat sink at the metallic holding point. As a conse- quence, simulation models of these tests systematically introduce corrective factors to corroborate experimental measurements
[20,24,25]. Accordingly, if these conventional devices remain suitable to capture defects that highly contrast with their integration environ- ment, the challenging issue of composites repair with very weak thermal property contrast basically requires the development of a specific experimental protocol.
Following specifications have been addressed to avoid aforesaid Thermal and physical properties of materials (m: measurement, b: bibliography, f:
furnisher, c: calibration); thermal properties measured by Hot Disk TPS 25008; axial (Àa)
and transverse (À,) conductivity of composite ply.
Property Inconel 0° Ply Glue Airex Adhesive film
difficulties : (1) the knowledge of the heat flow (location and intensity distribution), (2) the contrai of boundary conditions, (3) the limitation of environmental disturbing effects. Under these conditions, we intend to obtain more refined tests with far Jess disturbance and uncertainty, which furthermore, can be modeled with consistency.
Density p (kgm-3) 8492m 1550m 1172= sa' looo' Precisely, the thermal excitation is achieved by means of a halogen lamp delivering initially a nonhomogeneous heat flow. Setting a shutter at its output reduces the generated light beam diameter and a convergent Jens, placed on the optical axis of the lamp, converts as much as possible the divergent light beam into a parallel beam (Fig. 2a). In order to contrai boundary conditions, tested samples are
pasted on a reticulated polymer foam (Airex® C70.75) with an epoxy
glue (SR1126 and SD8205 hardener) and assemblies are held at the foam bottom (Fig. 2b). Such a foam thermally insulates the back face of the sample and avoids thermal sink at the holding point.
All elements (lamp, shutter, Jens, sample, camera) are inserted into a rigid metallic support that determines precisely the position of the thermal stimulation on the sample (Fig. 3). In view of industrial applications, the reflection configuration has been favoured, for which bath the thermal camera and the heat source stand on the same side of the part. Since the sample surface should be in the camera focal plane, the sample is sloped relative to the light source (forming an angle of 25°) and the heat impacted area thus exhibits an elliptical shape whose dimensions are fixed by the Jens diameter and the inclination angle (namely a
=
65 mm wide along minor axis and b=
72 mm long along major axis).Note that distance between the lamp and the sample along the light axis is equal to d = 760 mm and that distance between the Fig. 5. Constitutive parts of the FE model for the study of virgin materials.specimen and the camera (d' = 670 mm) defines the pixel size, namely
0.4x0.4 mm2. Moreover, so as to limit most disturbing effects of the
:rhermal camera
Specific heat Cp 387"' ss3= 1317m 113ob 1oooc
(Jkg-1 K-') Conductivity À (W m-1K-1) 12= Àu: 3. os! .<,:o. sic O. 226m O. 033! O. J2C
"
j
e
"
f
\
e
Analysis area Y profile 6T(°C} 0.8 X profile 0.4E
0 "iii 1ii1
2,5 2,,---"
.
·
·
.
:
.
.
.
··
·
···
·
··
···
·
·
..
·
·
··
··
·
·
·
·
·
···
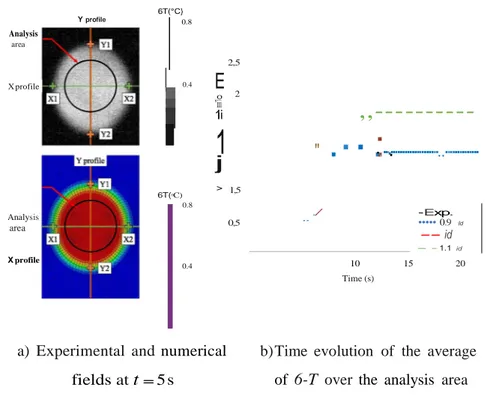
> 1,5 Analysis area X profile 6T(0C) 0.8 0.4 0,5 ./ -Exp. ••••• 0.9 Id -- id - - 1.1 id 10 15 20 Time (s)a) Experimental and
numerical
fields at
t
=5 s
b)
Time evolution of the average
of
6-T
over
the analysis
area
Fig. 6. Surface temperature variation l;.T for an Inconel material (points X2 and Y2 are symmetric of Xl and Yl respectively). (For interpretation of the references to color in this figure caption, the reader is referred to the web version of this paper.)
2.5 2 .
"
9 - 1.5"
>'
e
2g_
E 0.5 2.5E
2 c: .9 0 0 2 4 6 8 10 12 14 16 18 20 22 Time (s)a
)
2.5 2t
"
·""
> 1.5 2...
e
o. E 0.5 0 ,. ·;,.' .r+# \\71f 11
r;,v;r,.
,
.,_
,
..
:
I I ' ' I ' "1 \\ --Exp. (t = 7 s) -Num.(t = 7 s) \ · ···Exp. (t = 12 s) •••••• Num. (t = 12 s) ---Exp. (t = 17 s) ---Num.(t = 17 s) 0 20 40 60·f
1.5"'
e
2 ..,
o. E 0.5 0 80 0 Distance along X profile (mm)b)
Distance along Y profile (mm)c)
Fig. 7. Surface temperature variation t;.T for a [0/90/0]6 composite: time evolution of the average of t;.T over the analysis area (a); X (b) and Y (c) profiles. (For interpretation of the references to color in this figure caption, the reader is referred to the web version of this paper.)
--Exp. (t = 7 s)--Num . (t = 7 s)
···Exp. (t = 12 s) •••••• Num. (t = 12 s)! ---Exp.(t = 17 s) ---Num. (t = 17 s)
time t. From the thermodynamics principles and Fourier conduction
law, one can thus obtain the well-known expression of the local heat
equation (without internai sources): pCP a
a
Ti
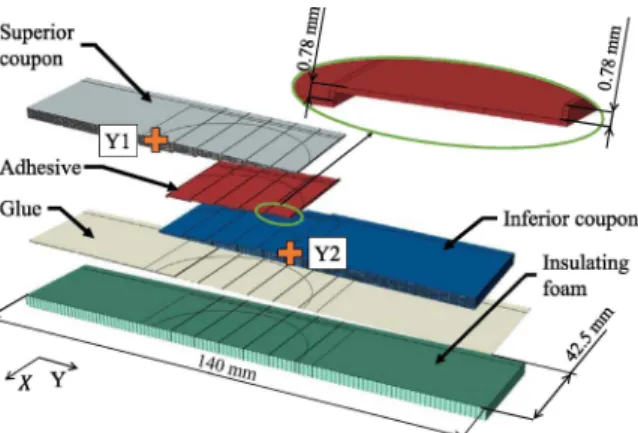
- div (À·grad T) = 0, V M E V (1)Fig. 8. Constitutive parts of the FE mode! for the study of repaired assemblies.
environment, the bench is entirely covered with a black sheet during measurement.
with p the material density, Cv its specific heat and À its thermal conductivity tensor. According to experimental conditions, heat flow on
the elliptical impacted area S1 (dimensions a and b) is assumed to be
homogeneous (with intensity <P) and evolves in form of a step of 10 s
(beginning at t=2 s, end at t=l2 s). In view of low temperature
variations induced within the material, convective and radiative
phenomena are neglected (these assumptions were confirmed by a
sensibility analysis, see also [25]). Finally, the initial state is defined by the ambient temperature measured within the laboratory. Spatial and
temporal boundary conditions for the problem can thus be summarized
by (see Fig. 4):
The different configurations presented in Fig. 1allow to emphasize
the contribution of the new experimental procedure. All these results were obtained for the same material (Inconel), thermal solicitation and
equipment (lamp and camera) as the ones considered in Fig. la. Note
n·(kgrad T) = efJ, { n·(À·grad T) = 0, T (x, y, Z , t
=
0)=
To=
Tamb• V M E S1 't/ M E S - S1 V M E V (2)also that distances d and d' are also the same for all figures. Compared
to conventional device (diffuse light, metallic holding point, Fig. la and orange line in Fig. ld), the insulation of the sample avoids heat sink at
the holding point (close to YB, Fig. lb and blue line in Fig. ld). Yet, the diffuse lighting still generates some edge effects and heterogeneous surface heating (close to YA for instance). The addition of the optical system clearly solves this last difficulty and allows a significant
improvement regarding the load distribution (Fig. le and black line in Fig. ld). Even if the shutter and the Jens globally reduce the amount of heat flow received by the sample (and therefore the level of
temperature induced on its surface), the new experimental strategy
leads to a quasi homogeneous heat Joad intensity on a delimited and
defined (elliptical) area on the sample surface. This original approach seems then to offer a proper experimental framework regarding bath
the Joad and boundary conditions, that could be easily integrated in terms of numerical modelling.
3.Modelling strategy and heat flow intensity identification
The representation of heat transfer inside the material can be
modelled using the classical thermodynamics background [26]. Let us consider V the volume of the Representative Volume Element (RVE) of
the material, S its outer boundary and n the outward unit normal to S.
T = T (x, y, z, t) denotes the local temperature of point M (x, y, z) of Vat
l>T (0C) 1.3
0.9
0.5
Note that the transient thermal response of materials deduced from Eq. (1)is numerically solved in what follows by finite element method.
In order to fully determine the thermal Joad, it is necessary to
quantify the heat flow intensity <P that impacts the sample. The Finite
Element Mode!Updating (FEMU) technique has been implemented in
this way, using ABAQUS software. At this stage, the sample material in Fig. 4 is the Inconel alloy studied previously (monolithic, isotropie, see
properties in Table 1).
Assuming perfect contact, the 3D numerical mode!of the heated
assembly includes trough a partition the three constituents (Inconel sample, epoxy glue and Airex insulating foam, Fig. 5). A convergence study has been conducted to ensure the results stability according to
the mesh size leading to an average element size of 2 mm (7290 heat
transfer elements DC3D20, mean aspect ratio b = 6.37 and 0.62%
elements exhibit a ô > 10, Fig. 5).
Using FEMU method, heat flow intensity is determined so as to reduce the gap between numerical and experimental average surface
temperature over a central area (called analysis area, Fig. 6a). Global
response of the model (Fig. 6b) shows its physical consistency with
experimental measures and leads to an identified value of efJ = </J;d = 500 W m-2 with a root mean square error on the average
!:.T of 0.019 mK which are Jess than the thermal camera measurement noise. Simulation for ± 10% values of <P;d are shown in Fig. 6b that
illustrate the relevance of such identification. Since simulations are essentially sensitive to the Inconel properties (that were al!identified
a)
Field
at
t
= 5s
0.5
0 0
Position along Y profile (mm)
b)
Y
profiles
Fig. 9. Experimental and numerical surface temperature variation b.T for a [0/90/0]5 composite repaired assembly. Limits of steps are indicated by green lines (respective depths:
3.9 mm (1), 3.12 mm (2), 2.34 mm (3), 1.56 mm (4), 0.78 mm (5)). (For interpretation of the references to color in this figure caption, the reader is referred to the web version of this
1.4
t
1.2 1.4t
1.2 - Exp.{t = 17 s) - Num. (t = 17 s).
9
-"" 0.8
1:! il 0.6:::
0.4 2.
,,,
0.2"
0 -0.2 c .9 ·""
0.8 1:! il 0.6:::
0.4 § 0.2 · ,;;: -".;' <>:: 0 20 40 60 80 100 0 20 40 60 80 100Position along Y profile (mm)
a)
[0/90/0]
6 -t = 12 s
Position along Y profile (mm)b) [0/90/0]
6 -t = 17
s
1.4t
1.2 c .9 ·""
0.8:::
0.6 0.4 2 0.2 · ,;;:"'
0 -0.2 [ --Exp. t = 12 s) - Num. (t = 12 s) 1 0 20 40 60 80 100Position along Y profile (mm)
c)
[0]
18 -
t
=
12 s
1.4 c .9·
"
=
"
0.8e
0.6"
E"
0.4 2 - 0.2""
-0.2 Y l - Exp. (t = 17 s) - Num. (t = 17 s)OJ w w w
OJ
I
.,
,,.
"''" lif
,
..,.
,..-0 20 40 60 80 100Position along Y profile (mm)
d) [0Ji
8
-
t
=
17
s
Fig. 10. Relative temperature tJ.2T along Y profiles for repaired assemblies. Limits of steps are indicated by green lines (respective depths: 3.9 mm (1), 3.12 mm (2), 2.34 mm (3),
1.56 mm (4), 0.78 mm (5)). (For interpretation of the references to color in this figure caption, the reader is referred to the web version of this paper.)
experimentally), this gives full confidence in the representation and
identification.
Considering the initial issue of this study, the thermal response of a
virgin (nonrepaired, monolithic) anisotropie composite laminate under
identical conditions and Joad is examined. The sample material in
Fig. 4 is now a composite material composed of 18 plies of MIO epoxy
resin and T300 carbon fibers with [0/90/0]6 stacking sequence (4.7 mm
global thickness, monolithic, orthotropic with properties of transver-
sally isotropie ply given in Table 1). The problem geometry is processed
in the same manner as previously (Fig. 5) and the modelling of the composite material integrates each ply with related orientation (leading to a total of 13220 elements with 8 = 8.99 and 6.08% elements are such that /5 > 10). Lacking precision on the transverse conductivity À, of the 0° composite ply, this data has been calibrated to match the global material response obtained with heat flow </J;d (Fig. 7a). To test the derived representation, one investigates the spatial distribution of
surface temperature by means of temperature profiles drawn at different steps (Fig. 7b and 7c). Results are very satisfactory with a
good agreement between numerical and experimental responses during
heating and cooling phases, which is particularly noteworthy for such a
complex anisotropie context. Note that some slight differences are
observed on the edges on profiles of Fig. 7b and 7c (near Xi and Yi
points) that are due to geometric aberrations of the convergent Jens
and that can be reduced using a Jens of a better optical quality. The
physical relevance of the mode!should also be underlined through its
ability to account for the competition effect between the weak
transverse thermal conductivity of composites plies (that induces a
rapid evolution of temperature at the beginning of the heat) and their
important specific heat (that requires a substantial energy to raise the
material temperature), leading to a nonlinear evolution of average 1:!,.T
(Fig. 7a).
4.Study of bonded repair assernblies
Two laminated composite types, namely [0/90/0]6 (orthotropic) and
[0]18 (transversally isotropie) made of carbon-epoxy composite plies
described in Section 3, have been bonded to form repaired assemblies with step lap geometry (0° ply orientation corresponds in what follows to Y axis). Each step has a length of 12 mm and a thickness of0.78 mm,
which leads to a total of 5 steps within laminates thickness. Elementary coupons have been machined by water jet to guarantee an optimal
surface quality and to reduce delamination [27]. A structural epoxy adhesive film (ST1035) with a thickness of 0.3 mm is next applied on the connecting surface and polymerized by means of a heating bench. As before, repaired assemblies are finally pasted on the polymer foam with epoxy glue.
Experimental investigations on repaired assemblies have been
handled with the new IRT device and for the same step heat Joad as
previously with a heating area that covers along Y axis both virgin and
repaired areas. Regarding the numerical modelling, a similar strategy as in Section 3 (assumptions, sample material of Fig. 4 being the repaired assembly in that case, elliptical heat Joad with heat flow </J;d
applied on the superior coupon) has also been implemented. Given the
complexity of the present geometry, note that it is better to define each part independently with perfect contact between them, while ensuring coïncidence between the mesh nodes at the contact surfaces (89 383
elements with 8 = 8.71 and 12.7% elements with a /5 > 10, Fig. 8). Note also that some adhesive film goes up to the surface during the repair
procedure (as integrated in the numerical model, zoom in Fig. 8). This gives a direct access to the thermal response of the joint (local temperature peak corresponds to the joint flush, see in Fig. 9), whose
temporal evolution allows to calibrate missing properties of the
adhesive film (Table 1).
Fig. 9 provides surface temperature variations for repaired assem-
blies. If we examine Y profiles obtained at different times (Fig. 9b), we
observe that most important t:.T are near point Y2. Indeed, such a zone
is strongly affected by the joint (the temperature peak indicates the
position of its flush area on the assembly surface and thus the end of
repair steps). Since the adhesive film exhibits a weaker thermal
effusivity e = )pJ.Cp than composites (Table 1), it acts as a barrier for the heat Joad. More the joint is close to the surface (that is close to
Y2), more it avoids the heat diffusion inside the thickness and more the
composite temperature rise at this point is important. For this reason, one can already locate the shallowest repair step on t:.T profiles for
times corresponding to the strong overheating (Fig. 9b at t=7 s and
t=12 s for instance).
Yet, in view of the important heat capacity of thejoint , its insulating
character only leads to low amplitude temperature increase for
repaired assemblies compared to virgin materials (thermal peak of
the joint is about 0.6 °C more than adjacent composites). In order to improve results interpretation for repair cases, is introduced the so- called relative temperature:
bonding defects. In this way, the present numerical model will allow to
investigate the relevance of introducing specific additives inside the
bonded joint to exacerbate its thermal response.
References
[1] Katnam K, Silva LD, Young T. Bonded repair of composite aircraft structures: a review of scientific challenges and opportunities. Progr Aerosp Sei 2013;61:26-42.
[2] Liu D, Tang Y, Cong W. A review of mechanical drilling for composite laminates.
Compas Struct 2012;94(4):1265-79.
[3] Baker A, Gunnion JA, Wang J. On the certification of bonded repairs to primary
composite aircraft components. J Adhes 2015;91(1-2):4-38.
[4] Harman AB, Wang CH. Improved design methods for scarf repairs to highly strained composite aircraft structure. Compas Struct 2006;75(1-4):132-44.
[5] Tomblin J, Salah L, Welch J, Borgman M. Bonded Repair of Aircraft Composite Sandwich Structures. Washington , DC: Office of Aviation Research, Federal Aviation Administration; 2004.
[6] Wang CH, Guunion AJ. Optimum shapes of scarf repairs. Campos Part A: Appl Sei Manuf 2009;40(9):1407-18.
[7] Maldague X. Nondestructive evaluation of materials by infrared thermography. London, United Kingdom: Springer-Verlag; 1993.
[8] Munoz V, Valès B, Perrin M, Pastor ML, Welemane H, Cantarel A, et al. Damage detection in CFRP by coupling acoustic emission and infrared thermography. Campos Part B: Eng 2016;85:68-75.
[9] Spiessberger C, Gleiter A, Busse G.Aerospace applications oflockin-thermography with optical, ultrasonic, and inductive excitation. In: International symposium on
NDT in aerospace, Fürth, Germany, 3-5 December, 2008.
[10] Gao B, Woo W, Tian G. Electromagnetic thermography nondestructive evaluation: physics-based modeling and pattern mining. Sei Rep 2016;6:25480.
[11] Wagner D, Ranc N, Bathias C, Paris PC. Fatigue crack initiation detection by an
1172 = LiT (repaired material) - t:.T(virgin material) (3) infrared thermography method. Facture Frac! Eng Mater Struct 2009;33:12-21.
[12] Meola C, Boccardi S, Carlomagno GM, Baffa ND, Monaco E, Ricci F.
where both variations t:.T respectively related to repaired assembly and
associated virgin material are obtained under same conditions (Joad and boundary conditions) and correspond to the same time. Such post-
processing removes Jens edge effects and, above all, helps to precisely
capture the joint response and repair influence.
The good agreement between experiments and simulation is
illustrated on the spatial distribution of t:.Ti along Y axis for the two
composites during both heating and cooling phases (Fig. 10). For areas
outside interval [Yl-Y2], no changes in
11
7i
occur since they match thevirgin material, that is 18 plies of superior (respectively inferior) coupon for Yl (resp. Y2) side. Then the current light source (that is
</J;a) makes it possible to distinguish the three shallowest repair steps
through surface temperature increase on the superior coupon.
Comparing the two lay-up shows first that the temperature increase
is overall lower for the [0/90/0fo composite. This is due to its more important diffusivity d =_cA in the X direction that leads whatever the
p p
depth to a more rapid conduction of overheating towards the sides
(along X axis). On the other hand, the more important diffusivity of the
[O]i8 composite in the Y direction increases the heat flow propagation
along such direction and induces less pronounced gaps between steps
on Y profiles. For both materials, the deepest repair steps (standing at
more than 3 mm depth) are not accessible right now, which is
consistent with limits in investigation depths usually encountered by
IRT studies with the considered light source [28]. In ail cases, the conduction behavior within the material thickness tends to smooth the
response of the joint whatever during the cooling phase.
5. Conclusion
The new IRT device proposed in this study allows a clear improve
-ment for experi-mental mechanics and, specially, for the nondestructive
study of bonded repaired composites.Attention was paid to the control of experimental conditions so as to be able to develop a consistent
numerical mode} of the thermal problem. First results shows a good correlation between measured and simulated temperature fields and allow to highlight the specific infrared response of the bonded joint inside the repair assembly. Further studies are needed now to be
conducted to improve the visibility of thejoint, in particular to identify
Nondestructive evaluation of carbon fi.ber reinforced composites with infrared thermography and ultrasonics. Compas Struct 2016;134:845-53.
[13] Lizaranzu M, Lario A, Chiminelli A, Amenabar I. Non-destructive testing of composite materials by means of active thermography-based tools. Infrared Phys Technol 2015;71:113-20.
[14] Montanini R, Quattrocchi A, Piccolo SA.Active thermography and post-processing image enhancement for recovering of abraded and paint-covered alphanumeric identification marks. Infrared Phys Technol 2016;78:24-30.
[15] Poudel A, Mitchell KR, Chu TP, Neidigk S, Jacques C. Non-destructive evaluation of
composite repairs by using infrared thermography. J Campos Mater
2016;50(3):351-63.
[16] Avdelidis N, Moropoulou A, Marioli ZR. The technology of composite patches and their structural reliability inspection using infrared imaging. Progr Aerosp Sei 2003;39(4):317-28.
[17] Genest M, Martinez M, Mrad N, Renaud G, Fahr A. Pulsed thermography for non- destructive evaluation and damage growth monitoring of bonded repairs. Compas Struct 2009;88(1):112-20.
[18] Tashan J, Al-Mahaidi R. Bond defect detection using PTT IRT in concrete structures strengthened with different CFRP systems. Compos Struct
2014;111:13-9.
[19] Waugh R. Development of infrared techniques for practical defect identification in
bonded joints [Ph.D. thesis]. University of Southampton; 2014.
[20] Waugh R, Dulieu-Barton J, Quinn S. Modelling and evaluation of pulsed and pulse phase thermography through application of composite and metallic case studies. NDT & E nt 2014;66:52-66.
[21] Schroeder J, Ahmed T, Chaudhry B, Shepard S. Non-destructive testing of structural composites and adhesively bonded composite joints :pulsed thermo- graphy. Compas Part A: Appl Sei Manuf 2002;33(11):1511-7.
[22] Amenabar , Mendikute A, L6pez-Arraiza A, Lizaranzu M, Aurrekoetxea J. Comparison and analysis of uon-destructive testing techniques suitable for delamination inspection in wind turbine blades. Compas Part B: Eng 2011;42(5):1298-305.
[23] Mitchell K, Poudel A, Li S, Chu T, Mattingly D. Nondestructive evaluation of
composite repairs. In: Proceedings of ASNT 2013 fa!!conference, Las Vegas (USA),
2013, November 4-7.
[24] Aktas A, Gower M, Shaw R, Simpson R, Wright L, Gnaniah S, et al. Nondestructive
testing of defects in thick composites by means of pulse and Iock in thermography
techniques. In: Proceedings of the 20th International Conference on Composite Materials (ICCM20), Copenhaguen, Deumark, 19-24 July, 2015.
[25] Krishnapillai M, Jones R, Marshall I, Bannisterand M, Rajic N. Thermography as a
tool for damage assessment. Compas Struct 2005;67(2):149-55.
[26] Germain P, Nguyen QS, Suquet P. Continuum thermodynamics. J Appl Mech 1983;50:1010-20.
[27] Cénac F, Collombet F, Déléris M, Zitoune R. Abrasive water jet machining of composites. In: Machining composite materials. London (United Kingdom): STE,
Wiley; 2009. p. 167-80.
[28] Munoz V, Perrin M, Pastor ML, Welemane H, Cantarel A, Karama M.Application of nondestructive testiug to the detection of aeronautical defects in composite