O
pen
A
rchive
T
OULOUSE
A
rchive
O
uverte (
OATAO
)
OATAO is an open access repository that collects the work of Toulouse researchers and
makes it freely available over the web where possible.
This is an author-deposited version published in :
http://oatao.univ-toulouse.fr/
Eprints ID : 19842
To link to this article : DOI:
10.1149/2.0391713jes
URL :
http://dx.doi.org/10.1149/2.0391713jes
To cite this version :
De Abreu, Caio Palumbo and Costa, Isolda and
De Melo, Hercílio Gomes and Pébère, Nadine and Tribollet,
Bernard and Vivier, Vincent Multiscale electrochemical study of
welded al alloys joined by friction stir welding. (2017) Journal of
The Electrochemical Society (JES), vol. 164 (n° 13). C735-C746.
ISSN 0013-4651
Any correspondence concerning this service should be sent to the repository
administrator:
[email protected]
Multiscale Electrochemical Study of Welded Al Alloys Joined by
Friction Stir Welding
Caio Palumbo de Abreu,a,bIsolda Costa,a,zHerc´ılio Gomes de Melo,cNadine P´eb`ere,d Bernard Tribollet,b,∗
and Vincent Vivierb,∗∗
aInstituto de Pesquisas Energ´eticas e Nucleares, Centro de Ciˆencia e Tecnologia de Materiais, Cidade Universit´aria,
CEP 05508-000 S ˜ao Paulo SP, Brasil
bLaboratoire Interfaces et Syst`emes ´Electrochimiques, UPR 15 du CNRS, Universit´e Pierre et Marie Curie, CP 133,
75252 Paris Cedex 05, France
cUniversidade de S˜ao Paulo, Depto. de Eng. Metal´urgica e de Materiais, 05508-030, S ˜ao Paulo-SP, Brasil dUniversit´e de Toulouse, CIRIMAT, UPS/INPT/CNRS, ENSIACET, BP 44362, 31432 Toulouse Cedex 04, France
Friction stir welding (FSW) is an efficient way to join high strength aluminum alloys. However, FSW generates different microstruc-tural areas in contact that may give rise to galvanic couplings, affecting the corrosion resistance of the assembly. In the present work, a multiscale electrochemical study of the 7475-T651 and 2024-T3 aluminum alloys butt-joined by FSW was carried out. Much lower impedances were associated with the FSW affected zones compared to the two aluminum base metals tested individually. Corrosion of the welded system resulted in the establishment of galvanic coupling, shown by local electrochemical impedance spectroscopy (LEIS) measurements, at which the AA7475 behaves anodically with respect to the AA2024. A Zn deposit was observed on the intermetallic particles of the AA2024 after 24 h of immersion in the electrolyte resulting from the galvanic coupling, which seems to reduce the galvanic coupling effects. Such a behavior in combination with LEIS results allowed a description of the galvanic coupling development between two different aluminum alloys (AA2024-T3 and AA7475-T761) butt-welded by FSW as a function of time from the early stage of immersion.
DOI: 10.1149/2.0391713jes
Research in the aircraft industry has been strongly focused on weight reduction, with consequent decrease in fuel consumption and lowering of emission of greenhouse gases. There are two main ways
to achieve this goal: (i) by lowering the density of the materials,1
and/or (ii) by employing new joining procedures to substitute rivets in overlaying sheets. For instance, each wing of the Airbus A380 contains
750,000 rivets,2 whereas the assembly of the Boeing 747–8 have
1,000,000.3Therefore, industry experts estimate that the reduction of
the overall weight of aircrafts by these two main ways can reach 15%.4
Conventional welding procedures are not effective for joining high strength aluminum alloys, including the 2xxx and 7xxx series. They lead to defects due to differences between thermal expansion coeffi-cients of the solidified regions and the liquid phase, creating several
cracks in the final stage of the weld solidification.5,6Besides, large
differences in the mechanical strength between the base metals and the
welded joint have been reported.7The Friction Stir Welding (FSW)
process, developed in the 90’s at TWI (The Welding Institute – UK)
was a major breakthrough for joining high strength Al alloys.8 In
this process, welding occurs in solid state, resulting in metallurgical benefits such as good dimensional stability and excellent mechanical properties in the joint area due to the recrystallized microstructure in
the stir (central) zone of the welding.9It has been reported that FSW
joints of Al alloys show both a superior hardness when compared to
tungsten inert gas (TIG) welded ones9and superior fatigue strength
when compared with conventional arc-welding processes.10However,
the heat input and the mechanical deformation of the parts during the FSW process provoke changes in the microstructure, creating three distinct regions, namely the nugget zone, the thermomechanically af-fected zone (TMAZ) and the heat-afaf-fected zone (HAZ) besides the unaffected base metal (BM).
Due to the known influence of microstructural features and resid-ual stresses on the corrosion behavior of metals and alloys, some works have focused on investigating the corrosion of Al alloys joined by FSW. Most of the results indicate inferior corrosion resistance of the welded joint in comparison with the BMs, and the literature sur-vey clearly shows that the locus of the less resistant zone depends on
both the alloy and the welding parameters.11For instance, Lumsden
et al.12and Wadeson13 showed that the interface between the HAZ
∗ Electrochemical Society Fellow. ∗∗ Electrochemical Society Member.
zE-mail:[email protected]
and the TMAZ was preferentially corroded for the AA7050-T7651
and the AA7108, respectively. Conversely, Paglia and Buchheit14
re-ported higher corrosive attack at the interface between the nugget and
the TMAZ in a study on FSW AA7050-T7451. Kang et al.15carried
out immersion tests of FSW AA2024 sheets in EXCO solution, and showed that pitting corrosion started and was more intense in the central region of the weld, which is conflicting with the results
ob-tained by Bousquet et al.16in chloride solutions. Finally, for a FSW
AA2024, Jariyaboon et al.17found that the region most susceptible
to corrosion was always the weld-affected zone, however the specific region depended on the welding parameters.
Only few works reported on the corrosion of dissimilar aluminum alloys joined by FSW. For butt-welded AA5083 and AA6082, Donatus
et al.18showed that the two HAZ of both alloys were the most
suscep-tible regions to corrosion, even though through different mechanisms. In addition, corrosion developed at the junction of the two alloys, with
the Mg-rich AA5083 acting as anode. Patil and Soman19 evaluated
the corrosion resistance of butt-welded AA6082 and AA6061 and showed that the corrosion resistance increased with the tool traverse speed when the AA6082 was positioned at the advancing side, whereas it decreased when it was positioned at the retreating side.
Addition-ally, Bertoncello et al.20studied the corrosion behavior of lap-welded
AA7050 and AA2024 using conventional electrochemical techniques and SVET in NaCl solution. A greater pitting susceptibility was shown at the nugget zone of the AA7050 at the open circuit potential, which was ascribed to intense galvanic coupling.
Although the corrosion activity in the weld-affected zone has been frequently associated with galvanic coupling effects, techniques mea-suring the intensity of this phenomenon were seldom used. Proton
et al.21and Donatus et al.18employed a zero resistance ammeter to
identify the current flow between the different weld zones21or
be-tween the two dissimilar alloys that were welded by FSW.18In both
cases, the anodic region was clearly identified, but such an experiment required the physical separation of the zones, which, at a minimum, can modify the real ionic flux between the two regions under investi-gation and the chemistry at the interface.
Local electrochemical impedance spectroscopy (LEIS), devised
by Isaacs,22 was shown to be useful for mapping of heterogeneous
reactivity of corroding samples,23and has already been successfully
employed for studying the galvanic coupling at the junction between
two different materials.24–27For instance, Jorcin et al.24investigated
Table I. Chemical compositions (wt%) of the aluminum alloys.
Element Al Mg Cu Zn Si P S Ca Ti Cr Mn Fe
2024 Bal. 1.60 4.80 0.08 0.19 0.03 0.02 0.04 0.05 0.04 0.64 0.22
7475 Bal. 1.90 1.70 6.20 0.15 0.03 0.05 0.06 0.04 0.22 0.02 0.12
pure copper from the early stages of immersion. Similarly, Lacroix
et al.25studied the interface between pure aluminum and pure
magne-sium, which mimics the first step of the S phase particles (Al2CuMg)
dissolution in the AA2024. In these works, the LEIS technique was ef-ficient in establishing the mechanisms involved in galvanic coupling.
Specifically, for welded substrates, Sidane et al.26used scanning
elec-trochemical microscopy (SECM) to evaluate the corrosion behavior of the different zones formed by FSW of AA2050-T8 with AA7449-T79. The difference in kinetics observed over the passive layer formed above the nugget region of the two alloys was ascribed to a strong galvanic coupling. In the same study, LEIS was also used in a low cor-rosive medium to confirm the intense galvanic coupling on the nugget
area.26In an earlier study, De Lima-Neto et al.27used LEIS to
investi-gate sensitization in AISI 304 stainless steel welded by shielded metal arc and verified that local impedance was lower above the sensitized zones. The authors suggested that the high frequency inductive loops on the LEIS diagrams could reflect the galvanic coupling between the weld string (anode) and the welded stainless steel plates (cathode).
Even though several works on the corrosion behavior of FSW aluminum alloys have been published in the last years, only few of
them have used local electrochemical techniques.17,20,26In the present
study, macroscopic corrosion tests and both global and local elec-trochemical techniques were used to investigate the local corrosion behavior of two different aluminum alloys (AA2024-T3 and AA7475-T761) butt-welded by FSW. In order to preserve the properties of the passive layer, thus enhancing the galvanic effects, experiments were
performed using low corrosive medium (0.1 mol L−1Na
2SO4+0.001
mol L−1NaCl).
Materials and Methods
Materials.—The system investigated consisted of butt joints of AA2024 and AA7475 plates, welded by FSW. The assembly was provided by the company EMBRAER as 2.0 mm thick sheets. The ratio between the tool rotation (rpm) and travel (mm/min) speeds was
2.43. This value lies within the limits used by Jariyaboon et al.,171.39
to 6.4, in their investigation of the influence of welding parameters on the corrosion behavior of FSW AA2024-T3.
The chemical compositions of the two aluminum alloys were
de-termined from samples with approximately 16 mm2 by X-ray
flu-orescence spectroscopy (Rigaku RIX 3000 spectrophotometer) and
are presented in TableI. They mainly differ in their Cu, Zn and Mn
contents.
All the electrochemical tests were performed in a 0.1 mol L−1
Na2SO4 + 0.001 mol L−1 NaCl solution with an exposed area of
4.8 cm2.
Microstructural characterizations.—Microstructural characteri-zations were performed by optical microscopy - OM (Leica DM LM) and by scanning electron microscopy - SEM (FEI Quanta 600). Sam-ples were ground with sandpaper (#600, #800, #1200, #4000), pol-ished with alumina down to 1 µm, thoroughly washed with ethanol, acetone and then dried in a hot-air stream. For OM analysis, the sam-ples were further etched in Keller’s reagent (10 mL HF + 15 mL
HCl + 25 mL HNO3+50 mL deionized water) at room temperature
during 30 s and successively washed in deionized water, ethanol and dried in a hot air stream prior to observations.
Electrochemical characterizations.—For the conventional elec-trochemical measurements, a three-electrode cell was used with an Ag/AgCl (3M KCl) reference electrode and a platinum sheet as
counter electrode. Measurements were performed with the two base metals and with samples comprising all the different zones formed dur-ing the FSW process. For these latter, the total sample area exposed
to the electrolyte corresponded to 4.8 cm2, comprising 1.5 cm2of the
nugget and the TMAZ of both alloys (area under the pin shoulder)
and the remainder of the sample equally divided (1.65 cm2) between
the AA2024 and AA7475 (HAZ + BM). The global electrochemical response of each sample was monitored as a function of immersion time (8 h) by electrochemical impedance spectroscopy (EIS) at the open circuit potential (OCP) using a Solartron 1287 potentiostat and a Solartron 1250 frequency response analyzer. The applied potential
sine-wave perturbation was 20 mVrms. The diagrams were obtained
from 63 kHz to 10 mHz with 9 points per frequency decade. Cathodic and anodic polarization curves were obtained separately after 2 h immersion in the electrolyte using different samples. The cathodic and the anodic scans were started 30 mV above or below
the OCP, respectively, at a scan rate of 0.166 mV s−1. All the global
electrochemical experiments were carried out in triplicate to evaluate reproducibility.
The experimental setup for the LEIS measurements consisted of a five-electrode system: the usual three electrodes, as described above, and a dual probe consisting of a sharp Ag tip (diameter of 200 µm) surrounded by an Ag ring, which act as two local potential sensors. This local potential is a direct measurement of the local current density through a conversion factor corresponding to the Ohm’s law for the
electrolyte,22,28which is in turn used for the local impedance
calcula-tion. The measurements were performed using a homemade potentio-stat and a four-channel frequency response analyzer (Solartron 1254) coupled to a high input impedance differential amplifier to amplify the potential-difference signals acquired with the probe. The local di-agrams were measured in the 63 kHz to 1 Hz frequency range (the low frequency was limited by the signal to noise ratio, but some exper-iments were also performed down to 10 mHz), using a perturbation
amplitude of 30 mVrms and with 7 points per frequency decade. A
detailed description of the LEIS system, as well as a scheme of the
ex-perimental setup, can be found elsewhere.23Fig.1shows the sketch of
probe positioning above the working electrode, which was controlled with a micrometric positioning system (UTM25, Newport) driven by a motion encoder (MM4005, Newport). The local impedance spectra were obtained at the OCP by scanning the probe from the AA2024 to the AA7475. Eleven diagrams corresponding to eleven different posi-tions were acquired for each run, which were performed in triplicate.
Figure 1. Schematic representation of the bi-electrode position above the welded sample for the LEIS measurements. Local impedance diagrams were obtained by scanning the probe from the AA2024 to the AA7475.
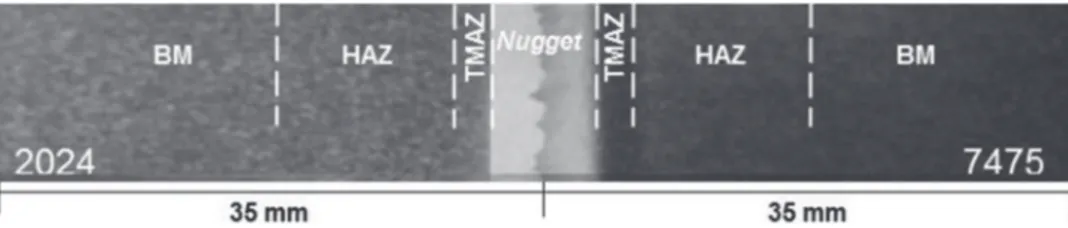
Figure 2. Optical macrograph of the AA2024 and AA7475 FSW sample showing the different zones formed during the welding, as determined by DSC and microstructure analysis.
Local pH variation test (agar-agar test).—A gel visualization technique was employed to detect the main anodic and cathodic ar-eas over and around the different regions formed during the FSW by means of pH variations due to corrosion activity. Other authors have
already used this test for FSW samples,17which offers an easy and
sensitive way to macroscopically identify the anodic and cathodic re-gions through color changes in an agar-agar solution, as a consequence of pH variations resulting from electrochemical reactions. The
solu-tion was prepared by mixing 3 g of agar-agar in 85 mL of 0.7 mol L−1
NaCl and 15 mL of universal pH indicator heated at 100◦C. For these
measurements, the solution was laid on the FSW sample, grounded with sandpaper (#600, #800, #1200, #4000), as a thin layer of about 1 to 2 mm in thickness and changes were monitored by taking pictures as a function of time during 8 h of exposure. Due to acidification, orange/yellow color develops in anodic areas, whereas the solution becomes green above the cathodic sites due to pH increase.
Differential scanning calorimetry.—Since the welding parame-ters used for FSW were not exactly known, DSC analysis was used to estimate the microstructural changes at the different zones that could be originated due to the welding process. This technique has been previously used for establishing the relationship between
microstruc-ture and corrosion sensitivity of a FSW AA2024-T3 sample.16 To
estimate the effect of temperature on the precipitation state of the two base alloys, DSC analysis was performed using an 822 Mettler-Toledo equipment, under pure nitrogen atmosphere (99.999%) in the
temper-ature range from 50◦C to 550◦C with a heating rate of 10◦C / min. This
technique is widely used for evaluating the effects of heat treatments
on the precipitation state of high strength aluminum alloys.29–32In the
present investigation, the data were used to estimate the extension of the HAZ.
Results
Surface and microstructure characterization of the aluminum alloys welded by FSW.—Fig.2shows a macrograph of the whole sample with the weld zones at the center and the two base metals on the left and right hand sides. The nugget can be readily identified by its lighter gray color and the image shows that the stirring action of the
tool probe does not provoke an extensive mixing of the two alloys.18
However, the TMAZ and the HAZ could not be easily distinguished
from each other or from the non-affected BM. Therefore, in Fig.2,
the dimensions of the two TMAZ domains were determined from the tool shoulder diameter visible in the unpolished sample, whereas the extension of the two HAZ was estimated from the analysis of the DSC thermograms corresponding to temperature gradients generated
during the FSW process.17,37
Fig.3ashows the DSC thermogram of the AA2024. Exothermic
(upward) and endothermic (downward) peaks are clearly visible, in-dicating phase precipitation and dissolution, respectively. This curve
is very similar to that obtained for a naturally aged AA202429and for
a stretched Al-Cu-Mg alloy with reduced alloying content.30The first
endothermic peak A, at about 160◦C, is associated with the dissolution
of the GPB (Guinier-Preston-Bagaryatsky) zones. The shoulder B, at
about 220◦C, is ascribed to the dissolution of the S′′phase (GPB2), the
single exothermic peak C, slightly above 250◦
C, is attributed to the
precipitation of S′
(S) phase. The large endothermic shoulder D, above
450◦
C, is due to S′
(S) dissolution, and, finally, the sharp endothermic
peak slightly above 550◦
C (E) is ascribed to the dissolution of the
eu-tectic precipitate and S phase.29The peak assignments are similar to
those reported for different Al-Cu-Mg alloys31–33allowing to limit the
HAZ to zones where the temperature is greater than 250◦ ◦C. Below
this temperature only GPB and S′′dissolution takes place. They can
reprecipitate during natural ageing, partially recovering the
precipita-tion state of the alloy.29,30
Similarly, Fig.3b shows the DSC thermogram of the AA7475.
The first endothermic peak (A - at about 220◦C) is associated with the
dissolution of the GP (Guinier-Preston) zones, the single exothermic
peak (B - at about 280◦C) is ascribed to the combined precipitation of
η′and η phases.34,35This latter peak is followed by a small exothermic
shoulder, at about 300◦C (B′), corresponding to the growth of η phase.
Finally, the second large endothermic peak (C - slightly above 400◦C)
is attributed to the dissolution of η′
and η phases. Thus, the HAZ was
defined as the region where the temperatures were higher than 250◦
C, consistent with the same temperature limit observed by Mahoney
et al.36for the FSW AA7075-T651.
100 200 300 400 500 -20 -15 -10 -5 0 5 10 S" phase - GPB2 (B) (a) S dissolution(E) S'(S) dissolution(D) S'(S) precipitation(C) GPB dissolution(A) Temperature / °C E x o th e rmi c E n d o th e rm ic H e a t F lo w / m W /g 100 200 300 400 500 -2.5 -2.0 -1.5 -1.0 -0.5 0.0 0.5 1.0 H e a t F lo w / m W /g Temperature / °C η' andηprecipitation (B) growth ofη(B') η' andηdissolution (C) GP dissolution (A) E n d o th e rm ic E x o th e rm ic (b)
Figure 3. Differential scanning calorimetry curves of: (a) AA2024 and (b) AA7475.
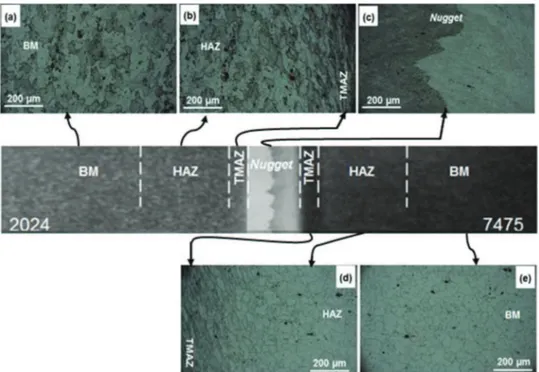
Figure 4. Optical micrographs of the different zones of the FSW sample: (a) BM-AA2024; (b) HAZ and TMAZ-AA2024; (c) nugget; (d) TMAZ and HAZ-AA7475; (e) BM-AA7475.
Several authors have used thermocouples to measure the tempera-tures of Al sheets during the FSW process. For welding performed at a rotation speed/travel speed ratio between 1.39 and 6.24, thus com-prising the conditions employed in the present investigation (2.43),
Jaryiaboon et al.17showed that the peak temperature at 16 mm from the
weld centerline varied between 250◦C and 320◦C. Experimental and
simulated thermal profiles, presented by Frigaard et al.,37showed that
the temperature reached at 16 mm from the weld centerline was 225◦C,
allowing an estimation of the limit of the HAZ at 16 mm from the
weld center, as shown in Fig.2. Within this limit, the microstructural
changes due to the thermal cycles may affect the corrosion behav-ior of the alloy due to irreversible dissolution/coarsening of phases. Therefore, any result representing the BM behavior was acquired with samples collected beyond this limit.
Fig.4shows optical micrographs of the two BMs and of the
differ-ent welded zones after Keller’s reagdiffer-ent attack. The grains structures
of the two unaffected areas of the alloys (Figs.4aand4e) are similar
and show irregular shapes of various sizes. For both alloys, grains in
the HAZ close to the TMAZ (left side of Fig.4bfor AA2024 and right
side of Fig.4dfor AA7475) present similar structures corresponding
to their respective BM, indicating that the thermal cycle in this region
does not provoke any grain transformation.11Conversely, the grains
in the TMAZ of both alloys (right side of Fig.4b for the AA2024
and left side of Fig.4dfor the AA7475) are elongated and distorted
due to the plastic deformation resulting from the shear stress of the tool shoulder against the alloys surface and the high temperatures reached in these regions. Finally, the grains in the nugget zone (Fig.
4c) were not adequately revealed due to their tiny sizes caused by
fine recrystallization with typical dimensions between 2 and 5 µm,38
even though some authors claim that dynamic recrystallization may
occur in this zone.39Additionally, there is a broad interface between
the two materials (Fig.4c), typical of FSW of dissimilar alloys,18,26
confirming that they are hardly mixed.
Fig. 5shows SEM images of the intermetallic particles (IMPs)
distribution in the two materials and in the different welded zones. These IMPs do not participate in the hardening of the alloy but they play a key role in the susceptibility to localized corrosion, as they have different electrochemical activities in relation to their respective
matrices.40–42The two main types of IMPs in the AA2024 were the S
phase (Al2CuMg) and the Al-Cu-Fe-Mn. It is well established that at
the beginning of the corrosion process, the formers behave as anodes with respect to the AA2024 matrix, but due to impoverishment in Al
and Mg, they become cathodic,40 whereas the latter behave
perma-nently as cathodes,43but are less susceptible to local corrosion due to
their better stability.44For the AA7475, the only relevant IMPs
iden-tified were the Al-Cu-Fe type, which behave as cathodes with respect
to the alloy matrix.45
The micrographs of Fig.5clearly show that the IMPs density in
the BM of the AA2024 (Fig.5a) is much higher than in the AA7475
(Fig.5e), which can be a relevant issue for the individual corrosion
resistance of the two alloys. In addition, as shown in Figs.5b and
5d, several IMPs in the TMAZ regions are fragmented46due to the
shear stress induced by the shoulder rotation on the alloys surface and oriented like comets following the tool rotation direction. Finally,
in the nugget region (Fig.5c), the IMPs have clearly smaller sizes
than in the other domains due to the mechanical action of the tool. Micrographs of the two HAZ are not presented as they show similar features as their respective BM.
pH variation above the welded system during the corrosion process.—Fig.6shows the pH variation for the welded system
im-mersed in a 0.7 mol L−1 NaCl solution containing agar-agar and a
universal pH indicator. In neutral aerated solution, the main cathodic process is the oxygen reduction reaction
O2+2H2O + 4e−→4OH−aq [1]
Whereas, the anodic reaction is the aluminum oxidation
Als → Al3+aq +3e
−
[2] expressed as a global 3-electron exchange, followed by cation hydrolysis
Al3+
aq + H2O → AlOH2+aq +H
+
aq [3]
As corrosion proceeds, cathodic areas become green due to pH increase, whereas an orange color develops above the anodic regions due to acidification resulting from the hydrolysis reaction. The im-ages show that the anodic activity is mostly concentrated at the weld centerline and that the anodic region at this zone becomes wider as
Figure 5. SEM micrographs of the two base alloys: (a) AA2024, (e) AA7475 and of the weld affected zones: (b) TMAZ-AA2024, (c) nugget and (d) AA7475-TMAZ. TMAZ represents the thermomechanically affected zone. The heat affected zones (HAZ) are not shown as they show similar microstructure their respective matrices.
the test proceeds, spreading more intensely to the AA7475 side of the weld.
Electrochemical results.—OCP and polarization curves.—Fig.7 shows the OCP variation with time for AA2024 and AA7475 samples
as well as for the sample with the FSW part (exposed area of 4.8 cm2
comprising the whole weld zone (nugget + TMAZ + HAZ = 3.2
cm2) and 0.8 cm2of each unaffected alloy) during immersion in a 0.1
M Na2SO4 + 0.001 M NaCl solution. Three sets of measurements
are presented for each condition and good reproducibility is observed. The results show that, for the three samples, OCP is stable after 2 h of immersion, with values around −0.6 V/Ag/AgCl, −0.45 V/Ag/AgCl and −0.2 V/Ag/AgCl for the AA7475, FSW and AA2024 samples, respectively. FSW sample was at an intermediate value confirming that the AA7475 and AA2024 are anodically and cathodically polarized, respectively.
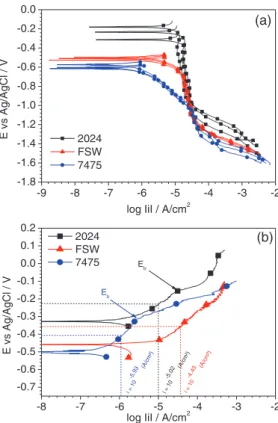
The cathodic and anodic polarization curves obtained after 2 h
im-mersion at the OCP in the 0.1 mol L−1Na
2SO4+0.001 mol L−1NaCl
solution for AA2024, AA7475 and for the FSW sample are shown
in Figs.8aand8b, respectively. The results of the cathodic branches
are shown in triplicate to indicate their good reproducibility. For the
cathodic domain (Fig.8a), a diffusion control is observed, confirming
that oxygen reduction is the main reaction. On the other hand, the
anodic polarization curves (Fig.8b) show different characteristics for
each sample. The AA7475 presents a passive domain, with a
cur-rent density in the range of µA cm−2, and a breakdown potential (E
B)
around −0.3 V/Ag/AgCl. The AA2024 shows a pseudo-passive region characterized by a steady current density increase and a breakdown potential at about −0.1 V/Ag/AgCl, whereas for the FSW sample, higher current densities and an active behavior are observed. In this figure, the dashed lines are drawn for a potential corresponding to OCP + 100 mV to compare the current densities at a same
overpoten-tial. In Fig.8bit is shown that the anodic process is much more intense
for the FSW sample than for the two individual alloys. The anodic
current densities are about one and two orders of magnitude higher for the FSW sample than for the AA2024 and AA7475, respectively. The high anodic current densities measured for the FSW sample should be ascribed to the effect of the galvanic coupling, as discussed in the following.
Global impedance measurements.—The evolution of the EIS re-sponse with immersion time for the two BM and for the FSW sample
during 8 h of immersion is shown in Fig.9(Nyquist plots). Impedances
were higher and increased with immersion time for the AA7475 (Fig.
9b), whereas it decreased for the AA2024 (Fig.9a) and for the FSW
sample (Fig.9c). Kramers-Kronig transform test (not shown) applied
to experimental data of Fig.9indicated that some points dispersion
at low frequency can be caused by non-stationary phenomena. All the diagrams are composed by a depressed capacitive loop, which for aluminum alloys has been ascribed to a series connection of the ca-pacitance of the thin oxide layer present on the metal surface and the
double layer capacity in parallel with a charge transfer resistance.47–49
However, for the AA2024 after 8 h of immersion, a second- time con-stant appears which can be attributed to a diffusion process associated with the oxygen reduction reaction on the IMPs. For the FSW sample, the impedance is always one order of magnitude lower than for the two other samples.
Local electrochemical impedance measurements.—The reactivity was also studied using LEIS at different locations above the welded
sample (as indicated in Fig.1). Local impedance diagrams obtained
after 2 h, 6 h and 8 h of exposure to 0.1 M Na2SO4+0.001 M NaCl
solution are shown in Figs. 10–12 (Nyquist representation). Some
interesting aspects can be seen in the HF domains (expanded zones
in Figs.10–12). Note the presence of imaginary components of the
impedance in the HF region. Interestingly, for short immersion times, these contributions depend on the location of the probe above the
Figure 6. pH variation test for the FSW sample in a 0.7 mol L−1NaCl solution
containing agar-agar and universal pH indicator. (Color on line).
artifact. In a series of papers, Huang et al.50–52 demonstrated that
the EIS response of a system could exhibit a complex behavior for the ohmic component in the HF region due to the geometry of the embedded electrode, which results in constrained current and potential distributions on the electrode edge, in agreement with the former work
of Newman.53Moreover, this type of HF response in LEIS experiment
has been observed by Lillard et al.22 but without any explanation
of its origin. More recently, the investigations performed on model
electrodes (Al/Cu and Al/Mg54) for studying the galvanic coupling by
LEIS showed that the interface formed by the two different materials induces a non-uniform distribution of current and potential on the
0 1 2 3 4 5 6 7 8 -0.8 -0.7 -0.6 -0.5 -0.4 -0.3 -0.2 -0.1 7475 FSW 2024 E v s A g /A g C l / V Time / h
Figure 7. Open circuit potential (OCP) for AA2024, AA7475 and for the FSW sample during 8 h of immersion in a 0.1 M Na2SO4+0.001 M NaCl solution. For each material, results of three independent measurements are shown in the figure.
-9 -8 -7 -6 -5 -4 -3 -2 -1.8 -1.6 -1.4 -1.2 -1.0 -0.8 -0.6 -0.4 -0.2 0.0 (a) 2024 FSW 7475 E v s A g /A g C l / V
log IiI / A/cm2
-8 -7 -6 -5 -4 -3 -2 -0.7 -0.6 -0.5 -0.4 -0.3 -0.2 -0.1 0.0 0.1 0.2 (b) Eb 2024 FSW 7475 E v s A g /A g C l / V
log IiI / A/cm2 i = 10 -4.4 3 (A/cm ²) Eb i = 1 0 -5.9 3 (A /cm ²) i = 1 0 -5.0 2 (A /cm ²)
Figure 8. (a) Cathodic and (b) anodic polarization curves for AA2024, AA7475 and FSW sample after 2 h of immersion in a 0.1 M Na2SO4 + 0.001 M NaCl solution. For an easier comparison of reaction rates, current densities are shown for the E = EOCP+100 mV in (b).
0 10 20 30 40 50 60 0 10 20 30 175 mHz 2h 6h 8h -Z'' / k Ω c m 2 Z' / kΩ cm2 10 mHz (a) 0 40 80 120 160 200 0 20 40 60 80 100 10 mHz -Z' ' / k Ω cm 2 Z' / kΩ cm2 175 mHz (b) 2h 6h 8h 0 1 2 3 4 5 6 7 8 0 1 2 3 4 1.75 Hz 2h 6h 8h -Z '' / k Ω c m 2 Z' / kΩ cm2 10 mHz (c)
Figure 9. Impedance diagrams obtained at the OCP after different immersion times indicated on the figure in a 0.1 mol L−1Na
2SO4+0.001 mol L−1NaCl
0
1
2
3
4
5
0
1
2
3
4
5
2024 (5) - (-0.589 Ag/AgCl / V) 2024 (4) - (-0.590 Ag/AgCl / V) 2024 (3) - (-0.589 Ag/AgCl / V) 2024 (2) - (-0.589 Ag/AgCl / V) 2024 (1) - (-0.589 Ag/AgCl / V) FSW (0) - (-0.589 Ag/AgCl / V) 7475 (1) - (-0.589 Ag/AgCl / V) 7475 (2) - (-0.589 Ag/AgCl / V) 7475 (3) - (-0.578 Ag/AgCl / V) 7475 (4) - (-0.578 Ag/AgCl / V) 7475 (5) - (-0.578 Ag/AgCl / V)-z
''
/
k
Ω
c
m
²
z' / k
Ω
cm²
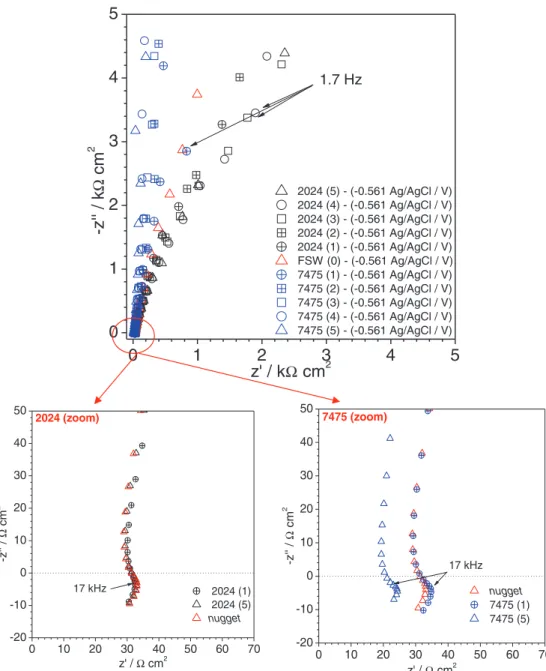
1.7 Hz 0 10 20 30 40 50 60 70 -20 -10 0 10 20 30 40 50 2024 (zoom) 2024 (1) 2024 (5) nugget 17 kHz -z '' / Ω c m ² z' / Ω cm² 17 kHz 0 10 20 30 40 50 60 70 -20 -10 0 10 20 30 40 50 nugget 7475 (1) 7475 (5) 7475 (zoom) 17 kHz 17 kHz -z '' / Ω c m ² z' / Ω cm²Figure 10. Local impedance (LEIS) diagrams obtained at various locations along a line starting from the AA2024 passing through the HAZ, the TMAZ, the nugget and the AA7475 after 2 h of immersion in a 0.1 M Na2SO4+0.001 M NaCl solution.
surface of each of the coupled electrodes. From experiments and nu-merical simulations, the authors demonstrated the importance of both contributions, the normal and the radial, to the local current
den-sity for an axis symmetric system.54,55 It should also be mentioned
that this behavior originates because the two different alloys contact each other, which, from a mathematical point of view corresponds to two different boundary conditions on the alloys. It was shown that the non-uniform current and potential distributions are respon-sible for the HF inductive behavior observed on the LEIS response and are sensitive to the position of the probe with respect to the
in-terface forming the galvanic coupling.54,55 The inductive loops are
clearly visible after 2 h of immersion and when the probe is placed
close to the welded interface (Fig.10), that is, as the bi-electrode
ap-proaches the interface between the dissimilar aluminum alloys. The inductive loops observed at HF tend to disappear at longer exposure
times (6 h and 8 h – Figs.11–12). This result can be explained by
a decrease of the galvanic coupling effect with increasing immersion time.
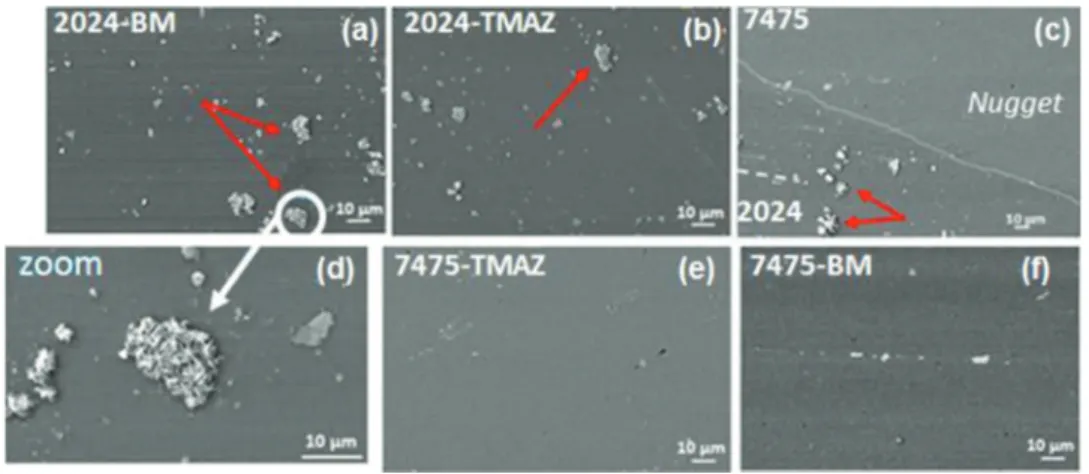
SEM-EDS analysis.—Fig.13shows SEM micrographs of a FSW
sample after 24 h immersion in the 0.1 M Na2SO4+0.001 M NaCl
solution. The three top images of the picture (a), (b) and (c) and the zoomed region (d) of picture (a) show the formation of a deposit above the IMPs on the AA2024 side of the weld, whereas, no corrosion
product was formed on the AA7475 (Figs. 13e and13f). Table II
reports the results of semi-quantitative EDS analysis performed above IMPs of the AA2024 located at the BM/HAZ, TMAZ and in the nugget. The EDS results show the presence of Zn, whose content decreases with the distance from the welded interface. However, Zn is only present in solid solution of the AA7475 and was not found in the IMPs, either of the AA7475 or the AA2024; it is thus proposed that when the two alloys are coupled by the welding, the cathodic polarization of the AA2024 enhances the oxygen reduction reaction above the IMPs. This reaction is then counterbalanced by the selective dissolution of Zn from the solid solution of the AA7475 which is anodically polarized. Chemical composition of the corrosion products formed during 24 h in the electrolyte on some of the IMPs of the
0
1
2
3
4
5
0
1
2
3
4
5
1.7 Hz 2024 (5) - (-0.561 Ag/AgCl / V) 2024 (4) - (-0.561 Ag/AgCl / V) 2024 (3) - (-0.561 Ag/AgCl / V) 2024 (2) - (-0.561 Ag/AgCl / V) 2024 (1) - (-0.561 Ag/AgCl / V) FSW (0) - (-0.561 Ag/AgCl / V) 7475 (1) - (-0.561 Ag/AgCl / V) 7475 (2) - (-0.561 Ag/AgCl / V) 7475 (3) - (-0.561 Ag/AgCl / V) 7475 (4) - (-0.561 Ag/AgCl / V) 7475 (5) - (-0.561 Ag/AgCl / V)-z
''
/
k
Ω
c
m
2z' / k
Ω
cm
2 0 10 20 30 40 50 60 70 -20 -10 0 10 20 30 40 50 2024 (1) 2024 (5) nugget -z '' / Ω c m 2 z' / Ω cm2 2024 (zoom) 17 kHz 0 10 20 30 40 50 60 70 -20 -10 0 10 20 30 40 50 17 kHz nugget 7475 (1) 7475 (5) -z '' / Ω c m 2 z' / Ω cm2 7475 (zoom)Figure 11. Same as Fig.10after 6 h of immersion in a 0.1 M Na2SO4+0.001 M NaCl solution.
AA2024 are presented in TableII. It shows a preferential precipitation
of Zn products above the S phase (Al-Cu-Mg) in agreement with their higher tendency to sustain cathodic reaction (thus, the formation of hydroxide ions) when comparison is made with the reactivity of
Al-Cu-Fe-Mn-(Si) IMPs.40Moreover, the Mg content of these IMPs
remains high even after 24 h of immersion, which is in disagreement
with the fast dealloying process frequently reported in the literature.56
Such a behavior is to be ascribed to the cathodic polarization of the alloy which limits the Mg dissolution in the IMPs.
Discussion
The OCP measurements (Fig.7) performed in the 0.1 M Na2SO4+
0.001 M NaCl solution show that the AA7475 is anodically polarized when joined by FSW to the AA2024. However, the anodic polarization
curve for the AA7475 (Fig.8b) shows that it is passive at the OCP
of the FSW sample. Far from the weld centerline, even in a much more aggressive solution and after 8 h of immersion, the passive state of the AA7475 was maintained in the FSW sample, as shown
in the agar-agar test (Fig.6). Low local corrosion activity was also
verified after 24 h immersion in the sulfate and chloride containing
solution, as shown in Figs.13eand13f. Therefore, the active behavior
in the anodic polarization curve for the FSW sample must result only from the corrosion activity at the weld zone, which is mainly
concentrated in the AA7475 side of the weld, as shown in Fig.6.
These findings highlight that the microstructural changes resulting from the FSW process play a key role on the deterioration of the corrosion resistance of the weld zones deserving a more detailed characterization by means of techniques with high local resolution. On the other hand, the intensity of the cathodic process can be directly related to the amount of IMPs in the microstructure of each sample: AA2024 > FSW sample > AA7475.
In agreement with the anodic polarization curves (Fig.8b), the EIS
diagrams (Fig.9) show that the welding procedure greatly reduces
the corrosion resistance of the FSW sample. The highest impedance is observed for the AA7475, which shows a more defined passive behavior, whereas the steep anodic current density increase for the FSW sample explains its low impedance. In the EIS experiments, the increase in impedance of the AA7475 with immersion time is due to the low IMPs content of this alloy when compared to the
0
1
2
3
4
5
0
1
2
3
4
5
1.7 Hz 2024 (5) - (-0.540 Ag/AgCl / V) 2024 (4) - (-0.540 Ag/AgCl / V) 2024 (3) - (-0.540 Ag/AgCl / V) 2024 (2) - (-0.540 Ag/AgCl / V) 2024 (1) - (-0.540 Ag/AgCl / V) FSW (0) - (-0.540 Ag/AgCl / V) 7475 (1) - (-0.540 Ag/AgCl / V) 7475 (2) - (-0.540 Ag/AgCl / V) 7475 (3) - (-0.540 Ag/AgCl / V) 7475 (4) - (-0.540 Ag/AgCl / V) 7475 (5) - (-0.540 Ag/AgCl / V)-z
''
/
k
Ω
c
m
²
z' / k
Ω
cm²
0 10 20 30 40 50 60 70 -20 -10 0 10 20 30 40 50 2024 (1) 2024 (5) nugget -z '' / Ω c m ² z' / Ω cm² 17 kHz 2024 (zoom) 0 10 20 30 40 50 60 70 -20 -10 0 10 20 30 40 50 nugget 7475 (1) 7475 (5) 17 kHz -z '' / Ω c m ² z' / Ω cm² 7475 (zoom)Figure 12. Same as Fig.10and Fig.11after 8 h of immersion in a 0.1 M Na2SO4+0.001 M NaCl solution.
Figure 13. SEM micrographs of the various tested areas of the FSW sample after 24 h immersion in 0.1 M Na2SO4+0.001 M NaCl solution: (a) 2024-BM, (b) 2024-TMAZ (c) nugget zone, (d) zoom of a region of (a), (e) 7475-TMAZ, (f) 7475-BM.
Figure 14. Schematic description of the corrosion behavior of the welded Al alloys due to the galvanic coupling between AA2024 and AA7475: AA2024 is the cathode and AA7475 is the anode. (a) Initial state, (b) partial dissolution of Mg from the intermetallic particles in the AA2024 due to its high reactivity. AA7075 is anodically polarized in the passive state with the dissolution of zinc from the matrix (c) cathodic reaction mainly occurs on the IMPs of the AA2024. The local pH increase leads to a corrosion attacks around the IMPs and (d) in parallel the formation of a deposit of Zn hydroxides on the IMPs of the AA2024 is observed due to high pH value, slowing down the galvanic activity.
AA2024 (Figs.5aand5e). On the other hand, the lower impedance of
the AA2024 and its decrease with immersion time can be explained by the progressive activation of IMPs found in its microstructure, as
largely discussed in the literature,56,57and by the progressive activation
of cathodic IMPs.58The galvanic coupling between the two alloys,
with large OCP differences (Fig. 7), as well as the microstructure
modifications induced by the welding process, leading to development of in-depth localized corrosion at the TMAZ/HAZ junction at the AA7475 side of the weld, are the main reasons for the lower EIS behavior of the FSW sample when compared to the two alloys.
LEIS diagrams after 2 h of exposure to the 0.1 M Na2SO4 +
0.001 M NaCl solution showed inductive loops in HF range (Fig.
10). Their shape and size are dependent on probe location. In
accor-dance with previous works on model galvanic systems, these loops arise from the galvanic coupling between the dissimilar aluminum alloys and are more pronounced above the AA2024 where a normal
current distribution occurs.54,55After 6 h and 8 h of exposure (Figs.
11,12), the HF inductive loops are reduced in size which can be
partly explained by the deposition of zinc on the IMPs of the AA2024
and thus, to a change of the galvanic coupling effect (Fig. 13and
TableII).
A schematic description of the corrosion behavior of the welded Al alloys due to the galvanic coupling between AA2024 and AA7475
is shown in Fig.14. Initially, Fig.14b, partial dissolution of Mg from
the intermetallic particles in the AA2024 due to its high reactivity occurs and selective dissolution of Zn from the AA7475, which is
anodically polarized. Then, Fig.14c, the formation of a Zn hydroxide
can be explained by the diffusion/migration of Zn2+ ions generated
from the anodic dissolution of AA7475 toward the cathodic regions on AA2024. Their precipitation occurs mainly on the Al-Cu-Mg IMPs due to a local pH increase associated to the oxygen reduction reaction. Simultaneously, the Mg from the IMPs partially oxidizes depending on the distance between the nugget and the affected zone, but the IMPs particles remains active for the oxygen reduction reaction. When the
immersion time increases, Fig.14d, IMPs are progressively covered
by zinc hydroxides (TableII) leading to a significant slowdown of the
oxygen reduction reaction and the galvanic activity.
Table II. Chemical composition of the corrosion products formed on the IMPs of the AA2024 after 24 h of immersion in 0.1 M Na2SO4
+0.001 M NaCl solution. O Mg Al S Cl Mn Fe Cu Zn 2024-BM 12.3 8.6 34.9 0.5 0.8 0.3 0.3 38.5 3.4 2024-TMAZ 14 4.7 47.1 - 2 0.5 1 25.5 4.1 Nugget (2024) 21.2 0.3 50.4 1.9 2 0.5 0.4 2.7 20.2 Conclusions
The corrosion behavior of two dissimilar aluminum alloys, 7475 and 2024, butt-welded by FSW was investigated by global and local electrochemical techniques and SEM analysis prior and after exposure
to 0.1 M Na2SO4+0.001 M NaCl solution. Corrosion of the system
results from the establishment of a galvanic coupling at which the AA7475 behaves anodically with respect to the AA2024. The results of the anodic polarization curves and of the global EIS diagrams showed much lower corrosion resistance for the FSW affected zones comparatively to the two aluminum alloys tested individually. Local pH measurement allowed demonstrating the location of the enhanced reactivity for the welded system. The OCP measurement of the FSW sample confirms the galvanic coupling when the alloys are welded. LEIS provided a proof of the galvanic coupling through the presence of inductive behaviors in the high frequency range, particularly when the probe was placed near the weld joint and for short immersion time. Interestingly, the HF inductive loops, ascribed to the local current and potential distribution, are an indirect picture of the galvanic coupling. The modification of the galvanic coupling effect as a function of time was explained by the blocking of the IMPs on AA2024 due to the formation of Zn hydroxide precipitates. A general description of the different steps occurring from the early stage of the galvanic coupling was proposed to describe the corrosion of the two different aluminum alloys (AA2024-T3 and AA7475-T761) butt-welded by FSW.
Acknowledgments
Acknowledgments are due to CAPES (Capes/Cofecub N◦
806-14) and FAPESP (Proc. 2013/13235-6) for financial support to this research.
References
1. R. J. Rioja and J. Liu, “The evolution of Al-Li base products for aerospace and space applications,” Metallurgical and Materials Transactions A, 43, 3325 (2012).
2.https://www.theguardian.com/business/2006/feb/23/theairlineindustry.travelnews, access 11/12/2016.
3. http://www.aeronewstv.com/en/lifestyle/in-your-opinion/2782-a-boeing-747-8-has-how-many-rivets.html, access 11/13/2016.
4. D. Dittrich, J. Standfuss, J. Liebscher, B. Brenner, and E. Beyer, “Laser beam welding of hard to weld Al alloys for a regional aircraft fuselage design–First results,”Physics Procedia, 12, 113 (2011).
5. A. F. Norman and P. B. Prangnell, Proc. 6th Int. Conf. on ‘Aluminum Alloys’, 1501, 1998, Tokyo, Japan Inst. Light Metals.
6. A. F. Norman, V. Drazhner, and P. B. Prangnell, “Effect of welding parameters on nugget zone microstructure and properties in high strength aluminum alloy friction stir welds,”Material Science Engineering A, A239, 53 (1999).
7. A. K. Lakshminarayanan, V. Balasubramanian, and K. Elangovan, “Effect of welding processes on tensile properties of AA6061 aluminum alloy joints,”The International Journal of Advanced Manufacturing Technology, 40, 286 (2009).
8.www.twi.co.uk, access 20/08/2016.
9. C. Patil, H. Patil, and H. Patil, “Experimental investigation of hardness of FSW and TIG joints of Aluminum alloys of AA7075 and AA6061,” Frattura ed Integrit`a
Strutturale, 37, 325 (2016).
10. M. Ericsson and R. Sandstrom, “Influence of welding speed on the fatigue of friction stir welds, and comparison with MIG and TIG,”International Journal of Fatigue, 25, 1379 (2003).
11. P. L. Threadgill, A. J. Leonard, H. R. Shercliff, and P. J. Withers, “Friction stir weld-ing of aluminum alloys,”International Materials Reviews, 54, 49 (2009). 12. J. Lumsdem, M. Mahoney, C. Rhodes, and G. Pollock, “Corrosion Behavior of
Friction-Stir-Welded AA7050-T7651,”Corrosion Science, 59, 212 (2003). 13. D. A. Wadeson, “Corrosion behavior of friction-stir-welded AA7050-T7651,”
Cor-rosion Science, 48, 887 (2006).
14. C. S. Paglia and R. G. Buchheit, “The time-temperature-corrosion susceptibility in a 7050-T7451 friction stir weld,”Materials Science Engineering A, 492, 250 (2008).
15. J. Kang, R. D. Fu, G. H. Luan, C. L. Dong, and M. He, “In situ investigation on the pitting corrosion behavior of friction stir welded joint of 2024-T3 aluminum alloy,”
Corrosion Science, 52, 620 (2010).
16. A. Bousquet, A. Poulon-Quintin, M. Puiggali, O. Devos, and M. Touzet, “Relation-ship between microstructure, microhardness and corrosion sensitivity of an 2024-T3 friction stir welded joint,”Corrosion Science, 53, 3026 (2011).
17. M. Jariyaboon, A. Davenport, R. Ambat, B. Connolly, S. Williams, and D. Price, “The effect of welding parameters on the corrosion behavior of friction stir welded,”
Corrosion Science, 49, 877 (2007).
18. U. Donatus, G. E. Thompson, X. Zhou, J. Wang, A. Cassell, and K. Beamish, “Cor-rosion susceptibility of dissimilar friction stir welds of AA5083 and AA6082 alloys,”
Materials Characterization, 107, 85 (2015).
19. H. S. Patil and S. N. Soman, “Effect of weld parameter on mechanical and metallur-gical properties of dissimilar joints AA6082-AA6061 in T6 condition produced by FSW,” Frattura ed Integrit`a Strutturale, 24, 151 (2013).
20. J. C. B. Bertoncello, S. M. Manhabosco, and L. F. P. Dick, “Corrosion study of the friction stir lap joint of AA7050-T76511 on AA2024-T3 using the scanning vibrating electrode technique,”Corrosion Science, 94, 359 (2015).
21. V. Proton, J. Alexis, E. Andrieu, C. Blanc, J. Delfosse, L. Lacroix, and G. Odemer, “Influence of post-welding heat treatment on the corrosion behavior of a 2050-T3 Aluminum-Copper-Lithium alloy friction stir welding joint,”Journal of the Electro-chemical Society, 158, C139 (2011).
22. R. S. Lillard, P. J. Moran, and H. S. Isaacs, “A Novel method for generating quantita-tive local electrochemical impedance spectroscopy,”Journal of the Electrochemical Society, 139, 1007 (1992).
23. G. Galicia, N. P´eb`ere, B. Tribollet, and V. Vivier, “Local and global electrochem-ical impedances applied to the corrosion behavior of an AZ91 magnesium alloy,”
Corrosion Science, 51, 1789 (2009).
24. J. Jorcin, C. Blanc, N. P´eb`ere, B. Tribollet, and V. Vivier, “Galvanic coupling between pure copper and pure aluminum,”Journal of the Electrochemical Society, 155, C46 (2008).
25. L. Lacroix, C. Blanc, N. P´eb`ere, B. Tribollet, and V. Vivier, “Localized approach to galvanic coupling in an Aluminum-Magnesium system,”Journal of the Electro-chemical Society, 156, 259 (2009).
26. D. Sidane, E. Bousquet, O. Devos, M. Puiggali, M. Touzet, V. Vivier, and A. Poulon-Quintin, “Local electrochemical study of friction stir welded aluminum alloy assembly,”Journal of Eletroanalytical Chemistry, 737, 206 (2015). 27. P. Lima-Neto, J. P. Farias, L. F. G. Herculano, H. C. Miranda, W. S. Ara´ujo,
J. B. Jorcin, and N. P´eb`ere, “Determination of the sensitized zone extension in welded AISI 304 stainless steel using non-destructive electrochemical techniques,” Corro-sion Science, 50, 1149 (2008).
28. V. M-W. Huang, S. L. Wu, M. E. Orazem, N. P´eb`ere, B. Tribollet, and V. Vivier, “Local eletrochemical impedance spectroscopy: A review and some recent develop-ments,” Electrochimica Acta, 56, 8048 (2011).
29. C. S. Chen, J. G. Yang, and A. H. Tan, “Study of welding peak temperatures on microstructures and hardness of heat affected zone in 2024-T3 aluminum alloy,”
Materials Science and Technology, 25, 896 (2009).
30. N. Gao, L. Davin, S. Wang, A. Cerezo, and M. J. Starink, “Precipitation in stretched Al-Cu-Mg alloys with reduced alloying content studied by DSC, TEM and atom probe,”Materials Science Forum, 396, 923 (2002).
31. T. S. Parel, S. C. Wang, and M. J. Starink, “Hardening of an Al–Cu–Mg alloy con-taining Types I and II S phase precipitates,”Materials and Design, 31, S2 (2010). 32. C. Genevois, A. Deschamps, A. Denquin, and B. Doisneau, “Quantitative
investiga-tion of precipitainvestiga-tion and mechanical behavior for AA2024 fricinvestiga-tion stir welds,”Acta Materialia, 53, 2447 (2005).
33. A. Charai, T. Walther, C. ALlfonso, A. M. Zahra, and C. Y. Zahra, “Coexistence of clusters, GPB zones, S′′
-, S′
- and S-phases in an Al–0.9% Cu–1.4% Mg alloy,”Acta materialia, 48, 2751 (2000).
34. I. A. Macaskill, A. D. P. Ladelpha, J. H. Milligan, J. Fulton, and D. P. Bishop, “Effects of hot and cold deformation on the mechanical performance of Alumix 431D,”
Powder Metall, 52, 304 (2009).
35. P. N. Adler and R. Delasi, “Calorimetric studies of 7000 series aluminum alloys: II. Comparison of 7075, 7050 and RX720 alloys,” Metallurgical and Materials
Transactions A, 8, 1177 (1977).
36. M. W. Mahoney, C. G. Rhodes, J. G. Flintoff, W. H. Bingel, and R. A. Spurling, “Properties of friction-stir-welded 7075 T651 aluminum,”Metallurgical and Mate-rials Transactions A, 29, 1955 (1998).
37. O. Frigaard, O. Grong, and O. T. Midling, “A process model for friction stir welding of age hardening aluminum alloys,”Metallurgical and Materials Transactions A, 32, 1189 (2001).
38. Y. S. Sato, H. Kokawa, M. Enomoto, and S. Jogan, “Microstructural evolution of 6063 aluminum during friction-stir welding,”Metallurgial and Materials Transactions A, 30, 2429 (1999).
39. K. V. Jata and S. L. Semiatin, “Continuous dynamic recrystallization during fric-tion stir welding of high strength aluminum alloys,”Scripta Materialia, 43, 743 (2000).
40. R. G. Buchheit, R. P. Grant, P. F. Hlava, B. Mckenzie, and G. L. Zender, “Local dissolution phenomena associated with S Phase (Al2CuMg) particles in Aluminum
alloy 2024-T3,”Journal of the electrochemical society, 144, 2621 (1997). 41. R. G. Buchheit, “A compilation of corrosion potentials reported for intermetallic
phases in aluminum alloys,”Journal of the Electrochemical Society, 142, 3994 (1995).
42. R. G. Buchheit, M. A. Martinez, and L. P. Montes, “Evidence for Cu ion formation by dissolution and dealloying the Al2CuMg intermetallic compound in rotating ring-disk
collection experiments,”Journal of the Electrochemical Society, 147, 119 (2000). 43. W. Zhang and G. S. Frankel, “Transitions between pitting and intergranular corrosion
in 2024,”Electrochimica Acta, 48, 1193 (2003).
44. A. Boag, R. J. Taylor, T. H. Muster, N. Goodman, D. McCulloch, C. Ryan, B. Rout, D. Jamieson, and A. E. Hughes, “Stable pit formation on AA2024-T3 in a NaCl environment,”Corrosion Science, 52, 90 (2010).
45. J. H. W. de Witt, “Local potential measurements with the SKPFM on aluminum alloys,”Electrochimica Acta, 49, 2841 (2004).
46. E. H. Hollingsworth and H. Y. Hunsicker, Corrosion of aluminum and aluminum
alloys, Handbook asm, 583 (1990).
47. F. M. Queiroz, M. Magnani, I. Costa, and H. G. de Melo, “Investigation of the corro-sion behavior of AA2024-T3 in low concentrated chloride media,”Corrosion Science, 50, 2646 (2008).
48. J. H. W. de Wit and H. J. W. Lenderink, “Electrochemical impedance spectroscopy as a tool to obtain mechanistic information on the passive behavior of aluminum,”
Electrochimica Acta, 41, 1111 (1996).
49. I. V. Aoki, M. -C. Bernard, S. I. Cordoba de Torresi, C. Deslouis, H. G. de Melo, S. Joiret, and B. Tribollet, “Ac-impedance and Raman spectroscopy study of the electrochemical behavior of pure aluminum in citric acid media,”Electrochimica Acta, 46, 1871 (2001).
50. V. M.-W. Huang, V. Vivier, S. L. Wu, M. E. Orazem, N. P´eb`ere, and B. Tribollet, “The apparent constant-phase-element behavior of a disk electrode with faradaic reactions–A global and local impedance analysis,”Journal of The Electrochemical Society, 154, C99 (2007).
51. V. M.-W. Huang, V. Vivier, M. E. Orazem, N. P´eb`ere, and B. Tribollet, “The apparent constant-phase-element behavior of an ideally polarized blocking electrode–A global and local impedance analysis,”Journal of the Electrochemical Society, 154, C81 (2007).
52. V. M.-W. Huang, V. Vivier, I. Frateur, M. E. Orazem, and B. Tribollet, “The global and local impedance response of a blocking disk electrode with local constant-phase-element behavior,”Journal of the Electrochemical Society, 154, C89 (2007). 53. J. S. Newman, “Resistance for flow of current to a disk,”Journal of the
Electrochem-ical Society, 113, 501 (1966).
54. C. Blanc, M. E. Orazem, N. P´eb`ere, B. Tribollet, V. Vivier, and S. Wu, “The origin of the complex character of the ohmic impedance,”Electrochimica Acta, 55, 6313 (2010).
55. J. V. Ferrari, H. G. De Melo, M. Keddam, M. E. Orazem, N. P´eb`ere, B. Tribollet, and V. Vivier, “Influence of normal and radial contributions of local current density on local electrochemical impedance spectrocopy,”Electrochimica Acta, 60, 244 (2012).
56. N. Birbilis and R. G. Buchheit, “Electrochemical characteristics of intermetallic phases in aluminum alloys an experimental survey and discussion,”Journal of The Electrochemical Society, 152, B140 (2005).
57. A. E. Hughes, A. Boag, A. M. Glenn, D. McCulloch, T. H. Muster, C. Ryan, C. Luo, X. Zhou, and G. E. Thompson, “Corrosion of 2024-T3 Part II: Co-operative corro-sion,”Corrosion Science, 53, 27 (2011).
58. A. Boag, A. E. Hughes, A. M. Glenn, T. H. Muster, and D. McCulloch, “Corrosion of AA2024-T3 Part I: Localised corrosion of isolated IM particles,”Corrosion Science, 53, 17 (2011).