Any correspondence concerning this service should be sent to the repository administrator:
[email protected]
To link to this article : DOI: 10.1016/j.combustflame.2017.01.032
URL :
http://dx.doi.org/10.1016/j.combustflame.2017.01.032
This is an author-deposited version published in:
http://oatao.univ-toulouse.fr/
Eprints ID: 18396
O
pen
A
rchive
T
oulouse
A
rchive
O
uverte (
OATAO
)
OATAO is an open access repository that collects the work of Toulouse
researchers and makes it freely available over the web where possible.
To cite this version: Guiberti, Thibault and Durox, Daniel and Schuller,
Thierry Flame chemiluminescence from CO2- and N2-diluted laminar
CH4 /air premixed flames. (2017) Combustion and Flame, vol. 181. pp.
Flame
chemiluminescence
from
CO
2
-
and
N
2
-diluted
laminar
CH
4
/air
premixed
flames
T.F.
Guiberti
a,b,∗,
D.
Durox
a,
T.
Schuller
a,ca Laboratoire EM2C, CNRS, CentraleSupélec, Université Paris Saclay, Grande Voie des Vignes, 92290 Châtenay-Malabry, France
b King Abdullah University of Science and Technology (KAUST), Clean Combustion Research Center (CCRC), Thuwal, 23955-6900, Saudi Arabia c Institut de Mécanique des Fluides de Toulouse (IMFT), Université de Toulouse, CNRS, INPT, UPS, Toulouse, France
Keywords: Chemiluminescence Biogas Laminar flames Premixed flames
a
b
s
t
r
a
c
t
AnexperimentalandnumericalinvestigationofthechemiluminescencesignalsfromOH∗,CH∗,andCO 2∗
isconductedforlaminarpremixedconicalCH4/airflamesdilutedwithCO2 orN2.Experimentsare
con-ductedeitheratfixedequivalenceratioorfixedadiabaticflametemperature.AnICCDcamera,equipped withdifferentnarrowbandpassfilters,isusedtorecordflameimagesat307nm(OH∗),430nm(CH∗),
and455nm (CO2∗). AspectrometerisalsousedtocorrecttheOH∗and CH∗emissionsfromtheCO2∗
broadbandbackgroundemission.Measuredchemiluminescenceintensitiesarethencomparedtoone di-mensionalfreely-propagating-flamedirectsimulationsaccountingforthechemistryoftheexcited radi-cals.Simulationspredictaccuratelythe OH∗ chemiluminescenceintensity,independentlyofthediluent
natureandconcentration.CorrectionfortheCO2∗backgroundhasaweakinfluenceontherecordedOH∗
signal.PredictionsofCH∗emissionsarealsoingoodagreementwithexperimentaldataiftheCO 2∗
back-groundintensityis subtracted fromintensitymeasurements.Measured and calculatedCO2∗ emissions
leadtoacceptable resultsusingasimplifiedchemistrymechanismforCO2∗ andanheuristicmodelfor
itsemissionintensity.Finally,itisshownthatCO2dilutionmodifieschemiluminescenceintensitycouples
andparticularlytheOH∗/CO
2∗intensityratio.TheseratiosregularlydecreasewithCO2 dilution,afeature
whichisreproducedbythesimulations.ItisthenshownthattheratioOH∗/CO
2∗iswellsuitedtoinfer
theCO2diluentconcentrationindilutedCH4/airflames,amethodwhichappearsnotfeasibleforsensing
N2inN2-dilutedCH4/airflames.
1. Introduction
In premixedhydrocarbonflames,the chemiluminescence from OH∗ and CH∗ excited radicals is generally intense. These emis-sions have thus been extensively used to infer propertiesof the reacting flow such as the heat release rate [1–9] or equivalence ratio [6,10–20], by examining the OH∗/CH∗ intensity ratio. How-ever, the OH∗ and CH∗ emission intensities need generally to be carefully corrected forthe broadband CO2∗ background emission to achieve accuratemeasurements [6–8,18–22].Additionally,most ofthedetailedchemistrymechanismscurrentlyusedinnumerical simulations donot account forexcited radicals chemistry dueto the additionalcomputationalcost associatedtothedescriptionof
∗ Corresponding author at: King Abdullah University of Science and Technology
(KAUST), Clean Combustion Research Center (CCRC), Thuwal, 23955-6900, Saudi Arabia.
E-mail addresses: [email protected] , [email protected]
(T.F. Guiberti).
theircomplexkinetics[12].Simulationswithsimplifiedchemistry mechanisms are however often used to interpret chemilumines-cence measurements with crude approximationson the relation-shipbetweennon-excitedspeciesconcentrationscalculatedbythe solverandtheexcitedradicalspeciesemissionintensitiesthatare measured. Thereis thus a gapbetweenexperiments and simula-tionswithonlyalimitednumberofvalidationsofthe approxima-tionsmade.
In this context, efforts are made to understand and model thecomplexchemistryoftheformationandconsumption ofOH∗ [24–28],CH∗[25–27,29–31],andCO
2∗[1,21,22,32] excitedradicals. Comparisons betweenmeasurements and simulations in laminar [11,16,33] andturbulent[18–20,34] flames show that thedetailed mechanisms developed for the chemistry of these excited radi-cals yield goodresults for lean andrich CH4/air flames. In a re-cent work, García-Armingol and Ballester [19] analyzed numeri-callyandexperimentally thechemiluminescence ofOH∗,CH∗,and CO2∗ inpremixedturbulentswirlingflames ofCH4/CO2/H2/CO/air blends. They emphasized the large differences in the emission
spectra fromtheseflames in comparisonto CH4/air flames.They conducted1-DFreely-Propagating-Flame(FPF)simulationsaswell as 0-D Perfectly-Stirred-Reactor (PSR) simulations to account for the changeofturbulentcombustion regimeandexamined effects of a large variety of mixtures and turbulent intensities. In this latter study, differences between measurements and simulations can beinterpreted byeitherimprecisions intheselecteddetailed chemistrymechanismsortheinadequacyofthemodelsused.
Anotherissue withturbulent flames is that the instantaneous flame surface area is generally not known. It is then difficult to compare, quantitatively, the measured chemiluminescence inten-sities to numerical results from 1-D FPF simulations, where the chemiluminescenceintensitiesarecomputedperunitofflame sur-facearea.Thisproblemcanhoweverbe circumventedby examin-ing chemiluminescence intensityratios betweendifferentcouples ofexcited radicals.Thismethodallowsremoving thecontribution oftheflamesurfacearea[11,14,16,18–20].Inthiscase,species con-centrationscannothoweverbecompareddirectly.
For all these reasons, we decided to examine experimentally andnumericallythechemiluminescenceofOH∗,CH∗,andCO
2∗ ex-cited radicals in lean diluted methane/airpremixedconical lami-nar flames, a configuration where the flame surface area is well defined.Withpropercare,conicallaminarflamesarereadily com-parabletoadiabatic1-DFPFdirectsimulations.NoriandSeitzman [35] studiedeffectsofpreheat temperature,pressure,and aerody-namic strain on the CH∗ chemiluminescence to sense the equiv-alence ratio of methane and Jet-A flames burning in air. In the present study, focus is made on effects of CO2 andN2 dilutions inCH4fuelblendsonthechemiluminescenceofpremixedflames. CO2 andN2 dilutedmethanefuelblends arerelevantfor com-bustion applicationspoweredbybiogases,whichareproduced by methanization [36]. Biogases are classified as low heat value fu-elsandaremainlycomposedofCH4,CO2,andN2 invariable pro-portions [37].There isagrowing interest fortheserenewable re-sources [38,39], which has led to applied research programs for adapting transport, heat, and power generation technologies to thesenewfuels[40–45].
Analysis of the chemiluminescence properties of CH4/CO2/N2 fuel blends remain scarce. García-Armingol and Ballester [19] found that the increase in CO2 content in CH4/CO2 mix-tures reduces the intensity level of the emission spectra in the near UV andvisible ranges, butit does not changethe shape of these spectra. They attributed this effect to the weak influence of CO2 on the chemistry of methane. Their simulations with an extended version of the GRI 3.0 detailed chemistry mechanism [46] reproduce well the evolution of the OH∗/CH∗ ratiofor mix-tures with 25% and 50% (in volume) of CO2 in CH4/CO2 blends. However, theydidnot consideremissionsfromCO2∗ andfocused their work on sensing the equivalence ratio. Hossain and Naka-mura[9] studiednumericallytheinfluenceofN2andCO2dilution onCH∗chemiluminescenceintensityinlaminarcounterflow diffu-sion flames.They reporteda decreaseof the CH∗ intensitywhen increasing the diluent concentration, but numerical results were not comparedto experiments.TheOH∗ andCO
2∗ excited radicals werenotexaminedintheirstudy.
Thepresentstudyhastwomainobjectives.First,itisintended to determine the accuracy of a simplified chemistry mechanism yieldingtheOH∗,CH∗,andCO
2∗chemiluminescenceintensitiesfor CO2-andN2-diluted lean CH4/airflames. The second objectiveis toexaminetheevolutionoftheOH∗,CH∗,andCO
2∗ chemilumines-cenceintensitieswhenCO2orN2diluentconcentrationsarevaried inthefuelblendandinvestigateifthediluent concentrationmay beinferredfromthesedata.
Methodsincludingexperimentalsetup,diagnostics,and numer-icalmodelsaredescribedinSection2.Flameimagesarepresented in Section 3.1 together with thewaythey are post-processed for
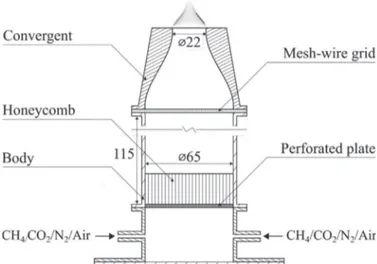
Fig. 1. Schematic of the burner with an example of flame image of a CH 4 /air mix-
ture injected at φ= 0 . 85 , U = 57 . 9 cm.s −1 , and P = 600 W .
the comparisons with numerical simulations. Results for experi-ments andsimulations conductedata fixed equivalenceratioare then presented. The influence of the CO2∗ background emission overlapping theOH∗ and CH∗ emission bands ischaracterized in Section 3.2.EffectsofCO2 andN2 dilutiononCO2∗emissionsare investigatedinSection 3.3 andOH∗ andCH∗ emissionsare exam-ined inSection3.4.Thesedataareusedtoexaminetheevolution of intensityratiosin Section3.5.All theanalysis isfinally briefly re-conductedforflamesdilutedatafixedadiabaticflame temper-atureinSection3.6.
2. Methods
2.1. Experimentalsetup
The experimental setupshowninFig. 1 comprisesan axisym-metric burner fed by mixtures of methane (CH4), carbon diox-ide (CO2), andair.Alternatively, CO2 canbe replaced by nitrogen (N2). The mixture enters the burner through a plenum and sub-sequently passesthroughasetofgrid/honeycomb/gridbefore en-teringaninjectionnozzlewithacross-sectioncontractionratioof 8.7anda22mmnozzleoutletdiameter.Thissystemyieldsatop hat velocityprofileattheburner outletwithareducedboundary layer thickness(∼1 mm) that allows to stabilizelaminar uncon-fined conicalflames.Thechoice ofa ratherlargeexitdiameterof 22 mm allowsto minimize the influenceofheat lossesfromthe baseoftheflametotheburnerrimandreduceseffectsof aerody-namicstrainandflamecurvature[47].Conicalflameswithanearly planar frontovera largefractionoftheflamesurface canbe sta-bilized.OneexampleisshowninFig.1.Therefore,suitable condi-tions forcomparisonswith 1-D FPFdirect simulations are repro-duced.
The CO2 dilutionin the combustible mixture is expressed by the molefraction of CO2 in the CH4/CO2 blend and ranges here from Xfuel
CO2=0 to0.40. When N2 isused instead ofCO2 todilute
theflame,thediluentmixturefractionisvariedbetween0≤XfuelN
2
≤ 0.55. Thesevaluesdo notaccount forthe N2 naturallypresent inair.Themassflow ratesofthedifferentgasesinjected are reg-ulatedbythermalmassflowcontrollers(Bronkhorst,F-series).The mixturecompositionandbulkflowvelocityUattheburneroutlet are known with a relative accuracy better than 3%. Experiments are conductedatafixed thermalpowerP=600W forgas injec-tion at room temperature T0=300 K and atmospheric pressure
Table 1
Ranges of operating conditions explored for dilution at a fixed equivalence ratio φ= 0 . 85 and thermal power P = 600 W , where
U stands for the bulk flow velocity and T ad for the adiabatic flame temperature.
X fuel diluent 0 0.05 0.10 0.15 0.20 0.25 0.30 0.35 0.40 0.45 0.50 0.55 N 2 Tad (K) 2071 2065 2059 2052 2045 2036 2026 2015 2002 1987 1969 × U(cm . s −1) 57.9 58.1 58.4 58.7 59.1 59.5 59.9 60.4 61 61.7 62.6 × CO 2 Tad (K) 2071 2061 2051 2040 2027 2013 1997 1979 × × × × U(cm . s −1) 57.9 58.1 58.4 58.7 59.1 59.5 59.9 60.4 × × × × Table 2
Ranges of operating conditions explored for dilution at a fixed adiabatic flame temperature T ad = 2071 K and thermal power P = 600 W .
X fuel diluent 0 0.05 0.10 0.15 0.20 0.25 0.30 0.35 0.40 0.45 0.50 0.55 N 2 φ 0.850 0.854 0.859 0.864 0.870 0.876 0.884 0.893 0.904 0.918 0.935 0.957 U(cm . s −1) 57.9 57.9 57.9 57.9 57.9 57.9 57.9 57.9 57.9 57.8 57.8 57.7 CO 2 φ 0.850 0.857 0.865 0.874 0.884 0.896 0.911 0.928 0.950 × × × U(cm . s −1) 57.9 57.7 57.5 57.3 57.0 56.7 56.4 56.0 55.4 × × ×
keepingtheequivalenceratioconstantat
φ
=0.85andincreasing progressively the mole fractionof the diluent Xfueldiluent inthe fuel mixture(Table1).Anothersetofexperimentsisconductedby fix-ing theadiabatic flame temperatureto Tad=2071K and increas-ing Xfuel
diluent (Table 2). In this case, the equivalence ratio
φ
is ad-justed between the different casesexplored. Therefore,the adia-baticflametemperaturesTad[48] arefirstcalculatedformixtures withbothdiluents, dilutionratiosofthefuelblend0≤Xfueldiluent≤ 0.55, andequivalence ratios 0.5≤
φ
≤0.96 to build a database. A lookup table is then used to match the equivalence ratioφ
andoperatetheburneratthecorrectadiabaticflametemperature
Tad=2071KforallcasesexploredinTable2.Thecrosssymbolsin Tables1 and2 designateconditionsleadingtoblow-off.
2.2. Diagnostics
The flame chemiluminescence is investigated with two diag-nostics. Thefirst oneisa 1024×1024-pixelsICCDcamera (Prince-ton instruments,PI-Max3) equippedwitha UVlens(UV-NIKKOR, 105 mm,f/4.5)anddifferentinterferometricfilters.Asetofthree 10 nm bandpass filters isused to collect the chemiluminescence signal fromexcitedOH∗,CH∗,andCO
2∗radicals,respectively cen-teredat307nm(CVI,F10-307.1-4-50.0M),430nm(CVI, F10-430.0-4-50.0M),and455nm(Optoprim,455BP10).Meanimagesare ob-tainedbyaveraging350individualimages,eachwithanexposure time of 3 ms. The total integration time is therefore1.05 s. The signal-to-noise ratio(SNR) in theseexperiments isalways higher thanSNR=26.
The second optical system is a low resolution inboard spec-trometer (Ocean Optics, PC2000+UV–vis), coupled with a UV ca-pablefiberoptic,thatrecordsthebroadbandflameemission spec-truminthenear-UVandvisibleranges.Thespectral resolutionof this device, which is determined asthe full width at half maxi-mum (FWHM) of aHe:Ne laser lineat 632nm, is2.4nm. Spec-trapresentedinthisstudyarenotcalibratedinrelativeintensities. Therefore, comparisonsbetweenOH∗,CH∗,andCO
2∗ absolute in-tensitiesarenotpossible.Theexposuretimeisheresetto9sand the spectrometer collects light over the whole flame region. The minimum SNR at 307nm, 430nm, and455 nm arerespectively SNR307=25,SNR430=17,andSNR455=8.
2.3. Numericalmodel
In addition to experiments, direct simulations of 1-D FPF are conducted withan internally developed solver [48] forthe oper-ating conditions shown in Tables 1 and 2. For this purpose,the detailed chemistrymechanismdueto Lindstedt [49],without ac-countingfortheNOxchemistry,isextendedbyincludingreactions
fortheproductionandconsumptionofOH∗[26] (9reactions),CH∗ [26] (10 reactions), andCO2∗ [22] (14 reactions) excited radicals. This extended mechanism includes 32 species and 174 reactions andcanbe found assupplementaryelectronic material. The sub-mechanismfor OH∗ includes 1production (CH+O
2⇋OH*+CO) and 8 consumption reactions, that are divided into 1 chemilu-minescence and7 quenchingreactions. The readeris referred to [26] formoredetails.The excitedradicalCH∗isproducedviatwo main reactions [26]: C2H+O⇋CH*+CO and C2H+O2⇋CH*+ CO2. Panoutsosetal. [16] madecomparisons ofsimulations with the GRI 3.0 [46] andLindstedt [49] chemistry mechanisms asso-ciatedwitha rangeofexcited radicalsub-mechanismsandfound that the use of the Lindstedt mechanism coupled with the OH∗ andCH∗ mechanismsdescribed in[26] yields the bestresultsfor lean CH4/airflames. These mechanismsare selected hereaswell to investigatethe chemiluminescence of OH∗ andCH∗ indiluted CH4/airflames.
Two different models are used to simulate the chemistry of CO2∗.Thefirstmodel,designatedasdetailedmodelinthe follow-ing,includes4mainproductionreactions[22]:
CO+O
(
+M)
⇋CO∗2(
+M)
(1)HCO+O⇋CO∗2+H (2)
H+H+CO2⇋CO∗2+H2 (3)
CH2+O2+⇋CO∗2+H+H (4)
where M designates a third body partner. Kopp et al. [22] also introduced an additional CO2∗ production reaction: CH3CHCO+ OH⇋CO∗
2+C2H5. This reaction cannot be included in our ex-tended version ofthe Lindstedt mechanism because this mecha-nismdoesnotaccountforCH3CHCO.However,thesensitivity anal-ysis presented in[22] shows that this reaction has only a weak influenceinthepredictedCO2∗molefraction.
The second model designated here as simplified model uses a different method to simulate the CO2∗ emission. Studies from Baulchetal.[32] andKoppetal.[22] indicatethatCO2∗ismainly producedthroughEq.(1):CO+O
(
+M)
⇋CO∗2(
+M)
.Consequently, the CO2∗ chemiluminescence intensity ICO2 can be expressed as [21]:ICO2=I
0
CO2[CO][O] (5)
where[CO]and[O] standfortheconcentrationsofCOandO re-spectively and the rate I0
CO2 is a function of temperature, I0CO2= 2.5×10⁶exp[−1600/T] [21]. Asimilar expression is used in [50],
Table 3
Reactions yielding the chemiluminescence of OH ∗, CH ∗, and
CO 2∗. The reaction rate is k = AT βexp (−E/RT) . Units are cal, cm, mole, s, and K. h stands for the Planck constant and ν corre- sponds to light frequency.
Chemiluminescence reaction A β E OH ∗[26] OH ∗→ OH + h ν 1.45E +06 0 0 CH ∗[26] CH ∗→ CH + hν 1.85E +06 0 0 CO 2∗[22] CO ∗2 → CO 2 + hν 1.40E +06 0 0 CO 2∗[21] CO + O → CO 2 + hν 2.50E +06 0 3180
buttheactivation energyEandthe pre-exponentialfactorA take different values to fit their measurements for atmospheric syn-gas/airandmethane/airflames.
Table 3 summarizes the reactions yielding the chemilumines-cence of OH∗, CH∗, andCO
2∗. The light emission intensity is ex-pressed here by the product of the Planck constant h and the emission frequency
ν
.Row 3inthistablecorresponds tothe de-tailedmodelforthecalculationofCO2∗emission.Row4indicates how this emission is calculated with the simplified CO2∗ model Eq.(5) withoutaccountingforthedetailedchemistryofCO2∗.This model reduces the cost of simulations. The three first rows in Table 3 indicate that theOH∗,CH∗,andCO2∗ chemiluminescence intensities are directly proportional to the OH∗, CH∗, and CO
2∗ molefractions. Thisisattributed to thefact that the correspond-ing reaction rates k do not depend on temperature (
β
=E=0). The chemiluminescence intensityof these radicals is then calcu-latedastheproductofthisexcitedradicalmolefractiontimesthe pre-exponentialfactorA.3. Resultsanddiscussion 3.1. Analysisofflameimages
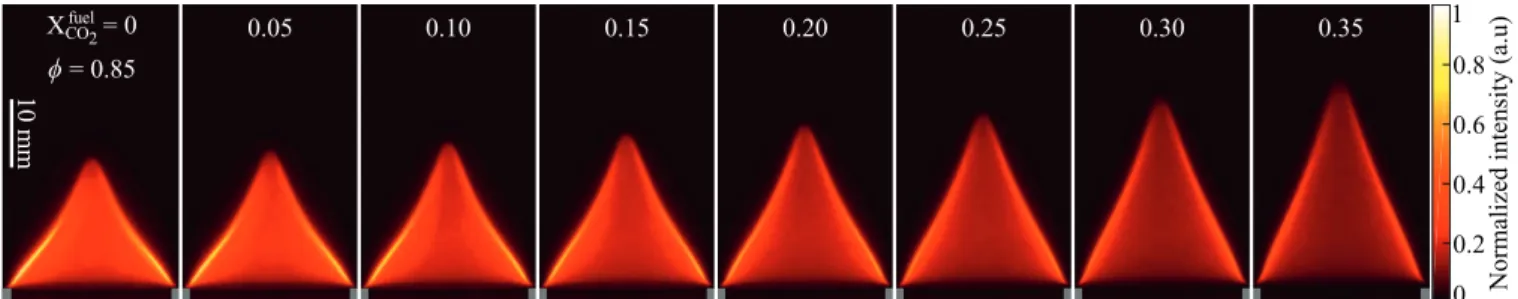
Itisworthstartingtheanalysisbyexaminingflameimages ob-tainedwiththesetupdescribedinSection2.Figure2 showsmean images in false colors obtained with the ICCD camera equipped withtheCVIF10-307.1-4-50.0Mbandpassfiltercenteredat307nm
for increasing concentrations of CO2 in the fuel blend ranging from Xfuel
CO2=0 to 0.35. The equivalence ratio is kept constant to
φ
=0.85. Because experiments are carried out at a fixed ther-mal power P=600W, theinjection bulk flow velocity increases fromU=57.9cm·s− 1 atXfuelCO2=0toU=60.4cm·s
− 1 atXfuel CO2=
0.35 (see Table 1). The flame length measured along the burner axis increases from L=19.3mm at Xfuel
CO2=0 to L=30.4mm at Xfuel
CO2=0.35.Imagesinthisfigureareallnormalizedbythe maxi-mumpixelvaluereachedfortheundilutedcaseshownontheleft. ThemaximumOH∗chemiluminescenceintensityrecordedthus de-creasesforincreasingCO2 concentrations.ExperimentswithN2 as adiluent,notshownhere,exhibitsimilartrends.DilutionwithCO2 orN2 isknowntoalterflamechemistry[50,51] andlaminar burn-ing velocity SL [47,52,53].Flame lengtheningisassociatedhereto adecreaseofthelaminarburningvelocity.
Foreach image inFig.2, theluminosity alongthe flamefront remains roughly constant except close to the flame tip where it decreasesabruptly.Theregionclosetothetipappearslessintense thantheflamebase.Inthisregion,theflamehasahighcurvature leading toa modifiedbalance betweenspeciesandheatdiffusion anda modifiedlaminarburningvelocity [54].Here,however,the weakerluminosityismainlyattributedtosmallverticaloscillations of theflame tipposition withtime duetoa buoyancyinstability in theburntgasesthatsurroundtheflame [55,56].Theregion at the flame tip appears thus artificially broadened in the long ex-posure timeimagesandconsequentlyfeaturesonaveragealower localsignalintensity.Thiseffectlimitedtoanarrowregionovera smallfractionoftheflame surfacearea barelychanges theglobal chemiluminescence signalintensityintegratedovertimeandover thewholeflameregion.
Figure 3 showsCO2-diluted flame images when the adiabatic flametemperatureiskeptconstantatTad=2071Kandthe equiva-lenceratioismodified.Hereagain,theflameheightincreaseswith largerdiluent concentrationsandreachesL=19.3mmatXfuel
CO2=0
andL=23.7mmatXfuel
CO2=0.35.Dilutionhashoweveraweaker
in-fluenceontheflameheightthanexperimentsconductedata con-stant equivalence ratio shownin Fig. 2. This is attributedto the
Fig. 2. Mean chemiluminescence images of CH 4 /CO 2 /air flames with P = 600 W , φ= 0 . 85 , and varying CO 2 mole fractions in the combustible mixture (see Table (1 )). The
ICCD camera is equipped with a 10 nm bandpass filter centered at 307 nm.
Fig. 3. Mean chemiluminescence images of CH 4 /CO 2 /air flames with P = 600 W , T ad = 2071 K , and varying CO 2 mole fractions in the combustible mixture (see Table (2 )).
Fig. 4. Example of mean (left), Abel transformed (middle), and filtered (right) chemiluminescence images obtained with the bandpass filter centered at 307 nm for P = 600 W , φ= 0 . 85 , and X fuel
CO2= 0 . 15 . -1 -0.5 0 0.5 1 1.5 2 0 0.2 0.4 0.6 0.8 1 300 600 900 1200 1500 1800 2100 Temperature (K)
Normalized intensity (a.u)
T OH* Schlieren x (mm) XCO2fuel = 0.15 ϕ = 0.85
Fig. 5. Computed OH ∗, schlieren intensity ((1/ T 2 )( ∂ T / ∂ x )), and temperature T pro-
files for a flame at P = 600 W , φ= 0 . 85 , and X fuel CO2= 0 . 15 .
increase ofequivalenceratio(see Table2) thatenhancesthe lam-inar burningvelocity SL andcompensates effects ofdilutionto a certain extent.ThesameremarkcanbemadefortheOH∗ chemi-luminescenceintensity.TheOH∗reductionobservedinFig.3 when thediluentconcentrationincreasesisweakerthaninFig.2.Results forchemiluminescence intensitiesarecompared onamore quan-titativebasisinthefollowingsections.
Toallow comparisonswith1-D directsimulations, experimen-tal dataneedtoberescaled bytheflamesurface area,whichcan be obtainedbypost-processing themeanchemiluminescence im-ages presented inFigs. 2 and 3. Foreach operating condition in-vestigated, anAbeltransformationis firstappliedonthe raw im-ages recorded by the ICCD camera equipped with the CVI F10-307.1-4-50.0M bandpass filter to determine the OH∗ chemilumi-nescence signal originating from a central vertical plane passing through the burner axis (Fig. 4 left and middle). A 10×10-pixels medianfilteristhenappliedontheresultingimagestoreducethe noise producedbytheAbeltransformation(Fig.4 right).A home-madeMatlab® routinethencomputestheflamesurface areafrom the filteredimages.Inthisstudy,theOH∗ signalisused to delin-eatetheflamefrontposition,whichisidentifiedasthepositionof maximumOH∗ chemiluminescenceintensity.TheOH∗signaltakes its highestvaluesinthehottestregionsoftheflameandisoffset withrespecttothebeginningofthepreheatedregionusuallyused to define the flame surface area [16]. Forlaminarburning veloc-ity measurements, the schlieren orshadowgraphy techniques are thereforeoftenpreferredtoinferpreciselytheflamefrontposition [47,52,57]. Figure 5 showsthe computednormalized OH∗ chemi-luminescenceintensityandthetemperatureprofilefora flameat
P=600W,
φ
=0.85,andXfuelCO2=0.15calculatedwiththecode
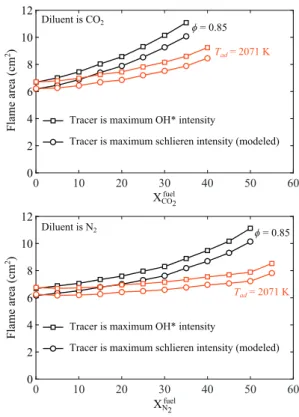
de-0 10 20 30 40 50 60 0 2 4 6 8 10 12 0 10 20 30 40 50 60 0 2 4 6 8 10 12 XCO2fuel Diluent is CO2 XN2fuel Diluent is N2 Flame area (cm 2) Flame area (cm 2) ϕ = 0.85 ϕ = 0.85 Tad = 2071 K Tad = 2071 K Tracer is maximum OH* intensity
Tracer is maximum schlieren intensity (modeled)
Tracer is maximum OH* intensity
Tracer is maximum schlieren intensity (modeled)
Fig. 6. Measured flame surface area for CH 4 /air flames diluted with CO 2 (top) or N 2
(bottom). Results are presented for dilutions at a fixed equivalence ratio φ= 0 . 85 (black) or adiabatic flame temperature T ad = 2071 K (red). The flame front tracer is
the maximum OH ∗chemiluminescence intensity (square symbols) or the simulated
maximum schlieren intensity (circle symbols). (For interpretation of the references to color in this figure legend, the reader is referred to the web version of this arti- cle.)
scribedinSection2.3.Asyntheticschlierensignalprofile,defined as(1/T2)(
∂
T/∂
x)[58] withTandxbeingthe temperatureandthe progressalongacoordinatenormaltotheflamefront,isalso plot-ted.Theoriginx=0inthisfigurecorrespondstothebeginningof thepreheatzone.Themaximumschlierenintensityliesata posi-tionx=0.18mm located 0.45mm upstream the OH∗ peak inten-sitydetected at x=0.63mm.Simulations show that the distance betweentheschlierenandOH∗peaksisalwayscomprisedbetween 0.41mmand0.54mmfortheoperatingconditionsinvestigatedin Tables1 and2.Figure6 showsthe measured flamesurface area(square sym-bols) deduced fromthe OH∗ signals asa function ofthe diluent concentrationwithCO2(top)orN2 (bottom)forexperiments con-ductedatafixedequivalenceratio(black)andatafixedadiabatic flametemperature(red).Knowingthedistanced=0.48±0.6mm betweentheOH∗ peakintensityandschlierenfrontallowstoplot acorrectedflamesurfacearea(circlesymbols)thatwouldbe mea-sured by a schlieren technique. Comparison between these two quantities shows that calculations with the OH∗ tracer overesti-mates the flame surface area by about 9± 1% on average com-paredtothat deduced withasynthetic schlierensignal. This dif-ference remains roughly constant and corresponds to a constant offset for all cases explored. In what follows, all chemilumines-cence intensities are normalized by the peak value obtained for the undiluted referencecase Xfuel
diluent=0 at
φ
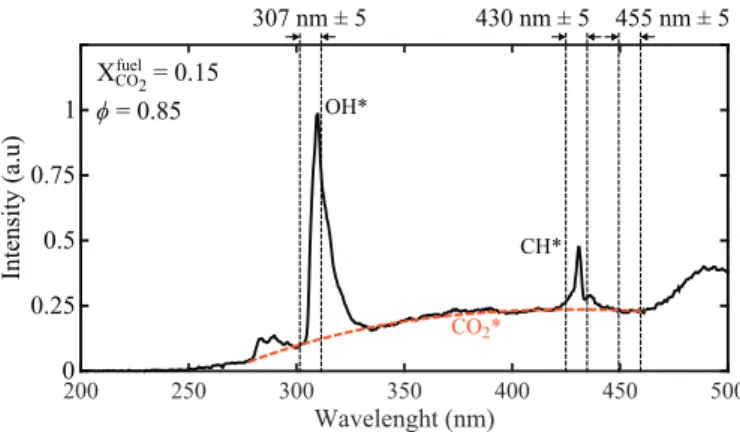
=0.85. Due to the roughly constant offsetbetweenthe flamesurface areasdeduced fromthe OH∗ andthe syntheticschlieren signals,the OH∗ signal can,inthisstudy,safelybeusedtodeterminetheflamesurface ar-easneededtonormalizethechemiluminescence data.This proce-dureisappliedtocompareresultsfrom1-D FPFsimulationswith experiments.Intensity (a.u) Wavelenght (nm) 200 250 300 350 400 450 500 XCO2fuel = 0.15 0 0.25 0.5 0.75 1 OH* CH* CO2* 5 ± m n 0 3 4 455nm±5 5 ± m n 7 0 3 ϕ = 0.85
Fig. 7. Flame spontaneous emission spectrum for P = 600 W , φ= 0 . 85 , and X fuel CO2=
0 . 15 . Vertical dashed lines show the width of the bandpass filters used during the ICCD experiments. 0 10 20 30 40 50 60 0 20 40 60 80 100 Xdiluentfuel Diluent is N2 Diluent is CO2
}
}
OH* CH*ϕ = 0.85
IX* /( IX* + ICO 2 * ) (%)Fig. 8. Chemiluminescence intensities emitted by OH ∗ (circle symbols) within
[278–336 nm] and CH ∗ (square symbols) within [416–449 nm] and normalized by
the total chemiluminescence intensity emitted by both OH ∗and CO
2∗ or CH ∗ and
CO 2∗, respectively. Results are presented as a function of the mole fraction of dilu-
ent, N 2 (black) or CO 2 (red), in the fuel for φ= 0 . 85 . (For interpretation of the ref-
erences to color in this figure legend, the reader is referred to the web version of this article.)
3.2. EffectsofCO2∗emissionbackground
WenowaimatdeterminingeffectsofCO2∗onflameemission spectrabetween200 and500nm. Figure7 showsaspontaneous emissionspectrumforaCH4/CO2/airflameat
φ
=0.85andXfuelCO2=
0.15.Thespectrumexhibitstwonarrowpeaksaround309nmand 432 nm that are characteristics of OH∗ and CH∗ chemilumines-cenceemissions[14].Onealsoidentifiesthebroadbandcontinuous lightemissionfromCO2∗[21],thathasbeenfittedherebythered dashed linebetween270 and460 nm.Figure 7 showsthat plac-ing theCVIF10-307.1-4-50.0Mnarrowbandpass filtercenteredat 307 nm in front of the ICCD camera does not allow to only se-lecttheOH∗emissionbecausetheCO
2∗backgroundemissionhas alreadyasizable contributionatthesewavelengths.Thisproblem was alreadyreported in[7,8,18,19].The samephenomenon is ob-servedat430nmfortheCH∗excitedradicalwithalarger contri-bution from theCO2∗ background emission intensityto the light recordedbythespectrometer.Figure7 alsoshowsthatabandpass filtercenteredat455nmallows toselectonlythe chemilumines-cencefromexcitedCO2∗radicals.
It is worth examining the contribution of the CO2∗ inten-sitybackgroundtoOH∗andCH∗chemiluminescenceintensitiesin more details. Figure 8 plots the OH∗ intensity, I
OH∗, recorded in
the range [278–336nm]. This wide spectral width takes mostof the OH∗ emission bands intoaccount asshownin Fig.7. Results
inFig.8 are normalizedbythetotalchemiluminescence intensity emitted by both OH∗ and CO
2∗ excited radicals, IOH*+ICO∗ 2, over
thesamespectralrange.Resultsarepresentedasafunctionofthe diluent molefraction inthe fuel for
φ
=0.85.The OH∗ intensityIOH∗ iscomputedasfollows:
IOH*= Z 336
278
[S
(
λ
)
−B(
λ
)
]dλ
(6)where
λ
isthewavelength,Sstandsforthespectrometermeasured intensity(blacksolidline),andBrepresentsthefittedCO2∗ chemi-luminescenceintensity(reddashedline)ICO∗2: ICO∗ 2= Z336 278 B
(
λ
)
dλ
(7)For N2-diluted flames, Fig. 8 shows that the OH∗ chemilumines-cence intensity corresponds roughly to 60% ofthe total chemilu-minescenceintensitydetected inthespectralrange[278–336nm] that includesboth theOH∗ andCO
2∗ contributions.IncreasingN2 dilution hasonly a weak influence onthe fractionof light emit-ted by OH∗, but the CO
2∗ background intensity cannot be ne-glected.ForCO2-dilutedflames,thecontributionoftheCO2∗ back-ground intensityincreases with theCO2 concentration and leads to a dropof IOH∗ with respect to IOH*+ICO
2∗ inFig. 8. The ratio
ICO2∗/
(
IOH*+ICO2∗
)
reaches46% atXfuelCO2=0.35.ForlargeCO2
dilu-tion concentrationsXfuel
CO2>0.40, which could not be explored in theseexperimentsduetoblow-off issues,theCO2∗ chemilumines-cenceintensitymightexceedtheOH∗chemiluminescenceintensity over therange [278–336nm]. Theseconditionswouldcorrespond to a weak OH∗ emission peak around 307 nm flooded within a continuous CO2∗backgroundemission.Inthiscase, narrow band-pass filters (FWHM< 10nm) centered aroundthe wavelength of maximum OH∗ emission must be preferred. To illustrate it, the chemiluminescence intensity recorded withthe CVI F10-307.1-4-50.0Mbandpassfilterallows tocollectmorethan77%ofthelight intensityoriginatingfromOH∗ radicalseven atlarge CO
2 concen-trationsXfuel
CO2=0.35.Thislargevaluealsoprovesthatitisnot nec-essary to correcttheOH∗ imagescollected with the F10-307.1-4-50.0M filter that are used to determine the flame surface area. It should also be noted that the values plotted in Fig. 8 cannot be used tocorrectOH∗imagesbecause therangeofwavelengths used forcomputations doesnot matchthe transmission band of theF10-307.1-4-50.0Mfilter.
The sameanalysis is now carried inFig. 8 for theCH∗ spon-taneous emission band around 430nm integratedover a 33 nm spectralbandwidth.TheCH∗chemiluminescenceintensityI
CH∗,
de-tectableintherange[416–449nm],iscomputedasfollows: ICH*= Z 449 416 [S
(
λ
)
−B(
λ
)
]dλ
(8) whereICO∗ 2 isnow: ICO∗ 2= Z449 416 B(
λ
)
dλ
(9)Independentlyofthediluentnatureanditsconcentrationinthe mixture,around80%ofthesignalintensitydetectedinthespectral range[416–449nm]originatesfromCO2∗andnotfromCH∗.A nar-row bandpass filtercenteredaround the CH∗ maximumemission peak near 430 nm, like the CVI F10-430.0-4-50.0M filter with a FWHMC10nmusedinthisstudy,allowstoreducethe contribu-tionofCO2∗intensitytolessthan65%.Inanycases,itisnecessary to correct forthe CO2∗ intensity backgroundif theCH∗ intensity needstobeanalyzedprecisely.ThisisillustratedinFig.9.
Figure9 leftshowsanAbelinvertedimageofthelightrecorded with the ICCDcamera equipped withthe CVIF10-430.0-4-50.0M bandpass filter centered at 430 nm for a CO2-diluted flame at
0.2
0 0.4 0.6 0.8 1
Normalized intensity (a.u)
2 mm
430 nm
CH*
Fig. 9. Left: Abel transformed image of the light detected by the ICCD camera equipped with the CVI F10-430.0-4-50.0M bandpass filter centered at 430 nm for a flame at P = 600 W , φ= 0 . 85 , and X fuel
CO2= 0 . 15 . Only the region near the flame base
is presented. Right: Post-processed image obtained after subtraction of the CO 2∗in-
tensity background.
P=600W,
φ
=0.85,andXfuelCO2 =0.15.Onlytheregionclosetothe
flamebaseisshowninthisfigure.Thisimagefeaturesarelatively broadregionwithhighpixelvaluesrevealinglightemissionovera region extending overmorethan 1 mm.Thisis attributedtothe emission of CO2∗ because the CH∗ radical cannot be present so far downstreaminthe burntgasesfortheseoperatingconditions [11,16,33,34].The samesetup wasusedbutwiththeICCDcamera equipped withtheOptoprim 455BP10bandpass filtercentered at 455 nm, i.e. closeto the CH∗ emission range,to record only the CO2∗ emission intensity. This image is then used to remove the CO2∗ contributionfrom theimage shownin Fig.9 left [7,8]. This is suitable because theCO2∗ emission spectrum remains roughly flatintherange[420–460nm](Fig.7).Theresultofthiscorrection ispresentedinFig.9 right.Thisnewimageshowsanarrowregion withhighpixelvalueswelldelineatingthereactionlayerandthere isnosignificantsignalfewtensofmillimetersdownstreamthe re-actionzone.Thesignalshowninthisimagecannowbeattributed totheCH∗emissiononly.
3.3. EffectsofCO2andN2dilutiononCO2∗
Focus is now made on the influence of CO2 and N2 dilution on thechemiluminescence ofCO2∗.The flame surfaceareas plot-tedinFig.6 areusedtonormalizethechemiluminescence intensi-tiesmeasuredwiththeICCDcameraequippedwiththeOptoprim 455BP10bandpassfiltercenteredat455nm.TheCO2∗signal mea-sured by the spectrometer over the same spectral bandwidth as
theOptoprim455BP10filterisalsocorrectedbytheflamesurface areatoyieldICO∗
2=
R460 450S
(
λ
)
dλ
.Itisfirstworthexaminingtheevolutionofthelightintensityin thenormaldirectionto theflamefront.Figure10 showsthe nor-malizedprofiles ofthe measured CO2∗ chemiluminescence inten-sity(black solid line)asa function ofthe distancextothe flame front for CO2-diluted flames at P=600W and
φ
=0.85. Results are presented fordifferent diluent concentrations XfuelCO2=0, 0.25, and0.35.ThelocationofthemaximumCO2∗peakintensityisused heretodefinetheoriginofthenormalaxisx=0.Negativevalues
x<0correspondtothereactantside.Theseprofilesareprobedat aheight of4 mmabove the burner lipto minimize boththe in-fluenceof heatlossesto theburner andoscillations ofthe flame tipposition.Startingfromthefreshreactants(x<0),onecan no-ticeaverysharpincreaseoftheCO2∗chemiluminescenceintensity nearxC0.TheCO2∗chemiluminescenceintensitythenslowly de-creasesinthepost-flameregion(x>0)andvanishesforx>3mm forall diluent concentrations explored. Away fromthe flame tip andflamebase,thesefeaturesarefoundtobeindependentofthe heightabovewhichtheexperimentalprofilesaresampled.
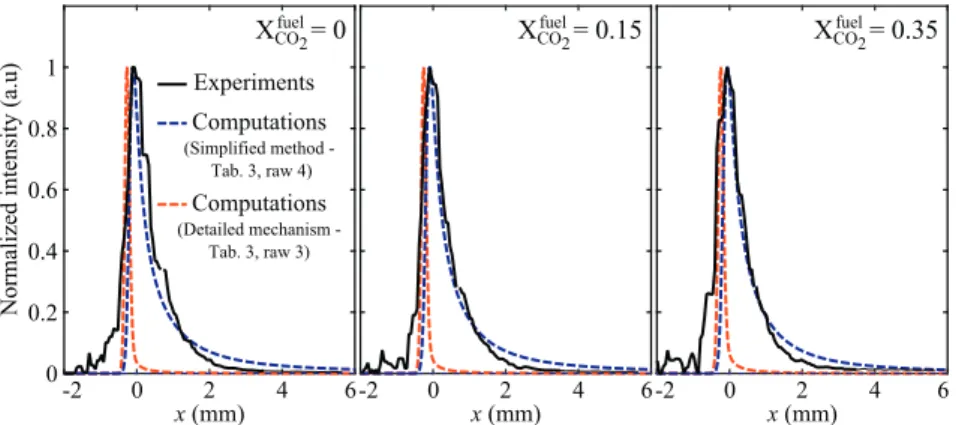
ThebluedashedlinesinFig.10 showresultsforthenormalized CO2∗ intensityprofilescalculatedwiththesimplifiedCO2∗ chemi-luminescencemodel basedon OandCO molefractions (Table 3, row4). Thelocation oftheCO2∗ peakintensityisusedto rescale simulationswithexperimentsatx=0.Themeasuredandthe cal-culated CO2∗ profilesmatchwell forthethreedilutionsexplored. This simplified CO2∗ chemiluminescence model is able to accu-ratelyreproducetherateofconsumptionofCO2∗inthepost-flame region due to both chemiluminescence andquenching reactions. The red dashed lines in Fig. 10 show the computed normalized CO2∗chemiluminescenceintensityprofilescalculatedwiththe de-tailed chemistry mechanism(Table 3,row 3). This modellargely overestimatestheconsumptionrateofCO2∗ inthepostflame re-gion and consequently fails to capture the CO2∗ chemilumines-cence intensity in this region. This remains true over the whole rangeofdilutionratios examined.Atthisstage, thereisno inter-pretationforthebehavior ofthedetailedmechanismthat failsto capturetheCO2∗emissionintheburntgases.Thesimplifiedmodel basedon O andCOmole fractions(Table 3, row4) yields better predictionsofCO2∗relativeconcentrations.
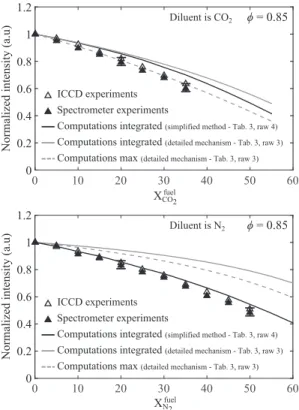
Signalsintegratedoverthewholeflameregionandnormalized by theflame surface area are nowexamined. Figure 11 top plots themeasured CO2∗ chemiluminescence intensityasa function of the CO2 mole fraction in the fuel when the equivalence ratio is kept constant and equal to
φ
=0.85. Results are normalized by thevalueobtainedfortheundilutedflamewhenXfuelCO2=0.Hollow 0 0.2 0.4 0.6 0.8 1 -2 0 2 4 6 x (mm) -2 0 2 4 6 x (mm) -2 0 2 4 6 x (mm)
Normalized intensity (a.u)
X
CO2fuel= 0
X
CO2fuel
= 0.15
X
CO2fuel= 0.35
Experiments Computations (Simplified method Tab. 3, raw 4) Computations (Detailed mechanism - Tab. 3, raw 3)Fig. 10. Normalized profiles of the measured (black solid line) and computed (blue and red dashed lines) CO 2∗chemiluminescence intensity as a function of the distance to
the flame front x for flames at P = 600 W and φ= 0 . 85 . Negative and positive values of x correspond to the reactant and burnt gases sides, respectively. Results are presented for three flames featuring different dilution ratios X fuel
CO2= 0 (left), 0.15 (middle), and 0.35 (right). (For interpretation of the references to color in this figure legend, the reader
0 10 20 30 40 50 60 0 0.2 0.4 0.6 0.8 1 1.2 ϕ = 0.85 XCO2fuel Diluent is CO2 0 10 20 30 40 50 60 0 0.2 0.4 0.6 0.8 1 1.2 XN2fuel ϕ = 0.85 Diluent is N2
Normalized intensity (a.u)
Normalized intensity (a.u)
ICCD experiments Spectrometer experiments
Computations integrated (simplified method - Tab. 3, raw 4)
Computations integrated (detailed mechanism - Tab. 3, raw 3)
Computations max (detailed mechanism - Tab. 3, raw 3)
ICCD experiments Spectrometer experiments
Computations integrated (simplified method - Tab. 3, raw 4)
Computations integrated (detailed mechanism - Tab. 3, raw 3)
Computations max (detailed mechanism - Tab. 3, raw 3)
Fig. 11. Measured (symbols) and computed (lines) of CO 2∗chemiluminescence in-
tensity as a function of the diluent mole fraction in the combustible mixture. Dilu- ent is CO 2 (top) or N 2 (bottom).
trianglesymbolsstand forthe chemiluminescenceintensity mea-sured by the ICCD camera equipped with the 10 nm Optoprim 455BP10 bandpass filter centered at 455 nm and averaged over the whole flameregion. These dataare compared withthe CO2∗ emission intensities recorded by the spectrometer (black triangle symbols)andintegratedoverthespectralrange[450–460nm]. Ex-periments withthe ICCD camera andthe spectrometer yield re-sults that collapse on the same curve up to Xfuel
CO2=0.35. It was also checked that the CO2∗ chemiluminescence intensities calcu-latedwiththespectrometerdataintegratedoverdifferentspectral ranges producesimilar results(see supplementary electronic ma-terial). The spectral distribution of thebroadband CO2∗ chemilu-minescenceintensityremains unchangedwithin the rangeof op-eratingconditionscoveredinTables1 and2.
InFig.11 andtheconsecutivefigures,errorbarsarepresented for the chemiluminescence intensities recorded with the spec-trometerandcorrectedforthebroadbandCO2∗background emis-sion (filled symbols). Values for the chemiluminescence intensi-ties are obtained through the post-processing steps described in Sections 3.1 and 3.2 andare therefore sensitive to a numberof input parameters suchasthe orderofthepolynomial forthe fit-tedCO2∗backgroundintensity,thesizeofthemedianfilterforthe determinationoftheflamesurfacearea,andthewavelengthrange chosen for integrationofthe emission spectra.The magnitudeof error bars istherefore determined by assessing the sensitivityof thechemiluminescenceintensitytothesevariousinputparameters whose mostappropriate values are,a priori,notknown. Through the paper, variations of measured OH∗, CH∗, and CO
2∗ chemilu-minescence intensities asa function of thediluent concentration and diluent nature are considered meaningful ifthey exceed ex-perimentaluncertainties,representedbytheseerrorbars.
Figure 11 topshowsthat dilutionwithCO2 leads toa smooth decreaseofthemeasuredCO2∗intensity.Thissignaldropsby40% when the mole fraction of CO2 in the fuel reaches XfuelCO2=0.35.
Figure 11 bottom shows that experiments made with the ICCD camera andthespectrometer forN2-diluted CH4/airflames again lead tothesameresultsuptoXfuel
N2 =0.50.TheCO2
∗ emission in-tensityalsodecreases forincreasing N2concentrationsinthefuel blend. For the same equivalence ratio
φ
=0.85, the CO2∗ inten-sity decaysmoreslowlyforN2-dilutedfuelblends thanwithCO2 dilution.TheCO2∗intensitydropsby40%dropforXfuelN2 =0.45 ap-proximately.The evolution of the CO2∗ intensity, integratedin the normal direction andrescaledfora1m2flamesurfacearea,calculatedby the numerical solver andthe CO2∗ detailed mechanism(Table 3, row 3) is plotted in Fig. 11 top as a function of the CO2 dilu-ent mole fraction (gray solid line). These simulations also repro-duce the decayofthe CO2∗ chemiluminescence intensityas dilu-tion increases. However, they underestimate the rateof decayof the CO2∗ chemiluminescenceintensityby approximately30%. An-other attemptwasmadebyplottingasdashedgraylinesthe evo-lutionofthecalculatedpeakCO2∗intensityreachedineachflame. Agreementbetweenexperimentsandsimulationsslightlyimproves fortheCO2-dilutedflamesinvestigated.Resultswiththesimplified CO2∗modelsynthesizedinTable3,row4areplottedasthesolid blackcurve inFig.11 topwhenthenumericalsignal isintegrated along the normalto the flamefront. Agreement between experi-mentsandsimulationsisacceptable,withrelativedifferences lim-ited to 7%. Results with the simplified CO2∗ model are in better agreementwithmeasurementsthanthosefoundwiththedetailed mechanism forCO2∗.CalculationsofCO2∗ chemiluminescence in-tensities usingthevaluesfortheactivationenergyE andthe pre-exponentialfactorAfrom[50] werealsocarriedoutandtheyyield similarresults.Theyarenotreproducedhere.
WhenCO2isreplacedbyN2,Fig.11 bottomshowsthatthe sim-plified CO2∗modelyields an accurate predictionofthemeasured evolution oftheCO2∗ chemiluminescence intensity,whilethe de-tailed modelforCO2∗failstopredictaccuratelythedropofCO2∗, independently of the way calculations are post-processed. These testsconfirmthattheCO2∗intensitycanbesimulatedadequately forN2-andCO2-dilutedCH4 fuelblends providedthat the simpli-fied CO2∗ in Table 3 row4 is used. All the simulations are thus conductedwiththismodelintheremainingpartsofthisstudy.
3.4. EffectsofCO2andN2dilutiononOH∗andCH∗
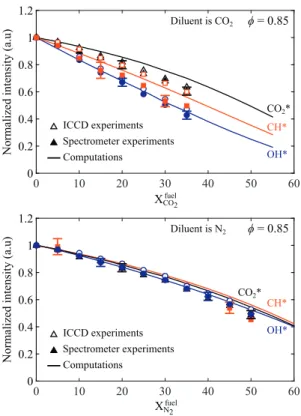
Effects ofdilutionontheOH∗ andCH∗emissionsarenow ex-amined. ResultsfortheCO2∗excitedradicalarerepeated for com-parison purposes. Figure12 top showsthe measured CO2∗ (black triangles), OH∗(blue circles), andCH∗ (redsquares)intensities as a functionofthe CO2 molefractioninthe fuelforleanflames at afixedequivalenceratio
φ
=0.85.Resultsareagainnormalizedby thevalueobtainedfortheundilutedflame.Hollowandsolid sym-bols stand for the chemiluminescence intensities measured with the ICCDcamera andthe spectrometer,respectively.The OH∗ and CH∗intensitylevels measured withtheICCDcameraare not cor-rected forthe CO2∗ intensitybackground inthisfigure. However, theintensities deducedfromspectrometermeasurementsare cor-rected for the CO2∗ intensity background. Thisfigure shows that the emission intensityfromthesethree excited radicals regularly decreases when theCO2 concentration in the fuel increases.The OH∗chemiluminescenceintensitydropsby57%whenXfuelCO2=0.35. It is known that increasing the CO2 concentration in the com-bustible mixture reduces the concentration of CH in the flames [59]. The production of OH∗ is then penalized because this ex-cited radical ismainly produced through the formation reaction: CH+O2⇋OH*+CO[16,23].ResultsforOH∗obtainedby subtract-ingtheCO2∗background(bluedisks)areonaverageonly4%lower thanthemeasuredOH∗intensitieswithoutcorrection(bluecircles)
0 10 20 30 40 50 60 0 0.2 0.4 0.6 0.8 1 1.2 0 10 20 30 40 50 60 0 0.2 0.4 0.6 0.8 1 1.2 ϕ = 0.85 XCO2fuel Diluent is CO2 XN2fuel ϕ = 0.85 Diluent is N2
Normalized intensity (a.u)
Normalized intensity (a.u)
ICCD experiments Spectrometer experiments Computations CO2* CH* OH* ICCD experiments Spectrometer experiments Computations CO2* CH* OH*
Fig. 12. Measured (symbols) and computed (lines) normalized spontaneous emis- sion intensities of OH ∗(blue), CH ∗(red), and CO
2∗(black) as a function of the dilu-
ent mole fraction in the combustible mixture. Hollow and solid symbols stand for ICCD camera and spectrometer measurements, respectively. Experiments are real- ized at a fixed equivalence ratio φ= 0 . 85 . Diluent is CO 2 (top) or N 2 (bottom). (For
interpretation of the references to color in this figure legend, the reader is referred to the web version of this article.)
inFig.12 top.Asalreadyindicatedintheprevioussection, correc-tion fortheCO2∗ backgroundintensityhasonly aweakinfluence inthespectralbandwidthofOH∗spontaneousemission.
Conversely, correction for the CO2∗ background has a large influence on the measured CH∗ emission levels, as shown in Fig. 12 top where data deduced from the spectrometer (filled red squares) liebelowthose obtainedwiththeICCDcamera (red squares)equippedwiththeCVIF10-430.0-4-50.0Mbandpassfilter centeredat430nm.Thisisinagreementwithresultspresentedin Fig.8 wherethemajorityofthesignaldetectedbytheICCD cam-eraaround430nmcomesfromCO2∗emission.RemovingtheCO2∗ backgroundintensityreducesthemeasuredCH∗emissionlevelby 10% on average. It is however worth noting that the subtraction oftheCO2∗backgroundintensityleadstolargererrorbarsforthe deducedCH∗intensitylevelsinFig.12 top.
Data for lean N2-diluted flames at
φ
=0.85 are presented in Fig. 12 bottom.TheOH∗,CH∗,andCO2∗ measuredintensities col-lapsehereonthe samecurve.The intensityoftheseexcited rad-icals regularly decreases for increasing N2 mole fractions in the fuel. A similar effect of N2 dilution was reported in [9] for the CH∗ chemiluminescence intensity.The OH∗, CH∗,andCO
2∗ emis-sionlevels dropbyapproximately30%and50%whenXfuel
N2 =0.35 and Xfuel
N2 =0.50, respectively. For the same molefraction in the fuelmixture,dilutionwithN2hasasmallereffectontheOH∗and CH∗chemiluminescenceintensitiesthandilutionwithCO
2. The black, blue, andred solid lines in Fig. 12 show the com-puted intensitiesfromCO2∗,OH∗,andCH∗,respectively.TheCO2∗ chemiluminescence intensity plotted here is calculated with the simplified model described in Table 3, row 4. Simulations re-produce well experiments for the OH∗ signal for both CO
2- and
N2-diluted mixtures. Measurementscorrected for the CO2∗ back-groundemissionintensityhoweveronlybarelyreducerelative dif-ferencesthatarelimitedto3%.
InthecaseofCO2-dilutedflames,differencesbetween measure-mentsandpredictionsaremoreimportantinFig.12 (top)forthe CH∗ emission intensity, with a mean difference of 7%. However, thisdifferencebarely exceedsexperimental uncertainties. Simula-tionsyieldabettermatchwithCH∗experimentaldatathatarenot correctedfor theCO2∗ backgroundemission. Thismaybe due to therelativelylowratiobetweentheCH∗signalandtheCO
2∗ back-groundintensityleadingtolargeuncertaintiesinthecorrectedCH∗ chemiluminescence intensities (see Figs. 7 and8). For N2-diluted flamesshowninFig.12 bottom,simulationsreproducewell mea-surementsforthethreeradicalsandoverthewholerangeof dilu-tionexplored.Themeanrelativedifferencebetweenmeasurements andsimulations only reaches2%, 5%, and 6% for OH∗,CO
2∗, and CH∗,respectively.
For most of the operating conditions, the detailed chemistry mechanismsforOH∗andCH∗,aswell asthesimplifiedmodel to computetheCO2∗intensity,yieldgoodresults.Itisalsoworth not-ingthatthesubtractionoftheCO2∗backgroundintensityhasonly aweak influenceon theintegratedresults showninFig.12.This isattributed tothecomparableinfluenceofdilutiononthe three excited radicals emission intensities. Their intensity decreases at about the same proportion when the diluent concentration in-creases,especiallyforN2-dilutedflames.
3.5.AnalysisofOH∗,CH∗,andCO
2∗intensityratios
Inmanyapplications,theflamesurfacearea isnotknownand isdifficulttomeasure.Thisisthecaseforturbulentflameswhere the reaction layer has a 3-D structure and fluctuates withtime. In such cases, it is difficult to normalize the measured chemilu-minescenceintensitiesby theflame surfacearea. Comparison be-tweenmeasuredintensitiesand1-Dsimulations isthenmore dif-ficult. Consequently, chemiluminescence intensity ratios between different couples of excited radicals are often examined because they allow to remove the contribution of the flame surface area [11,14,16,18–20].EffectsofCO2andN2dilutionsontheseratiosare examinedhere.
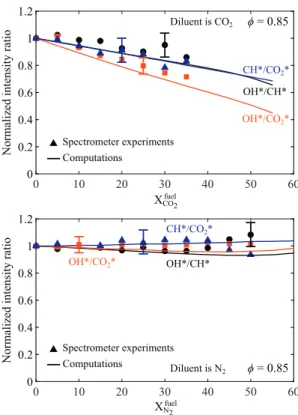
Figure13 showsthemeasuredOH∗/CH∗(blackcircle),OH∗/CO 2∗ (redsquares), and CH∗/CO
2∗ (blue triangles) intensity ratios asa functionofthe diluentmolefractioninthe fuel,afterthe contri-butionoftheCO2∗backgroundhasbeenremovedusingthe spec-trometerexperiments.Resultsare presentedforCO2-diluted(top) andN2-diluted (bottom)flames andare normalized by thevalue obtained for the undiluted case. The experimental data feature largererrorbarsthaninthepreviousfiguresduetothecumulative relativeerrorsonthenumeratoranddenominatoroftheintensity ratios.Errorbarsareonlyplottedinthisfigureforthreeoperating conditionstoillustratetheconfidencerange.
When dilution is made with CO2 (Fig. 13 top), these three intensity ratios decrease when the mole fraction of CO2 in the fuelincreases.For example,themeasured OH∗/CO
2∗ intensity ra-tio drops by nearly 30% for Xfuel
CO2=0.35. The decay rate of two other intensitycouplesOH∗/CH∗ andCH∗/CO
2∗ withCO2 dilution isthesameandtakesalowervaluethanfortheOH∗/CO
2∗couple. WhendilutionismadewithN2(Fig.13 bottom),these chemilumi-nescenceintensityratiosremainroughly constantwithinthe con-fidence interval when the diluent concentration is increased. All of thesefeatures are also well captured by the simulations both forN2-andCO2-dilutedflames,exceptforlargeN2 concentrations Xfuel
N2 >0.40.
These results indicate that after careful calibration, monitor-ingtheOH∗/CO
2∗chemiluminescenceintensityratiomayallow in-ferring theCO2 diluent concentration inlean CH4/CO2/airflames.
0 10 20 30 40 50 60 0 0.2 0.4 0.6 0.8 1 1.2 0 10 20 30 40 50 60 0 0.2 0.4 0.6 0.8 1 1.2 ϕ = 0.85 XCO2fuel Diluent is CO2 XN2fuel ϕ = 0.85 Diluent is N2
Normalized intensity ratio
Normalized intensity ratio
Spectrometer experiments Computations OH*/CH* OH*/CO2* CH*/CO2* Spectrometer experiments Computations OH*/CH* OH*/CO2* CH*/CO2*
Fig. 13. Measured (symbols) and computed (lines) normalized OH ∗/CH ∗ (black),
OH ∗/CO
2∗ (red), and CH ∗/CO 2∗ (blue) intensity ratios as a function of the diluent
mole fraction in the combustible mixture for CH 4 /air/diluent mixtures at a fixed
equivalence ratio φ= 0 . 85 . Diluent is CO 2 (top) or N 2 (bottom). (For interpretation
of the references to color in this figure legend, the reader is referred to the web version of this article.)
However, this technique cannot be used for N2-diluted CH4/air flames.
3.6. Analysisofdilutioneffectsatafixedadiabaticflametemperature
Sofarthechemiluminescence dataforCH4 fuelblends diluted with N2 or CO2 was examined at a fixed equivalence ratio
φ
= 0.85. The influence of dilution on the chemiluminescence inten-sitiesfor mixturesdiluted at afixed adiabatic flametemperatureTad=2071K(see Table 2) is now examined. Figure 14 top plots the measured CO2∗ (black triangles), OH∗ (blue circles), andCH∗ (red squares) chemiluminescence intensities as a function of the CO2molefractioninthefuelblend.Resultsarenormalizedbythe value obtainedfortheundilutedflame.Hollowandsolidsymbols standforthechemiluminescenceintensitiesmeasuredbytheICCD cameraandthespectrometer,respectively.
Here again, the OH∗ chemiluminescence intensity decreases regularly withtheCO2 dilutionratio.The OH∗ intensitydrops by approximately40%atXfuel
CO2=0.40.TheCH
∗ emissionintensity re-mains roughly constant even for large CO2 concentrations while the CO2∗ chemiluminescence intensity slightlyincreases with di-lution.Forexample,theCO2∗intensityincreasesbyapproximately 10% at Xfuel
CO2=0.40 with respect to the signal measured for the undilutedflame.ThisweakeffectofdilutionontheCH∗intensity isduetotheincrease oftheequivalenceratio[16] neededto ob-taina dilutedmixturefeaturing thesameadiabaticflame temper-atureasalessdilutedone. Thisslightincreaseoftheequivalence ratiocompensatestheinfluenceofdilution(seeFig.12).Exceptfor CO2∗andlargediluentconcentrations,thesimulations(solidlines) reproducewell measurements (symbols)inFig.14 top.Themean relativedifferencebetweenmeasurementsandsimulationsreaches 6% forOH∗and4%forCH∗.Simulations howeverlargely
overesti-0 10 20 30 40 50 60 0 0.2 0.4 0.6 0.8 1 1.2 1.4 0 10 20 30 40 50 60 0 0.2 0.4 0.6 0.8 1 1.2 1.4 Tad = 2071 K XCO2fuel Diluent is CO2 XN2fuel Diluent is N2
Normalized intensity (a.u)
Normalized intensity (a.u)
ICCD experiments Spectrometer experiments Computations CO2* CH* OH* Tad = 2071 K ICCD experiments Spectrometer experiments Computations CO2* CH* OH*
Fig. 14. Measured (symbols) and computed (lines) normalized chemiluminescence intensities of OH ∗ (blue), CH ∗ (red), and CO
2∗(black) radicals as a function of the
diluent mole fraction in the fuel when dilution is realized at a fixed adiabatic flame temperature T ad = 2071 K . Hollow and solid symbols stand for ICCD camera and
spectrometer measurements, respectively. Diluent is CO 2 (top) or N 2 (bottom). (For
interpretation of the references to color in this figure legend, the reader is referred to the web version of this article.)
matetheincreaseoftheCO2∗ emissionintensity.Becausedilution has herean opposite effectontheOH∗andCO
2∗intensities, cor-rectionoftheOH∗chemiluminescenceintensitybytheCO
2∗ back-groundintensitynowhasalargerinfluenceontheresultsthanfor experimentsconductedatafixedequivalenceratio
φ
=0.85.When N2 is used to dilute the flames, the CO2∗ intensity re-mains roughly constant,theCH∗emission levelslightlyincreases, andtheOH∗intensitydecreaseswhentheconcentrationofN
2 in-creases.However,effectsofN2 dilutionremainalways weak,with variations limitedto±15%forlarge diluentconcentrations. Simu-lations better reproduceexperiments than forCO2-diluted flames witha meanrelative difference reaching 2%,5%, and4% forOH∗, CO2∗, and CH∗, respectively. The detailed chemistry mechanisms forOH∗ andCH∗andthe simplifiedmodelforthe CO
2∗ intensity yield overall good resultswhen dilutionis madeata fixed adia-baticflametemperature.Independentlyoftheexcitedradical con-sidered and the diluent nature, the decay of chemiluminescence intensities observed in Fig. 12 when dilution is made at a con-stant equivalence ratio is attenuated or even canceled-out when the adiabatic flame temperatureis kept constant during dilution (see Fig.14). From that, it is concludedthat the temperature re-duction inducedbydilutionatafixedequivalenceratioisamain contributortothereducedchemiluminescenceintensitiesobserved inFig.12.Aroughanalysisofthereactionpathsleadingtothe for-mation ofexcited radicalsalsopoints inthisdirection. For exam-ple, Eq.(5) showsthat decreasingthe temperaturedecreases the reactionrateoftheoverallreactionproducingCO2∗ chemilumines-cence.Similarly,theconcentrationofCOandOgenerallyincreases withtemperature.
Although the influence ofdilutionwith N2 or CO2 on excited radicals emissionsis studiedhere, onemust be carefulwhen
ap-0 10 20 30 40 50 60 0 0.2 0.4 0.6 0.8 1 1.2 1.4 0 10 20 30 40 50 60 0 0.2 0.4 0.6 0.8 1 1.2 1.4 XCO2fuel XN2fuel
Normalized intensity ratio
Normalized intensity ratio
Diluent is CO2 Diluent is N2 Tad = 2071 K Tad = 2071 K Spectrometer experiments Computations OH*/CH* OH*/CO2* CH*/CO2* Spectrometer experiments Computations CH*/CO2* OH*/CO2* OH*/CH*
Fig. 15. Measured (symbols) and computed (lines) normalized OH ∗/CH ∗ (black),
OH ∗/CO
2∗ (red), and CH ∗/CO 2∗ (blue) intensity ratios as a function of the diluent
mole fraction in the fuel when dilution is realized at a fixed adiabatic flame tem- perature T ad = 2071 K . Diluent is CO 2 (top) or N 2 (bottom). (For interpretation of the
references to color in this figure legend, the reader is referred to the web version of this article.)
plying these resultstosystems such asinternal engines with ex-haust gas recirculation (EGR). Indeed,the fluegases recirculating in such systemsare generallynotcooled to anear ambient tem-perature before injection andare therefore carrying residual en-thalpy.Aftermixingwithreactants,theblendtemperatureislikely to be higher than the temperature withcold diluents, which, as described inthepreviousparagraph,wouldmostprobablybenefit excited radicals emissions.Inaddition,recirculatingexhaustgases containvaporwater,whoseinfluenceonexcitedradicalsemissions isnotstudiedhere.
Taking thesensitivityofchemiluminescence emissionsto tem-peratureatfacevalue,additional1-DFPFsimulationsthataccount for heat-losses through thermal radiation are now conducted. A built-in radiationmodelisusedwithanoptically-thin approxima-tionandthermalradiationfromCO2,H2O,CO,andCH4 speciesis included. Forlarge dilutionratios withCO2,e.g. XfuelCO2=0.35, the peak temperature is reduced by roughly 3% when the radiation model isactivated.In theworst-case scenario,thisleads to a re-duction oflessthan2% ofthepeakandintegratedOH∗,CH∗,and CO2∗ chemiluminescence emissions. Whilenon-negligible, the in-fluence ofradiation lies within experimental uncertainties. Inter-pretation oftheresults presentedinthis studyistherefore inde-pendentofwhetherornotradiationisaccountedfor.
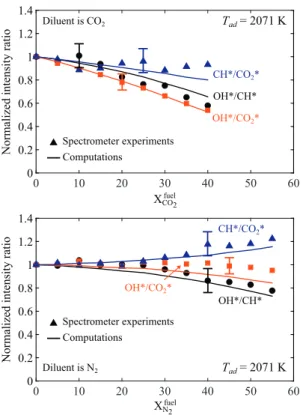
Figure 15 plotsthemeasured OH∗/CH∗(black circle),OH∗/CO 2∗ (red squares), and CH∗/CO
2∗ (blue triangles) intensity ratios asa function ofthediluentmolefractioninthefuelformixtures fea-turingthesameadiabaticflametemperatureTad=2071K.Results are here again presented for CO2-diluted flames at the top and N2-diluted flamesatthebottomandarenormalizedby thevalue obtainedfortheundilutedcase. Asfordilutionatafixed equiva-lence ratio
φ
=0.85,thethreeintensityratiosdecreasewhenthemolefractionofCO2inthefuelincreases.ThemeasuredOH∗/CO2∗ intensityratio drops by morethan 40% for Xfuel
CO2 =0.40. This be-havior is also well reproduced by the simulations. This behavior confirmsthattheOH∗/CO
2∗chemiluminescenceintensityratioisa goodindicator to infer theCO2 diluent concentration. Results for the CH∗/CO
2∗ and OH∗/CH∗ couples feature a lower SNR witha larger dispersion of the measurements. Simulations only capture thegeneraltrendforthesecouples.
Incontrasttodilutionexperimentsconductedatafixed equiv-alenceratio,dilutionby N2 atafixed adiabaticflametemperature hasa slight influence onthe OH∗/CH∗ andCH∗/CO
2∗ chemilumi-nescenceintensityratios.TheOH∗/CO
2∗ratioslightlydecreasesat largeN2 dilutionconcentrations.TheOH∗/CH∗ ratiodrops by ap-proximately20% forXfuel
N2 =0.55andtheCH
∗/CO
2∗ratioincreases bymorethan20%forthesameN2diluentconcentration.These be-haviorsare relativelywell reproducedbythe simulations,butthe sensitivityoftheseintensityratioswithrespecttodilutionremains weak.TheseindicatorscannotbeusedforsensingN2 dilution.
4. Conclusion
A combined experimental and numericalanalysis was carried outtoinvestigatetheOH∗,CH∗,andCO
2∗chemiluminescence sig-nalsinCO2-andN2-dilutedCH4/airlaminarflames.Themain con-clusionsare:
• Formixtures dilutedatafixedequivalence ratio
φ
=0.85,the chemiluminescence intensities from OH∗ near 307 nm, CH∗ near 430nm, and CO2∗ near 455nm regularly decrease with increasingthediluentconcentration.ForN2-dilutedflames,the three signals OH∗,CH∗, andCO2∗ collapseon the samecurve when theyare normalizedbythesignal intensityofthe undi-luted case. For CO2-diluted flames, the decay rate differs be-tween theOH∗,CH∗,andCO
2∗signals.TherelativeOH∗ inten-sitydecreases thefastest,then theCH∗,andthenCO
2∗ signals whentheCO2 concentrationinthefuelblendisincreased. • The Lindstedt detailed chemistry mechanism [49] extended
with sub-mechanisms for the chemistry of OH∗ and CH∗ [26] allows to simulateaccurately effectsof N2 andCO2 dilu-tion on OH∗ andCH∗ concentrations.Agreement between ex-periments and simulations is excellent forOH∗, with relative differencessmallerthan3% andlyingwithin experimental un-certainties, except for dilution with CO2 at a fixed adiabatic flame temperaturewhere relativedifferences reach6%. Differ-encesbetweensimulationsandmeasurementsslightlyincrease forCH∗butagreementremainsgood.
• BecauseCO2∗ismainlyproducedbyareactionbetweenOand COspecies, amodelforthe CO2∗ chemiluminescenceintensity that doesnot account forthecomplexchemistry ofCO2∗ was used in the simulations. Agreement between CO2∗ chemilu-minescenceintensitymeasurements andcalculationswiththis simplified method is overall good. The largest differencesare foundforlargeCO2diluentconcentrationswhenXfuelCO2 >0.30. • Correction fortheCO2∗ backgroundemission barely altersthe
measured signal intensitynear307nm because the contribu-tion of the broadband chemiluminescence fromCO2∗ remains low withinthe10nmbandpass filtercenteredat307nmthat is used to examine the OH∗ emission. Secondly, N
2 and CO2 dilutions havesimilar effectsonOH∗ andCO
2∗ chemilumines-cence signals,reducing the detrimental impact ofcollecting a fraction of light emitted fromCO2∗ when examining the OH∗ signalaround307nm.
• The influence of the CO2∗ background emission needs how-evertobeconsideredwhentheCH∗emissionintensityaround 430 nmisinvestigated.The relativelylow CH∗ signal with