biology
ArticleDevelopmental Control of NRAMP1 (SLC11A1)
Expression in Professional Phagocytes
Mathieu F. M. Cellier
Inrs-Institut Armand-Frappier, 531, Bd des prairies, Laval, QC H7V 1B7, Canada; [email protected]; Tel.: +1-450-687-5010 (ext. 4681)
Academic Editor: Chris O’Callaghan
Received: 20 January 2017; Accepted: 25 April 2017; Published: 3 May 2017
Abstract:NRAMP1 (SLC11A1) is a professional phagocyte membrane importer of divalent metals that contributes to iron recycling at homeostasis and to nutritional immunity against infection. Analyses of data generated by several consortia and additional studies were integrated to hypothesize mechanisms restricting NRAMP1 expression to mature phagocytes. Results from various epigenetic and transcriptomic approaches were collected for mesodermal and hematopoietic cell types and compiled for combined analysis with results of genetic studies associating single nucleotide polymorphisms (SNPs) with variations in NRAMP1 expression (eQTLs). Analyses establish that NRAMP1 is part of an autonomous topologically associated domain delimited by ubiquitous CCCTC-binding factor (CTCF) sites. NRAMP1 locus contains five regulatory regions: a predicted super-enhancer (S-E) key to phagocyte-specific expression; the proximal promoter; two intronic areas, including 30inhibitory elements that restrict expression during development; and a block of upstream sites possibly extending the S-E domain. Also the downstream region adjacent to the 30CTCF locus boundary may regulate expression during hematopoiesis. Mobilization of the locus 14 predicted transcriptional regulatory elements occurs in three steps, beginning with hematopoiesis; at the onset of myelopoiesis and through myelo-monocytic differentiation. Basal expression level in mature phagocytes is further influenced by genetic variation, tissue environment, and in response to infections that induce various epigenetic memories depending on microorganism nature. Constitutively associated transcription factors (TFs) include CCAAT enhancer binding protein beta (C/EBPb), purine rich DNA binding protein (PU.1), early growth response 2 (EGR2) and signal transducer and activator of transcription 1 (STAT1) while hypoxia-inducible factors (HIFs) and interferon regulatory factor 1 (IRF1) may stimulate iron acquisition in pro-inflammatory conditions. Mouse orthologous locus is generally conserved; chromatin patterns typify a de novo myelo-monocytic gene whose expression is tightly controlled by TFs Pu.1, C/ebps and Irf8; Irf3 and nuclear factor NF-kappa-B p 65 subunit (RelA) regulate expression in inflammatory conditions. Functional differences in the determinants identified at these orthologous loci imply that species-specific mechanisms control gene expression.
Keywords: natural resistance-associated macrophage protein (NRAMP); solute carrier family 11 (SLC11); hematopoiesis; professional phagocytes; gene expression; transcription factor; epigenetics; single nucleotide polymorphism; expression quantitative trait locus (eQTL)
1. Introduction
NRAMP1 gene encodes a phagocytosis-related function that is specifically expressed in mature myelo-monocytic cells. It was discovered as a host factor mediating resistance to intracellular pathogens that replicate inside phago-lysosomes in macrophages (MFs) [1]. NRAMP1 is an integral membrane protein catalyzing proton-dependent transport of divalent metal ions, such as iron and
Biology 2017, 6, 28 2 of 55
manganese, out of phago-lysosomes into the cytoplasm; it is also known as SLC11A1 (SLC11 family member 1 [2]). NRAMP1/SLC11A1 activity is thus key to host nutritional immunity by depriving ingested microbes from vital micro-nutrients [3]. In addition, NRAMP1 contributes to MF recycling of divalent metals, notably iron, post-ingestion of apoptotic cells and aged erythrocytes [4,5]. Hence NRAMP1 gene expression is associated with both pro- and anti-inflammatory activities of professional phagocytes. This dual role in nutrition and immunity has ancient origin since proton-dependent metal depletion of phagosomes mediated by NRAMP1 is conserved in the social amoeba Dictyostelium discoideum [6–8].
Analysis of high throughput datasets (mostly from ENCODE consortium [9,10]) depicting DNAse footprinting (DNase 1 hypersentitive sites, DHSs), chromatin immuno-precipitations coupled to deep sequencing (ChIP-seq) and targeting specific histone modifications or RNA polymerase II (RNA Pol II), CCCTC-binding factor (CTCF) and various transcription factors (TFs) interacting with NRAMP1 locus, in both acute myeloid leukemia (AML) cell lines and primary monocytes, allowed us to delineate a ~40 kb regulatory domain insulated by CTCF sites [11]. This postulated regulatory domain comprises several hypothetical determinants, located upstream of or within NRAMP1 gene, which may regulate transcription either positively or negatively depending on the TF involved, the developmental stage of myeloid precursors as well as the immune context and tissue-specific environment later encountered by mature cells. Data analysis confirmed in particular the crucial role previously established for the TF CCAAT enhancer binding protein beta (C/EBPb) at NRAMP1 proximal promoter [12], and further suggested plausible contributions of PU.1 and EGR2 [13].
Integrating data obtained with several cell types that represent various stages of myelopoiesis suggested that sequential mobilization of regulatory elements during the developmental maturation of monocytic and granulocytic cells dictates the specificity of NRAMP1 expression [11]. The purpose of the present analysis is to formulate refined hypotheses that can be tested experimentally to decipher the molecular control of NRAMP1 expression. For this, the most recent high throughput datasets (from NIH Roadmap [14]; EU Blueprint epigenome [15], and RIKEN FANTOM5 [16,17]) obtained using several AMLs and blood cell types were analyzed to further test postulated cell-type specific determinants of NRAMP1 expression and to interpret their possible role in controlling gene transcription, notably in the context of recent advances regarding enhancer function.
Gene expression controlling enhancers may be predicted without knowing the TFs involved by integrating complementary bodies of epigenetic data produced by high throughput experiments. Cell type-specific enhancers are formed by the juxtaposition of several binding sites specific for various TFs (separated by ~20–100 bp). They can act independently of their distance from, and orientation relative to, promoter elements through (inter)chromosomal looping or facilitated tracking [18]. Enhancers may also interact with different transcriptional start sites to elicit alternative gene expression. While inactive enhancers are buried in compact chromatin (heterochromatin), active enhancers lie in regions of lightly packed chromatin (euchromatin) which allows transcription of enhancer RNA (eRNA) [19].
Activation of mammalian enhancers begins with the binding of both lineage-specific TFs and collaborating TFs at neighbor sites still embedded in nucleosomes [20]. Instrumental to this process pioneer TFs (pTFs) can target silent genes locked in chromatin by binding partial or degenerate motifs that are exposed along one face of the DNA while the other face remains interacting with nucleosomal histone octamer. Binding of the pTF does not interfere with constraints imposed on DNA bound to nucleosomes while secondary events involving chromatin remodelling factors lead to subsequent changes in local DNA structure and accessibility [21]. pTFs may directly act as or recruit additional factors acting as master regulators indispensable to specify cell lineage [18,22,23].
Enhancer activation may be initiated in progenitor cells, for example hematopoietic stem cell (HSC) precursors or myeloid progenitors, and proceeds with recruitment of co-regulators such as the Mediator complex, ATP-dependent chromatin remodelling factors and histone acetyltransferases (HAT) which allow nucleosome remodelling to accommodate RNA Pol II binding. HATs such as p300 and CBP (cAMP-response element-binding protein (CREB)-binding protein) may acetylate lysine
residues in the tail of some histones (e.g., histone 3 acetylation at lysine 27: H3K27ac or K27ac), while KAT8/MYST1 may acetylate lysine residue 16 of histone 4 (H4K16ac). Acetylation marks are recognized and bound by bromodomain-containing proteins and positive transcription elongation factor (P-TEFb) complex, which allow the recruiting of general TFs forming the pre-initiation complex as well as RNA Pol II and associated kinases and mixed lineage leukemia proteins (MLL1/3/4) that deposit mono- and di-methylation marks at lysine 4 of histone 3 (H3K4me1/2 [18,22]). Enhancer activation may also include regulation of DNA CpG dinucleotide methylation state, as CpG are bound by various factors either in methylated or unmethylated state, and cytosine methylation can be erased through active and/or passive oxidative steps [24].
The enhancer activation process may be stalled after binding of pioneer TFs, in the absence of further recruitment of additional TF, letting the enhancer in a primed state (showing low activity), or ‘poised’ in case histone deacetylases (HDAC) are recruited, limiting histone acetylation, together with additional histone methylase (e.g., EZH2) that introduce marks which inhibit RNA transcription (e.g., H3K27me3). Then, a novel signal-dependent TF may be recruited to primed or ‘poised’ enhancer and allow the resumption of the activation process: chromatin remodelling will spread to neighboring nucleosomes and ultimately allow transcription of eRNAs and open reading frame (ORF) mRNA. Alternatively, ‘de novo’ enhancers are activated in a single step as both lineage- and signal-dependent TFs are recruited together to trigger RNA Pol II activity [22,25].
One major advance in recent years has been the discovery of eRNAs, indicating that RNA Pol II transcribes not only ORFs and genes encoding regulatory RNAs but also short segments of chromosomal regulatory elements such as enhancers [26–31]. Though the potential function of eRNAs is still not clear, RNA Pol II transcriptional activity at enhancer loci contributes to their functional priming [32] and may precede their labelling with histone methylation marks such as H3K4me1 and H3K4me2 [33,34]. Possible roles of eRNAs include acting as decoy molecules to release the negative elongation factor from paused RNA Pol II [18] or as low affinity binding sites tethering certain TFs at gene regulatory sites to favor stable gene expression (e.g., YY1 and CTCF) [35].
In general, enhancers display tissue-specific transcription and eRNA transcripts prominently contribute to enhancer-mediated activation of tissue-specific gene expression programs [36]. In particular, knock-down of IL1b eRNAs in human monocytic cells attenuates both lipopolysaccharide (LPS)-induced production of IL1b and CXCL8 mRNAs and subsequent release of the corresponding mediators, indicating that expression and release of proinflammatory cytokines is indeed regulated by nuclear-located non-coding transcripts [37]. Given the plasticity of mononuclear phagocyte developmental programs and the polarizability of mature cell phenotypes it is anticipated that characterizing the enhancer repertoire of MF populations will help defining the molecular basis of their phenotypic diversity [38].
A subset of remarkable enhancers also has recently emerged that were denominated super-enhancers (S-Es) because they apparently control mammalian cell identity and disease [39,40]. S-Es were defined by demonstrating that the master TFs which control embryonic stem cells (ESC) pluripotent state do so by activating unusually large regulatory domains at loci implicated in maintenance of the pluripotent state. Similarly, in differentiated cells, S-Es were evidenced at genes that control cell functional identity by showing S-Es bind multiple cell-type specific master TFs. In contrast, S-Es were not found at house-keeping genes [39]. S-Es constitute relatively dense TF-binding platforms formed by clustered enhancers that bind specific pioneer regulators; by sensing pTFs abundance S-Es may conduct dynamic chromatin modelling and integrate developmental regulation of cell-type-specific loci [41].
Several properties distinguish S-Es from common enhancers by an order of magnitude: S-Es are larger (mean size ~8.7 kb vs. ~700 bp); ChIP-seq analyses indicated S-Es display higher levels of histone marks of activation such as H3K4me1 and H3K27ac; also, they bind larger amount of the Mediator complex (Med1 component), which couples physically active enhancers and promoters, and knockdown of Med12 component preferentially affected the expression of genes governed by
Biology 2017, 6, 28 4 of 55
S-Es [39]. It was also observed that binding of PU.1 and Med at enhancers are highly correlated in pro-B cells, and in MFs, C/EBPa binds large domains comprising clusters of enhancers [39]. Lastly, S-Es act as regulatory hubs (RHs) that coordinate eRNA and target gene transcription; S-Es are highly responsive to external signals because they bind TFs that are terminal effectors of signalling pathways (e.g., SMAD3 for TGFb pathway and NFKB p65 for TLR4 signalling [42,43]).
S-E functional properties may be relevant to NRAMP1 transcriptional control because several candidate enhancers bind both PU.1 and C/EBPb, and some of them form a large domain upstream of NRAMP1 [11,13]. In addition, MF S-Es were associated with genes encoding activities which are critical to cell-type specific functions such as wound response, membrane organization and invagination, endocytosis, immune and inflammatory responses [39]. Given that NRAMP1 exerts a cardinal function of professional phagocytes (depletion of the phagosome lumen from vital transition metals such as Fe2+, Mn2+and Co2+) and since its expression is developmentally controlled during myelopoiesis, and further regulated by infectious and inflammatory signals, it seems possible that an S-E domain controls NRAMP1 transcription.
Because active enhancers (including S-Es) overlap with RNA Pol II bound regions and display (bidirectional) elongation of eRNAs, evaluating the transcriptional status of potential regulatory elements previously delineated at NRAMP1 locus should inform on regulation of gene expression. Cap analysis of gene expression (CAGE) was thus examined along NRAMP1 locus to seek functional evidence that would support postulated enhancer determinants, and to study their activity level in human blood cell types.
In addition, single cell analyses revealed that H3K27ac can regulate downstream transcription kinetics by favoring TF recruitment and accelerating RNA Pol II promoter escape, i.e., transition from initiation toward elongation of transcription [44]. In contrast, inhibiting transcript elongation blocks ligand-induced H3K9ac but not H3K27ac [45]. Deposition of these histone marks at NRAMP1 locus was thus re-examined together with that of H3K4me3, another transcription-dependent mark and one of the most frequently associated with a combinatorial ‘histone code’ for enhancer transcriptional activity [46], to determine how they may correlate with RNA transcription (CAGE) data.
To further document potential activity of the candidate enhancers studied, local distribution of selected histone marks was compared with the location of DHSs and transcriptionally active sites [47] in way to distinguish between primed or active states; the status of CpG dinucleotide methylation and the distribution of predicted TFs binding sites (TFBS) were also monitored as complementary properties. Altogether, available data regarding NRAMP1 locus in various cell-types were integrated using the UCSC genome browser [48] to consolidate functional hypotheses regarding the developmental control of NRAMP1 transcription.
Four possible classes of regulatory elements [49] were used as a guide: (i) active transcriptional regulatory elements, which correspond to DHS and are flanked by active histone marks (e.g., H3K27ac and H3K9ac) while the central area is largely nucleosome-free and may bind high density of TFs; (ii) transcriptionally inactive ‘open’ regulatory elements (DHS with active histone marks, e.g., H3K27ac and H3K4me1), where only the central nucleosome is displaced and few TFs bind; (iii) marked potential regulatory elements showing limited histone marking (e.g., H3K4me1) and (iv) insulator and regulatory sites, bound by CTCF, RAD21 and/or SMC3 and corresponding to DHS.
Because Fe metabolism is key to MF function, the transcriptional/regulatory status of other genes known to participate in MF Fe metabolism was also examined. A summary is provided to describe loci carrying genes that display expression in blood cells relatively similar to NRAMP1. This set includes genes that exhibit tissue-specific expression profile similar to NRAMP1, as indicated by GTEx datasets [50] i.e., high expression levels in vivo in blood and/or lung, spleen, and which encode functions that contribute to iron (including heme) acquisition, iron storage and lysosomal recycling. A fraction of these exhibit candidate S-Es that may enable coordinated regulation of MF iron genes.
Lastly, to evaluate whether NRAMP1 epigenetic regulation is conserved, the expression of the mouse orthologous gene Nramp1 was examined during embryogenesis and organognesis; activation of Nramp1 locus was studied during hematopoiesis, both primitive and definitive, and compared
between cells either explanted or cultured in vitro. Also an inventory was made for the TFs interacting with Nramp1 candidate regulatory elements in various cell types. These analyses revealed that both the myelo-monocytic specificity and timing of expression during myeloid differentiation are common to Nramp1 and NRAMP1 orthologs, as well as involvement of master TFs such as Pu.1 and C/ebps. However, the candidate regulatory elements identified and their pattern of mobilization appeared divergent between mammalian species.
2. Results and Discussion
2.1. Functional Delineation of NRAMP1 Locus by CTCF Sites
It has been proposed that NRAMP1 locus spans a chromosome 2 segment of ~40 kb, delimited by two strong CTCF binding sites [11] that were previously revealed by ChIP-seq analyses in several cell types [9,10]. One CTCF site would mark the locus 50boundary upstream of CATIP gene while the other lies at NRAMP1 30 UTR (sites E and A, respectively, Figure1), implying these sites may act as insulator elements. Yet, widening UCSC genome browser window [48] shows that NRAMP1 locus represents the 30end of a larger ensemble (chr2:219,075,000-219,280,000). This extended domain (205 kb) is characterized by similar patterns of DHS that indicate myeloid gene expression; blocks of co-localizing H3K27ac/H3K4me1 marks, distribution of PU.1 binding sites, as well as relatively similar decoration with histone marks of transcriptional activity (Figure S1A).
Biology 2017, 6, 28 5 of 55
interacting with Nramp1 candidate regulatory elements in various cell types. These analyses revealed that both the myelo-monocytic specificity and timing of expression during myeloid differentiation are common to Nramp1 and NRAMP1 orthologs, as well as involvement of master TFs such as Pu.1 and C/ebps. However, the candidate regulatory elements identified and their pattern of mobilization appeared divergent between mammalian species.
2. Results and Discussion
2.1. Functional Delineation of NRAMP1 Locus by CTCF Sites
It has been proposed that NRAMP1 locus spans a chromosome 2 segment of ~40 kb, delimited by two strong CTCF binding sites [11] that were previously revealed by ChIP-seq analyses in several cell types [9,10]. One CTCF site would mark the locus 5′ boundary upstream of CATIP gene while the other lies at NRAMP1 3′ UTR (sites E and A, respectively, Figure 1), implying these sites may act as insulator elements. Yet, widening UCSC genome browser window [48] shows that NRAMP1 locus represents the 3′ end of a larger ensemble (chr2:219,075,000-219,280,000). This extended domain (205 kb) is characterized by similar patterns of DHS that indicate myeloid gene expression; blocks of co-localizing H3K27ac/H3K4me1 marks, distribution of PU.1 binding sites, as well as relatively similar decoration with histone marks of transcriptional activity (Figure S1A).
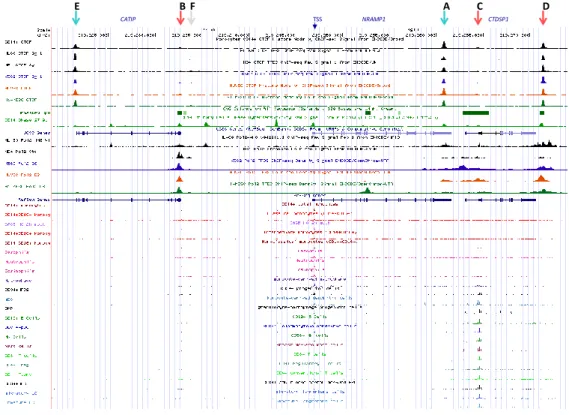
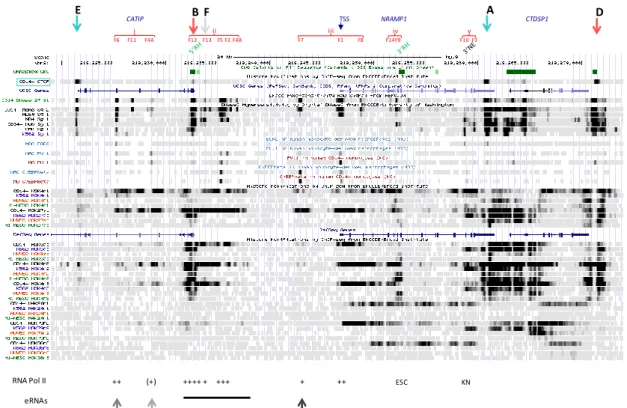
Figure 1. CAGE at NRAMP1 locus in blood cell types. From top to bottom: CTCF sites are shown by
arrows (red, forward orientation; blue, reverse orientation; grey, undetermined), including NRAMP1 locus boundaries (sites A and E), and NRAMP1 TSS as well as surrounding genes are indicated; chromosome 2 scale; CTCF ChIP-seq data for CD14+ monocytes (MNs), acute promyelocytic
leukemia HL-60 and NB4, erythroleukemia K562, human umbilical vein epithelial cells (HUVEC) and embryonic stem cells (ESC; data from ENCODE consortium [9,10]); CpG islands; DNAse1 footprints: hypersensitive sites (DHS) in CD14+ MNs (ENCODE) [9,10]; UCSC browser genes; RNA
Pol II ChIP-seq data for HL-60, NB4, K562, HUVEC and ESC (ENCODE); RefSeq genes; CAGE data [16,17] for 22 blood cell types.
NRAMP1
CATIP TSS CTDSP1
E B F A C D
Figure 1. CAGE at NRAMP1 locus in blood cell types. From top to bottom: CTCF sites are shown by arrows (red, forward orientation; blue, reverse orientation; grey, undetermined), including NRAMP1 locus boundaries (sites A and E), and NRAMP1 TSS as well as surrounding genes are indicated; chromosome 2 scale; CTCF ChIP-seq data for CD14+monocytes (MNs), acute promyelocytic leukemia HL-60 and NB4, erythroleukemia K562, human umbilical vein epithelial cells (HUVEC) and embryonic stem cells (ESC; data from ENCODE consortium [9,10]); CpG islands; DNAse1 footprints: hypersensitive sites (DHS) in CD14+MNs (ENCODE) [9,10]; UCSC browser genes; RNA Pol II ChIP-seq data for HL-60, NB4, K562, HUVEC and ESC (ENCODE); RefSeq genes; CAGE data [16,17] for 22 blood cell types.
Biology 2017, 6, 28 6 of 55
Could this 205 kb region constitute a larger regulatory domain that controls gene expression or alternatively, do NRAMP1 flanking CTCF sites function as bona fide insulating boundaries?
Three lines of evidence argue that NRAMP1 ~40 kb locus likely represents an autonomous regulatory domain: (i) transcription data reveal NRAMP1 is the sole gene that shows strictly myelo-monocytic specific expression (Figure S1B); (ii) ENCODE data for chromatin interaction analysis by paired-end tag sequencing (ChIA-PET) [51,52], obtained for both K562 megakaryocytic cells and MCF-7 epithelial cells [53], indicate similar chromatin loops that suggest insulation of NRAMP1 locus by its flanking CTCF sites (Figure S1B,C); and (iii) single nucleotide polymorphisms (SNPs) that were identified at genome-wide significance as potential quantitative trait loci affecting NRAMP1 expression in cis (cis eQTLs) reveal a possible regulatory influence of the areas carrying CTCF sites E and A (Figure S1D) [54].
Genome organization in topological domains relies on CTCF binding to sites that influence transcription either by facilitating spatial clustering of distal DNA elements, such as enhancer-promoter contacts, or by insulating distal elements away from non-target genes to prevent unwanted contacts [55,56]. A loop extrusion model has been proposed to explain the orientation bias seen in CTCF-mediated looping [57–60]: CTCF binding bends DNA, favoring loop formation in one direction so that parallel interactions between an upstream forward (F) and a downstream reverse (R) motif are generally observed. CTCF-mediated looping may then be expanded by the action of cohesin and/or transcriptional machinery allowing additional interactions with additional CTCF binding sites and/or other DNA elements.
NRAMP1 locus shows six CTCF sites (A–F) which include, based on binding strength, three major (A, D, E) and three minor sites (B, C, F; Figure1). Based on published CTCF consensus sequences [61–63] sites A and E are in reverse orientation while sites B-D are oriented forwardly, and site F is undetermined (Figure 1 and Figure S1C). Current model of asymmetric loop formation [57,58,60] predicts that CTCF sites displaying “R” orientation (sites E and A, Figure1) may anchor loops that extend to upstream “F” CTCF sites. Such loops may either allow interactions between functional determinants that control NRAMP1 expression (e.g., interaction of sites A and B) or insulate NRAMP1 locus from upstream determinants that control other genes (e.g., loop(s) involving site E). In addition, NRAMP1 CTCF sites in “F” orientation (e.g., C or D) may be part of loops directed by downstream CTCF sites, which would contribute to insulate NRAMP1 as well.
To investigate NRAMP1 CTCF looping pattern ChIA-PET data derived from K562 and MCF-7 cells were examined. The results appeared consistent between both cell types. Hence, site D, which is the most downstream “F” site, was found in loops involving further downstream areas, each comprising a CTCF site in “R” orientation (chr2:219,330,316-479 (K562)/219,330,530-1,339 (MCF7) and 219,512,425-946 (K562); indicated as sites 331 and 513, respectively, Figure S1B,C). Regarding the “R” sites A, located within NRAMP1 30 UTR, and E, forming the locus 50 boundary, both are part of loops connecting further upstream areas that carry an “F” site (219,156,895-7,776 (K562); 219,136,806-8,047 (K562)/219,137,148-8,025 (MCF7); 219,165,729-6,647 (K562)/219,165,757-6,700 (MCF7) and 219,165,724-6,789 (K562)/219,165,749-6,710 (MCF7); 219,137,780-8,521 (K562)/219,136,040-8,028 (MCF7)), respectively (indicated as sites 137, 157, 166, Figure S1). Because similar loops were observed both in K562 and MCF-7 cells, it seems plausible similar domains are also formed in myelo-monocytic cells to insulate NRAMP1 40 kb locus.
ChIA-PET data in myeloid K562 cells showed that CTCF site E preferentially interacts with upstream site 166 (score 800) whereas CTCF site A favors looping with site 157 (score 500). Both sites A and E may also interact with alternate sites, respectively 157 and 166, showing reduced scores (400 and 200). Accordingly, it is possible to envision formation of one large loop (site 157-CTCF site A), which would include a smaller one (site 166-CTCF site E) insulating the upstream gene PNKD (Figure S1A,B). The chromosome segment separating sites 157 and 166 contains no gene or transcriptionally active area. Accordingly, the ~40 kb interval delineated by CTCF sites E and A may comprise all the regulatory elements required to control NRAMP1 expression.
The potential role of CTCF sites A and E in the regulation of NRAMP1 expression is further underscored by candidate eQTLs found in both areas in whole genome association studies (Figure S1D). Hence, genetic evidence in line with epigenetic data imply CTCF sites E and A insulate NRAMP1 locus, and suggest an important regulatory role of its 30boundary (Figure S1B–D).
2.2. Regulatory Determinants Identified by Cap Analysis of NRAMP1 Expression
CAGE reveals transcription patterns based on 50end-derived sequence tags obtained by adding a linker to the 50 end of cDNAs followed by Nextgen sequencing [64]. As human gene promoters may display intrinsic directional bias [17,65–67] enhancers show non-overlapping bidirectional transcription, and CAGE enables to identify both types of regulatory elements [16,68]. In addition, using transcriptional activation to detect regulatory elements allowed to identify the majority of sites that control gene expression [49].
2.2.1. BloodCAGE (TrackHub CAGE of Haematopoietic Cell Types)
CAGE of human blood cell types allows us to compare NRAMP1 locus transcriptional activity between divergent lineages whose development controls gene expression. Data compiled for the 39.5 kb interval insulated by CTCF sites A and E indicate different transcriptional signatures based on the relative intensity of NRAMP1 (SLC11A1) transcriptional start sites (TSS) compared to the downstream gene CTDSP1 TSS, while C2Orf62/CATIP gene, situated upstream of NRAMP1, is not expressed in the cell types tested (Figure1and Figure S2A).
CTDSP1 encodes a class 2C phosphatase whose preferred substrate is RNA Pol II phosphorylated by TFIIH; CTDSP1 activity is required to initiate transcription and it is ubiquitously expressed [69–71]. Accordingly, BloodCAGE shows CTDSP1 transcription level is relatively constant, varying about 2.5 fold among the cell types tested.
In contrast, NRAMP1 transcription varies over two orders of magnitude and consequently, CTDSP1 transcription appears negligible in cells expressing NRAMP1 at high level. Three transcriptional signatures were observed: NRAMP1 TSS is the most intense signal indicated by CAGE tag clustering; CTDSP1 TSS appears sole hugely marked by CAGE tags; both NRAMP1 and CTDSP1 TSSs display similar CAGE tag clusters (Figure1and Figure S2A).
2.2.1.1. NRAMP1 Expressing Blood Cells
Herein, CAGE tags cover both NRAMP1 ORF and the following gene (CTDSP1); they also mark additional DNA segments upstream of NRAMP1, some of which lie within C2Orf62/CATIP and were previously identified as potential enhancing elements based on specific chromatin marks (K9ac/27ac, K4me1/2/3), DHSs and TF binding (e.g., RNA Pol II, PU.1, C/EBPb, EGR2) [11]. In fact, large scale genomic data previously revealed that a majority (58%) of DHSs reside within transcription units (intronic DHSs), and some of them have been shown to regulate nearby genes in hematopoietic lineages [72]. C2Orf62/CATIP is strongly expressed in testis [73]; it is thus predicted that candidate myelo-monocytic enhancers embedded in C2Orf62/CATIP constitute bona fide determinants of NRAMP1 expression.
NRAMP1 expressing cell-types are professional phagocytes; ranked by decreasing level of transcription, they include: CD14+ CD16− monocytes (MNs), CD14+CD16+MNs, CD14−CD16+ MNs, neutrophils, basophils, eosinophils, and MN-derived MFs (MDMs; Figure1) [68]. These data are consistent with previous analyses that indicated blood neutrophils, MNs and alveolar MFs as the cell types showing high level of NRAMP1 mRNA [74].
2.2.1.2. Blood Cells Not Expressing NRAMP1
In these cell types, capped transcription tags span an interval beginning at the 30end of NRAMP1 and covering CTDSP1 downstream ORF. CAGE tags also mark a small area situated at the end of CATIP (Figure1and Figure S2A). NRAMP1 negative blood cell types include mast cells (MCs), some
Biology 2017, 6, 28 8 of 55
CD34+hematopoietic progenitors, CD8+T cells, CD4+regulator T cells, conventional CD4 T cells, immature and migratory Langerhans cells (LCs).
2.2.1.3. Blood Cells Expressing NRAMP1 at Intermediate Levels
In this case, CTDSP1 TSS is marked more intensely than NRAMP1 TSS, except for some (other samples of) CD34+hematopoietic progenitors. Transcription tags appear scattered along both genes and at some predicted upstream enhancer elements (Figure1, Figure S2A). These cell types include MN-derived dendritic cells (MDDCs), granulocyte-MF progenitor (GMP) cells, CD19+B cells, BDCA4+ plasmacytoid dendritic cells and CD56+natural killer cells.
In MDDCs, CD34+progenitors, MCs and in a pool of AMLs samples another cluster of CAGE tags maps at the 30end of NRAMP1, within intron 12 and immediately preceding exon XIII (Figure S2A,B). This area also binds RNA Pol II in model megakaryocytic-erythrocytic progenitors (MEP) (K-562, erythroleukemia; CMK megakaryoblast); in precursors of phagocytes such as NB4 cells, and to lesser extent in HL-60 cells. It also corresponds to a DNAse footprint (F10) in myeloid cell types apparently not expressing NRAMP1 (either at appreciable level: G-CSF mobilized CD34+progenitors (mCD34) or not at all: MEP and (acute promyelocytic leukemia, APL) NB4 cells; Figure S2).
Co-detection of bound RNA Pol II and CAGE tags at the 30end of NRAMP1 ORF in cells expressing little or no mRNA thus indicate an active element that may impact gene expression negatively. Because intragenic enhancers can act as alternative TSS, producing low protein-coding potential RNAs [75], and since NRAMP1 intron 12 CAGE tags map on the forward strand (Figure S2A), F10 element may thus represent an alternative 30TSS antagonizing full-length gene expression in some myeloid cell types (e.g., erythrocytic, DC and MC lineages).
BloodCAGE data [68] analysis indicates high level NRAMP1 transcriptional activity specifically in microbicidal phagocytes, in accordance with phagocytosis-related roles of NRAMP1 [76,77]. BloodCAGE data also show NRAMP1 locus carries both positive and negative determinants that may be mobilized sequentially or alternatively depending on myeloid fates.
2.2.2. NRAMP1 CAGE in AML Cells
Detailing NRAMP1 transcription status in cell lines representing various stages of myelo-monocytic progenitors confirms the presence of a negative determinant at the gene 30end. 2.2.2.1. An Alternative NRAMP1 TSS in AMLs?
The main cluster of CAGE tags detected at NRAMP1 locus in a pool of 21 cell lines maps on the forward strand at the putative “30alternate TSS”/negative determinant that precedes exon XIII (Figure S2). One cell line accounts for most tags per million (tpm) detected at this site (EEB, 90 tpm) but more than three tpm were also reported in six other cell lines (F-36P, 17.6 tpm; THP-1, 12.5 tpm; P31/FUJ, 7.1 tpm; MKPL-1, 4.8 tpm; F-36E, 4.6 tpm; M-MOK, 3.6 tpm) [68].
Comparing tpm counts at NRAMP1 50 and “30 alternative” TSS and at CTDSP1 TSS in CD14+CD16−MNs (61.7/0.05/3.1 tpm, respectively), CD34+progenitors (4.9/0.3/2.9 tpm), MDDCs (1.4/1.9/3.1 tpm), AMLs (0.2/0.5/2.4 tpm) and MCs (0.03/0.2/4.8 tpm) shows some inverse relationship between NRAMP1 50and “30 alternative” TSSs. One possible interpretation suggests antagonism between these “alternative” TSSs due to negative activity of intron 12 DHS F10.
Interestingly, the 30portion of the CAGE tag cluster mapping to NRAMP1 intron 12 is adjacent to the poly-pyrimidine stretch of the intron 30junction; it shows strong conservation among simians (e.g., 100% identity with various species of Old World monkeys). This conserved area also overlaps a potential binding site for TF JunD/AP1 (located in the middle of a JunD ChIP-seq segment obtained in K562 cells, Figure S2B) [9,10].
Other ChIP-seq data from K562 cells indicate several possible binding sites for C/EBPs downstream of F10 putative regulatory element, which span the end of intron 12 and beginning of exon XIII [78]. Additional binding sites predicted from K562 ChIP-seq data lie more upstream, at
the beginning of the CAGE tag cluster: one is specific for a MYC-associated zinc finger (MAZ) and another for MYC-MAX (MYC-associated factor X) complex (found in both K562 and NB4 cells).
Two other sites preceding the most upstream CAGE tags may bind EGR1 and ELF1 (Figure S2B). Each site constitutes a central motif in DNAse footprints obtained from CMP (mCD34), MEPs (CMK and K562 cells) or myelo-monocytic cells (CD14+MNs, HL-60 and NB4). Both EGR1 and ELF1 can exert positive or negative regulatory effects on target gene expression in various myeloid lineages [79–91] so that either factor might inhibit full-length transcription of NRAMP1 in non-expressing cells (see Section2.3.1.6). Lastly, transcriptional activity at DHS F10 was independently reported in K562 cells [49] thus supporting a regulatory role of this element in myeloid cells.
2.2.2.2. Correlating CAGE Signals and Other Marks of NRAMP1 Expression in Myeloid Leukemias Detailed examination of the elements depicted in Figure S2B is provided as Supplementary Text, [92–94]. In summary, CAGE tag clustering, histone acetylation marks and gene expression levels in K562 erythrocytic and THP1 monocyte-like cells support the presence of a negative determinant in NRAMP1 intron 12. Activation of this element in progenitors of professional phagocytes (e.g., mCD34 cells/CMPs, MEPs and the APL NB4), and in blood cells derived from them by either undergoing divergent developmental pathway (e.g., MCs) or following subsequent differentiation (e.g., MDDCs), may restrict expression of full-length NRAMP1.
2.2.3. Sites Showing Bidirectional CAGE Signals in NRAMP1 Expressing Cells
As occurrence of low abundance, non-overlapping, bidirectional and divergent tag clusters on opposite DNA strands identifies enhancers in human cells [31,68], detecting such features in professional phagocytes can validate potential enhancer elements previously predicted in myelo-monocytic progenitors and MNs based on specific DNAse footprints, functional histone modifications and interactions with various TFs [11].
Myeloidome CAGE data thus support several determinants of NRAMP1 expression previously suggested by ENCODE epigenetic data for various cell types corresponding to distinct stages of myelopoiesis, including (i) G-CSF mobilized CD34+hematopoietic stem progenitor cells (HSPC) that correspond to common myeloid progenitors (CMP; mCD34); (ii) cell lines regarded as proxies to various downstream myeloid progenitors, such as CMK (megakaryoblast), K562 (erythroleukemia), HL-60 (promyelocytic acute myeloid leukemia, AML) and NB4 APL and iii) CD14+MNs [11].
CAGE may also suggest candidate determinants not previously described, and additional cell types were considered in the present study to examine the specificity of potential regulatory determinants, including (i) non-hematopoietic cell types such as ESC (capable of multi-lineage differentiation) and human umbilical vein endothelial cells (HUVEC, a mesodermal cell type) and ii) various hematopoietic cell types, including: CD133+ HSC, CD34+ HSPCs, MDMs and CD15+ polymorphonuclear neutrophils (PMN).
Inspection of bidirectional CAGE clusters (center±250 bp) [68] at NRAMP1 locus indicates potential enhancers with different structures: three of them, located upstream of the gene, form part of an ensemble that resembles a super-enhancer (S-E) while the fourth cluster, closer to NRAMP1 TSS, may rather represent a classical enhancer.
2.2.3.1. Upstream Ubiquitous Regulatory Hub (DHS F12)
This CAGE cluster, found in all blood cell types albeit with variable intensity, is situated in the untranslated part of CATIP last exon [68]; it binds massive amounts of RNA Pol II even in non-hematopoietic cells (e.g., ESC and HUVEC; Figure1, Figure S3). This element also coincides with a CpG island, a remarkable property since enhancers are usually CpG poor [18]. DHS F12 also corresponds to CTCF site B (Figure1).
Modest peaks of K27ac and K4me3 marks decorate DHS F12 in different tissues in absence of NRAMP1 expression [14] (Figures S3 and S12). Accordingly, this element might act as a RH influencing
Biology 2017, 6, 28 10 of 55
gene expression. Mobilization of DHS F12 in various lineages (together with a relatively similar intronic element, DHS F9, cf. Section2.3.1.5), may explain at least partly why NRAMP1 locus generally appears devoid of inhibitory histone marks, such as K9me3 and K27me3 (Figure S8).
F12 site is marked with similar histone 3 modifications in both CD14+MNs and K562 cells [14,15], notably K9ac, K4me2 and K4me3; it is also flanked in 50 with K79me2 (Figure2A). Both ESC and HUVEC also display significant K4me2/3 and K9ac marks thus implying broad activity of this site, demonstrated by transcriptional activity in non-hematopoietic cells [49]. Most histone decorations surround F12 DHS, suggesting it may accommodate a combination of TFs; predicted TF binding sites (TFBS) include some for ETS factors, CREB, NF-KB, SP1, IRF and a potential pTF, FOXO1.
DNAse footprints show higher accessibility in myelo-monocytic precursors (mCD34 cells; HL-60 and NB4 cells), terminally differentiated cells (CD14+MNs) and megakaryotcytic progenitors (CMK cells) compared to K562 erythrocytic precursors (Figure2A). In contrast, K562 cells display predominant CTCF binding (Figure 2B) and association with various TFs as well as chromatin remodelling factors [78] that exert methyltransferase, demethylase, HAT, or chromatin modifying or reading activities, and with members of the pre-initiation complex (Figure S9).
The area spanning F12 site is globally unmethylated (Figure2B) [14,15,95–97], hence compatible with CTCF binding [98] in all cell types studied, including HSC (Figure2B). Thus F12 site is broadly accessible and it supports gene expression in hematopoietic cells.
Lastly in MDM (using M-CSF), F12 element appeared constitutively bound by STAT1, an association that was little affected by IFN-g priming and/or further stimulation with LPS [99] (Figure S10). Potential interaction with IRF1 was also noted. F12 element thus seems to principally regulate NRAMP1 expression in basal conditions.
2.2.3.2. Intermediate Cluster of Myeloid-Specific TF Binding Sites (DHS F13)
CAGE data at DHS F13 show transcription mostly restricted to myeloid cell types, including MNs, granulocytes (GNs) and some CD34+HSPCs; RNA Pol II activity was also detected in MC though these cells do not express NRAMP1 [68] (Figure S3).
Biology 2017, 6, 28 10 of 55
and HUVEC also display significant K4me2/3 and K9ac marks thus implying broad activity of this site, demonstrated by transcriptional activity in non-hematopoietic cells [49]. Most histone decorations surround F12 DHS, suggesting it may accommodate a combination of TFs; predicted TF binding sites (TFBS) include some for ETS factors, CREB, NF-KB, SP1, IRF and a potential pTF, FOXO1.
DNAse footprints show higher accessibility in myelo-monocytic precursors (mCD34 cells; HL-60 and NB4 cells), terminally differentiated cells (CD14+ MNs) and megakaryotcytic progenitors
(CMK cells) compared to K562 erythrocytic precursors (Figure 2A). In contrast, K562 cells display predominant CTCF binding (Figure 2B) and association with various TFs as well as chromatin remodelling factors [78] that exert methyltransferase, demethylase, HAT, or chromatin modifying or reading activities, and with members of the pre-initiation complex (Figure S9).
The area spanning F12 site is globally unmethylated (Figure 2B) [14,15,95–97], hence compatible with CTCF binding [98] in all cell types studied, including HSC (Figure 2B). Thus F12 site is broadly accessible and it supports gene expression in hematopoietic cells.
Lastly in MDM (using M-CSF), F12 element appeared constitutively bound by STAT1, an association that was little affected by IFN-g priming and/or further stimulation with LPS [99] (Figure S10). Potential interaction with IRF1 was also noted. F12 element thus seems to principally regulate NRAMP1 expression in basal conditions.
2.2.3.2. Intermediate Cluster of Myeloid-Specific TF Binding Sites (DHS F13)
CAGE data at DHS F13 show transcription mostly restricted to myeloid cell types, including MNs, granulocytes (GNs) and some CD34+ HSPCs; RNA Pol II activity was also detected in MC
though these cells do not express NRAMP1 [68] (Figure S3).
DNAse footprinting shows two major accessible sites in CD14+ MNs and two bording them but
less apparent. The two first sites are more accessible in NB4 cells than in HL-60 and mCD34 cells, implying myelo-monocytic regulation (Figure 2A). These sites bind RNA Pol II strongly in NB4 cells, and more weakly in HL-60 and K562 cells as well as ESC (Figure S3).
In K562, NB4 and ESC the F13 area interacts with CTCF (Figure S3; corresponds to site F, Figure 1) as well as some cohesin subunits (in HepG2 cells); it binds few TFs (GABP, PU.1) in HSPCs or MYC-MAX in NB4 cells [78] (Figure S9). Interactions with both CTCF and hematopoietic TFs thus imply lineage-specific regulatory roles for this cluster of DHS.
F12 F13 F5 F2 F4B
A
Biology 2017, 6, 28 11 of 55
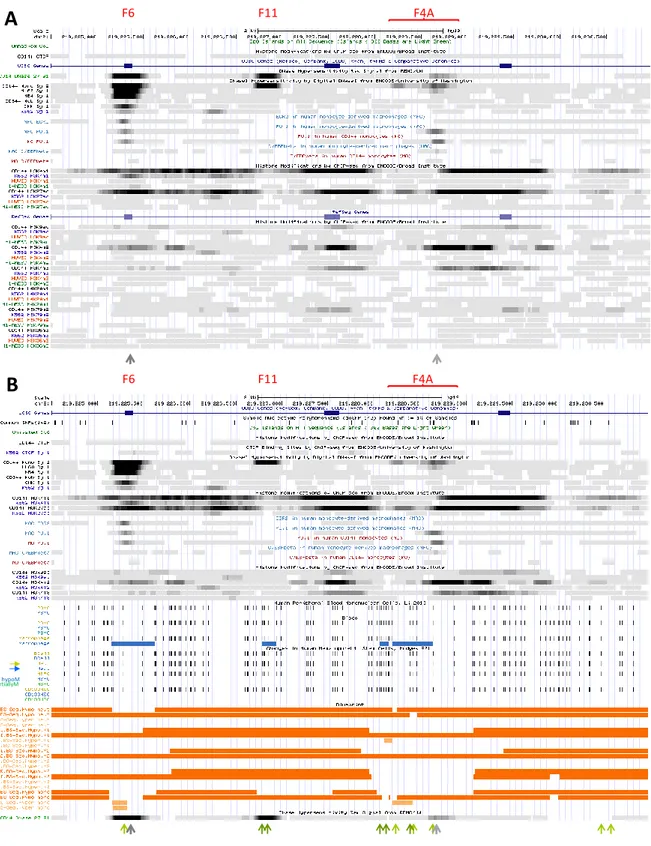
Figure 2. Epigenetic modifications at NRAMP1 locus region ii, encompassing Dnase1 footprints
F12/RH, F13, F5 and F2, and F4B (described in text sections: 2.2.3.1, 2.2.3.2, 2.2.3.3 and 2.3.2.4, respectively) part of a candidate super-enhancer domain (data from ENCODE consortium [9,10,78] or stated otherwise). (A) From top to bottom: chromosome 2 scale; CpG islands; CTCF sites in CD14+
MNs; UCSC gene descriptions; DNAse1 footprints in CD14+ MNs, HL-60, NB4, mCD34, CMK and
K562 cells; EGR2, PU.1 and C/EBPb ChIP-seq data from MNs (MO) and MFs (MAC) [13]; H3K4me1 and H3K27ac ChIP-seq data from CD14+ MNs, K562 cells, HUVEC and ESC; RefSeq genes; H3K9ac,
H3K4me2, H3K4me3, H4K20me1, H3K79me2 and H3K36me3 ChIP-seq data from CD14+ MNs, K562
cells, HUVEC and ESC; Black/grey symbols indicate location and intensity of CAGE signals detected in myeloid cells (cf. Figure 1, [68]). (B) From top to bottom: chromosome 2 scale; UCSC genes; common SNPs; CpG islands; CTCF ChIP-seq data for CD14+ MNs and K562 cells; DNAse1 footprints
in CD14+ MNs, HL-60, NB4, mCD34, CMK and K562 cells; H3K4me1 and H3K27ac ChIP-seq data
from CD14+ MNs, K562 cells; EGR2, PU.1 and C/EBPb ChIP-seq data from MO and MAC; H3K9ac,
H3K4me2, H3K4me3 ChIP-seq data from CD14+ MNs and K562 cells; CpG hypomethylation data
from PBMCs, MFs, B cells, Neutrophils, CD34+ HSPCs and CD133+ HSCs, as well as select Blueprint
data (Neutrophils; M1, M2 and M0 MFs; monocytes) [14,15]; DNAse1 footprints in CD14+ MNs;
Black/grey symbols indicate location and intensity of CAGE signals (cf. Figure 1); Green symbols highlight hypomethylated areas in MFs, neutrophils and/or CD34+ HSPCs.
Histone marking at F13 is specific of myelo-monocytic cells and absent in K562 erythrocytic precursors (Figure 2A). Both K9ac and K27ac strongly mark the area in CD14+ MNs, as well as
K4me1/2/3 (vs. traces of K79me2; Figure 2A). Nucleosome density suggests focal TF binding in CD14+ MNs while predicted BS include C/EBP, FOX, SP and IRF factors.
DNA hypomethylation at the two first sites shows differences between MFs and peripheral blood cell types (PMNs, CD34+ HSPCs) vs. CD133+ HSCs from umbilical cord blood (Figure 2B)
[14,15]. Data thus suggest myeloid regulation of F13 area may be initiated around the HSPC stage and maintained through the GMP stage and in mature myelo-monocytic cell types (MNs and GNs) [100].
hypoM partiallyM
F12 F13 F5 F2 F4B
B
Figure 2. Epigenetic modifications at NRAMP1 locus region ii, encompassing Dnase1 footprints F12/RH, F13, F5 and F2, and F4B (described in text sections: Sections2.2.3.1to2.2.3.3and2.3.2.2, respectively) part of a candidate super-enhancer domain (data from ENCODE consortium [9,10,78] or stated otherwise). (A) From top to bottom: chromosome 2 scale; CpG islands; CTCF sites in CD14+MNs; UCSC gene descriptions; DNAse1 footprints in CD14+MNs, HL-60, NB4, mCD34, CMK and K562 cells; EGR2, PU.1 and C/EBPb ChIP-seq data from MNs (MO) and MFs (MAC) [13]; H3K4me1 and H3K27ac ChIP-seq data from CD14+MNs, K562 cells, HUVEC and ESC; RefSeq genes; H3K9ac, H3K4me2,
H3K4me3, H4K20me1, H3K79me2 and H3K36me3 ChIP-seq data from CD14+MNs, K562 cells, HUVEC and ESC; Black/grey symbols indicate location and intensity of CAGE signals detected in myeloid cells (cf. Figure1, [68]). (B) From top to bottom: chromosome 2 scale; UCSC genes; common SNPs; CpG islands; CTCF ChIP-seq data for CD14+MNs and K562 cells; DNAse1 footprints in CD14+MNs,
HL-60, NB4, mCD34, CMK and K562 cells; H3K4me1 and H3K27ac ChIP-seq data from CD14+MNs, K562 cells; EGR2, PU.1 and C/EBPb ChIP-seq data from MO and MAC; H3K9ac, H3K4me2, H3K4me3 ChIP-seq data from CD14+MNs and K562 cells; CpG hypomethylation data from PBMCs, MFs, B cells, Neutrophils, CD34+HSPCs and CD133+HSCs, as well as select Blueprint data (Neutrophils; M1, M2 and M0 MFs; monocytes) [14,15]; DNAse1 footprints in CD14+MNs; Black/grey symbols indicate
location and intensity of CAGE signals (cf. Figure1); Green symbols highlight hypomethylated areas in MFs, neutrophils and/or CD34+HSPCs.
DNAse footprinting shows two major accessible sites in CD14+MNs and two bording them but less apparent. The two first sites are more accessible in NB4 cells than in HL-60 and mCD34 cells, implying myelo-monocytic regulation (Figure2A). These sites bind RNA Pol II strongly in NB4 cells, and more weakly in HL-60 and K562 cells as well as ESC (Figure S3).
In K562, NB4 and ESC the F13 area interacts with CTCF (Figure S3; corresponds to site F, Figure1) as well as some cohesin subunits (in HepG2 cells); it binds few TFs (GABP, PU.1) in HSPCs or MYC-MAX in NB4 cells [78] (Figure S9). Interactions with both CTCF and hematopoietic TFs thus imply lineage-specific regulatory roles for this cluster of DHS.
Biology 2017, 6, 28 12 of 55
Histone marking at F13 is specific of myelo-monocytic cells and absent in K562 erythrocytic precursors (Figure 2A). Both K9ac and K27ac strongly mark the area in CD14+ MNs, as well as K4me1/2/3 (vs. traces of K79me2; Figure2A). Nucleosome density suggests focal TF binding in CD14+ MNs while predicted BS include C/EBP, FOX, SP and IRF factors.
DNA hypomethylation at the two first sites shows differences between MFs and peripheral blood cell types (PMNs, CD34+HSPCs) vs. CD133+HSCs from umbilical cord blood (Figure2B) [14,15]. Data thus suggest myeloid regulation of F13 area may be initiated around the HSPC stage and maintained through the GMP stage and in mature myelo-monocytic cell types (MNs and GNs) [100].
F13 forms thus a complex DHS whose properties differ from upstream neighbor site F12. Their combined activation may confer strong transcriptional activity (F12) and narrow cell-type specificity (F13), which are both required to switch on NRAMP1 expression specifically in precursors of PMNs, MNs and MFs; in addition, F13 may confer responsiveness to immuno-modulatory signals.
2.2.3.3. Complex Cluster of Myelomocytic-Specific Binding Sites (DHS F5-F2)
Contiguous CAGE clusters comprise several DNAse 1 footprints spanning adjacent areas previously described (F5, F2) [11] and close to a third, downstream DHS (F4B) not matched by significant CAGE signal (cf. Section2.3.2.2; Figure S3). Up to six DNAse footprints suggested by uniform peaks may be juxtaposed along a 1.8 kb segment thus delineating another complex cluster of TFBS (F5-F2 area).
The first site is part of a strong CAGE tag cluster found in MNs and PMNs (Figure S3); in both CD14+ MNs and MDMs the area binds TFs key to the myelo-monocytic fate: PU.1 and C/EBPb (Figure2A) [13,25]. The corresponding DNAse footprint is present in both HL-60 and NB4 promyelocytic cells: it represents a major binding site for RNA Pol II in the former (Figure S3) while in the latter, it binds TF MYC [11].
In CD14+ MNs both K9ac and K27ac surround this site as well as K4me1/2/3 (Figure 2A), suggesting full activation in mature mononuclear phagocytes and consistent with binding of several TFs (including STAT3 for instance) and associated activities (such as cohesin subunit, Figure S9). TFBS predicted in this area include YY1, FOX, IRF, STAT, C/EBP, NF-IL3, NRs, SMAD and PU.1.
In MDMs, F5 area demonstrated little constitutive association with STAT1 [99]; binding increased with IFN-g priming and/or activation with LPS, as well as IRF1 recruitment (Figure S10). The data suggest a key role of element F5 to regulate NRAMP1 expression in response to pro-inflammatory signals, whereas C/EBPb and PU.1 may control F5 basal activity.
Next, there are two to three footprints part of F2 area, which shows moderate CAGE tag clustering in both MNs and GNs (Figure S3). These footprints are found in AMLs (the most 50in HL-60 cells, and the others in NB4); the first is present in CD14+MNs as well, weakly decorated by K9ac/27ac and K4me1/2/3 marks (apparently flanking the upstream footprint F5; Figure2A).
The second footprint corresponds to a candidate PU.1 binding site (detected in HSPCs, MDMs and more weakly in MNs) and it is intensely marked with modified histone (Figure2A). This site may form the 30boundary of a cluster of BS for myelo-monocytic specific TFs (such as C/EBPb and MAFK) and allow the recruitment of RNA Pol II and HDAC activities (e.g., HDAC2; Figure S9).
The last footprint in the F2 area is present in CD14+MNs only; it sits at the 50boundary of an area flanked on both sides by histone acetylation and methylation marks; it may thus bind several TFs and co-factors in these cells (Figure2A) as suggested by predicted TFBS (e.g., FOX, C/EBP, ETS, POU and PPARg).
The chromosomal segment encompassing F5 and F2 areas shows extensive hypomethylation in MFs, PMNs and HSPCs (Figure2B), an observation consistent with prevalent TF binding and active histone marking in professional phagocytes, both in basal and inflammatory conditions (Figure2A).
Biology 2017, 6, 28 13 of 55
2.2.3.4. Candidate Super-Enhancer Domain
The cluster of footprints F12, F13, F5 and F2 covers a region that is highly transcribed in professional phagocytes (Figure S3) and abundantly marked in CD14+MNs with histone modifications that support transcriptional activity (Figure2A). Accordingly, this region matches an S-E domain predicted by profiling K27ac ChIP-seq signals in the interactive database DBsuper [101] (Figure S11). Integrating ChIP-seq signals for additional trans-factors (such as Mediator complex, BRD4 and RNA Pol II) and active histone marks (e.g., K4me2/3) may strengthen such S-E predictions [102].
The proposition that NRAMP1 upstream area spanning F12-F2 DHSs, perhaps including also F4B (cf. Section2.3.2.2), forms an S-E in CD14+MNs is supported by comparing chromatin marking intensity of this domain with a predicted “classic” enhancer (see Section2.2.3.5): the candidate S-E shows, on a broader scale, stronger deposition of K27ac and K4me1, PU.1 TF binding and RNA Pol II activity (Figure S11). Collectively, high level transcriptional activity and chromatin reorganization ability imply this 5 kb area may form a major regulatory domain whose properties seem compatible with the functional definition of an S-E [20,39–41,102].
The 50 element F12 is the most intensely transcribed in phagocytes; it corresponds to a CpG island marked by K27ac, K9ac and K4me3 in various tissues (Figure S12) and may act as a RH (F12/50 RH, Section2.2.3.1). In contrast, 30 elements are decorated with histone modifications only in cells that express NRAMP1 at high level; among these, F5 element binds STAT1 and IRF1 in response to infection stimuli (Figure S10). Data thus distinguish two functional areas in the proposed S-E domain whose combined activation may induce NRAMP1 expression specifically in mature phagocytes and allow immuno-modulation.
2.2.3.5. Simple Myelo-Monocytic Proximal Enhancer (DHS F7)
CAGE tag clustering at element F7 indicates moderate activity compared to the proposed S-E (Figure S11) but similar specificity, being detected essentially in mature phagocytes (Figure S4). DHS F7 typifies NRAMP1 expressing cells, such as CD14+MNs (Figure3A) and HL-60 cells wherein RNA.
Pol II binds this site (Figure S4). F7 interacts with C/EBPb in mononuclear phagocytes (Figure3A) while it seems associated with CTCF insulator in erythrocytic precursors (K562; Figure S4).
activity (Figure S11). Collectively, high level transcriptional activity and chromatin reorganization ability imply this 5 kb area may form a major regulatory domain whose properties seem compatible with the functional definition of an S-E [20,39–41,102].
The 5′ element F12 is the most intensely transcribed in phagocytes; it corresponds to a CpG island marked by K27ac, K9ac and K4me3 in various tissues (Figure S12) and may act as a RH (F12/5′ RH, Section 2.2.3.1). In contrast, 3′ elements are decorated with histone modifications only in cells that express NRAMP1 at high level; among these, F5 element binds STAT1 and IRF1 in response to infection stimuli (Figure S10). Data thus distinguish two functional areas in the proposed S-E domain whose combined activation may induce NRAMP1 expression specifically in mature phagocytes and allow immuno-modulation.
2.2.3.5. Simple Myelo-Monocytic Proximal Enhancer (DHS F7)
CAGE tag clustering at element F7 indicates moderate activity compared to the proposed S-E (Figure S11) but similar specificity, being detected essentially in mature phagocytes (Figure S4). DHS F7 typifies NRAMP1 expressing cells, such as CD14+ MNs (Figure 3A) and HL-60 cells wherein RNA.
Pol II binds this site (Figure S4). F7 interacts with C/EBPb in mononuclear phagocytes (Figure 3A) while it seems associated with CTCF insulator in erythrocytic precursors (K562; Figure S4).
Regarding histone decoration, few marks are observed in CD14+ MNs and none in K562 cells.
Histone marks in MNs indicate low level of transcriptional activity, with predominant deposition of K27ac and by decreasing abundance K4me1, K4me2 and traces only of K9ac. Histone marks border the DHS, suggesting several TFs may bind F7 element in MNs; predicted TFBS include USF, MAF and SMAD. The area also shows DNA hypomethylation in MFs, PMNs and HSPCs compared to HSCs (Figure 3B), thus further supporting regulatory activity in professional phagocytes.
In MDMs exposed to hypoxia (for 4–8 h) DHS F7 represents the strongest ChIP-seq signal specific for HIF1a and HIF2a [103] (Figure S10). F7 association with STAT1 was also noted after stimulation with LPS, as well as possible binding of IRF1 in response to IFN-g priming and further activation with LPS [99] (Figure S10). Hence, in addition to constitutive association with C/EBPb, F7 element may bind TFs that regulate NRAMP1 expression in response to various infection stimuli.
Current data suggest DHS F7 is mobilized specifically during myelo-monocytic differentiation. Transcriptional activation occurs in mature cells and it appears possible that full activation requires further cooperation with signal-dependent TFs (e.g., Fos/AP1, HIFs, STAT1 and IRF1).
NRAMP1 TSS
proximal enhancer
F7 F1 F8
A
Biology 2017, 6, 28 14 of 55
Biology 2017, 6, 28 14 of 55
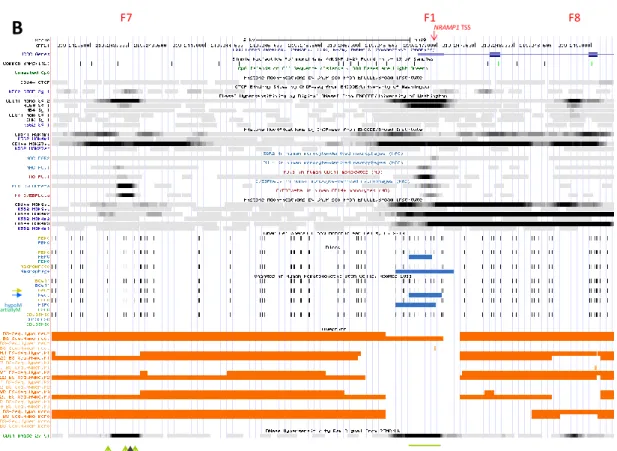
Figure 3. Epigenetic modifications at NRAMP1 locus region iii, encompassing Dnase1 footprints F7,
F1 and F8 (described in text Sections 2.2.3.5, 2.3.1.3 and 2.2.3.6, respectively). (A), (B) same as Figure 2.
2.2.3.6. DNase Footprint in NRAMP1 Intron 3 (DHS F8)
CAGE signal is moderate at site F8 in MNs and MDMs (Figure S4), including LPS-treated and influenza virus infected MDMs [16,17]. The corresponding DHS was revealed in CD14+ MNs and
HL-60 cells, and to lesser extent in NB4 and mCD34 cells (Figure 3A). Little if any bound RNA Pol II was detected in HL-60 only (Figure S4) while AP1-type or MYC TF, and chromatin modifier such as BRG1 may associate with this site (Figure S9).
The area is decorated with various histone 3 acetylation and methylation marks, K27ac and K4me2/3 for the most intense (Figure 3A). No histone marks or CTCF binding was detected in K562 cells. The area shows limited DNA methylation and no evidence of hypomethylation (Figure 3B). The paucity of TF binding this element, e.g., weak association with AP-1 (Figure S9) and STAT1 (Figure S10), may suggest myelo-monocytic specificity and/or stimulus-dependency; NRs, SMAD and NRF2 represent candidates based on predicted TFBS.
The potential regulatory determinants presented in Section 2.2.3., which show bidirectional CAGE tag clustering, were not recognized as such initially [16,17] presumably because NRAMP1 transcriptional signals are relatively weak on a genome scale. Yet, all these elements are decorated with K9ac in CD14+ MNs, which supports enhancer-type transcriptional activity [44,45]. This
interpretation is supported by prevalent deposition of K4me3 mark in CD14+ MNs and binding of
RNA Pol II in committed myelo-monocytic cells (HL-60). Accordingly, these sites are expected to support NRAMP1 expression in MNs although some appear little active, such as DHSs F7 (5′ of TSS) and F8 (in intron 3). These two sites may require either lineage- or signal-dependent collaborating TF(s) to become fully activated (such as HIFas, STAT1, IRF1 or AP-1).
2.3. Other Candidate NRAMP1 Regulatory Elements hypoM
partiallyM
NRAMP1 TSS
F7 F1 F8
B
Figure 3.Epigenetic modifications at NRAMP1 locus region iii, encompassing Dnase1 footprints F7, F1 and F8 (described in text Sections2.2.3.5,2.2.3.6and2.3.1.3, respectively). (A), (B) same as Figure2.
Regarding histone decoration, few marks are observed in CD14+MNs and none in K562 cells. Histone marks in MNs indicate low level of transcriptional activity, with predominant deposition of K27ac and by decreasing abundance K4me1, K4me2 and traces only of K9ac. Histone marks border the DHS, suggesting several TFs may bind F7 element in MNs; predicted TFBS include USF, MAF and SMAD. The area also shows DNA hypomethylation in MFs, PMNs and HSPCs compared to HSCs (Figure3B), thus further supporting regulatory activity in professional phagocytes.
In MDMs exposed to hypoxia (for 4–8 h) DHS F7 represents the strongest ChIP-seq signal specific for HIF1a and HIF2a [103] (Figure S10). F7 association with STAT1 was also noted after stimulation with LPS, as well as possible binding of IRF1 in response to IFN-g priming and further activation with LPS [99] (Figure S10). Hence, in addition to constitutive association with C/EBPb, F7 element may bind TFs that regulate NRAMP1 expression in response to various infection stimuli.
Current data suggest DHS F7 is mobilized specifically during myelo-monocytic differentiation. Transcriptional activation occurs in mature cells and it appears possible that full activation requires further cooperation with signal-dependent TFs (e.g., Fos/AP1, HIFs, STAT1 and IRF1).
2.2.3.6. DNase Footprint in NRAMP1 Intron 3 (DHS F8)
CAGE signal is moderate at site F8 in MNs and MDMs (Figure S4), including LPS-treated and influenza virus infected MDMs [16,17]. The corresponding DHS was revealed in CD14+MNs and HL-60 cells, and to lesser extent in NB4 and mCD34 cells (Figure3A). Little if any bound RNA Pol II was detected in HL-60 only (Figure S4) while AP1-type or MYC TF, and chromatin modifier such as BRG1 may associate with this site (Figure S9).
The area is decorated with various histone 3 acetylation and methylation marks, K27ac and K4me2/3 for the most intense (Figure3A). No histone marks or CTCF binding was detected in K562 cells. The area shows limited DNA methylation and no evidence of hypomethylation (Figure3B).
The paucity of TF binding this element, e.g., weak association with AP-1 (Figure S9) and STAT1 (Figure S10), may suggest myelo-monocytic specificity and/or stimulus-dependency; NRs, SMAD and NRF2 represent candidates based on predicted TFBS.
The potential regulatory determinants presented in Section2.2.3., which show bidirectional CAGE tag clustering, were not recognized as such initially [16,17] presumably because NRAMP1 transcriptional signals are relatively weak on a genome scale. Yet, all these elements are decorated with K9ac in CD14+MNs, which supports enhancer-type transcriptional activity [44,45]. This interpretation is supported by prevalent deposition of K4me3 mark in CD14+MNs and binding of RNA Pol II in committed myelo-monocytic cells (HL-60). Accordingly, these sites are expected to support NRAMP1 expression in MNs although some appear little active, such as DHSs F7 (50of TSS) and F8 (in intron 3). These two sites may require either lineage- or signal-dependent collaborating TF(s) to become fully activated (such as HIFas, STAT1, IRF1 or AP-1).
2.3. Other Candidate NRAMP1 Regulatory Elements
Combining CAGE results with epigenetic marks suggesting functional activity allowed the identification of strong candidate regulatory elements in phagocytes (Section2.2.3.). Additional CAGE signals showed clusters of tags that reflected either forward or reverse transcription only. Such eRNA data indicate elements with low transcriptional activity that may reflect either open chromatin or bookmarking for later activation [49]. In these cases, seeking additional marks of activity is crucial to predict regulatory potential.
2.3.1. Determinants Partially CAGE Positive
Additional candidate regulatory elements were tentatively delineated by aggregating results from DNAse footprints, ChIP-seq data for specific histone marks and/or TFs, including RNA Pol II and CTCF, and DNA methylation status (from consortia: ENCODE [9,10,78]; NIH Roadmap [14]; EU Blueprint epigenome [15]), in addition to evidence of forward or reverse CAGE data (RIKEN FANTOM5 [16,17]).
2.3.1.1. Upstream Footprint That Overlaps CATIP Exon V (DHS F6)
This most upstream forward CAGE signal, detected in MNs and PMNs (Figure S5), matches a strong DHS (F6) in myelo-monocytic cells (Figure4A); transcription was also observed in LPS-treated and Influenza virus-infected MDMs [16,17]. F6 element was detected in CD14+MNs, in HL-60 cells as well as in NB4 APL (Figure4A), and RNA Pol II strongly binds this site in undifferentiated HL-60 cells (Figure S5). Lighter DNAse footprinting was revealed in mCD34 cells (weak) and precursors of the megakaryocytic (CMK) and erythrocytic (K562) pathways (Figure4A). Accordingly, this site is expected to be mobilized early during myelopoiesis.
Several TFs bound element F6 in K562 cells, such as EGR1, ELF1, MAZ (Figure S9), which are known to regulate gene expression in myelo-monocytic cells. These same TFs also bind the 30 regulatory site in NRAMP1 intron 12 (F10, cf. Section2.3.1.6) in K562 cells. Predicted TFBS at F6 include NRs, RUNX, EGR, ETS and NRF2.
F6 and F10 sites are distant of ~33 kb but within CTCF boundaries of NRAMP1 regulatory domain. Both associate with RCOR1 in K562 (Figure S9), which suggests a potential mechanism for co-repression of NRAMP1, as well as with EGR2 in MDMs. In addition, F6 site binds PU.1 in MNs and MDMs (Figure4A).
Histone marks deposited at site F6 support little transcriptional activity in CD14+MNs. Traces of K9ac or K4me3 decoration were detected together with K27ac and K4me1 marks as well as low level of K4me2 (Figure4A). In K562 cells, only little K4me1 was found, implying reduced priming in erythrocytic progenitors. Yet, since TFs important for myelo-monopoiesis can bind F6 site in K562 cells (Figure S9), wherein CTCF associates with sites F12, F13 and F7 (cf. Sections2.2.3.1,2.2.3.2and2.2.3.5), data therefore imply specific mobilization of F6 in K562 as well.
Biology 2017, 6, 28 16 of 55
Biology 2017, 6, 28 16 of 55
2.3.1.2. Pair of DNase1 Footprints in CATIP Intron 6 (DHS F4A)
CAGE revealed only forward signal in this area, with low abundance transcript tags observed in MNs and PMNs essentially (Figure S5). The area comprises two DHSs of medium intensity (previously reported as F4A); the upstream footprint was detected only in CD14+ MNs while that in
3′ is shared by HL-60 cells (Figure 4A) wherein it demonstrates little RNA Pol II binding (Figure S5). The 3′ footprint matches a PU.1 binding site evidenced in both MNs and MDMs (Figure 4A), implying that weak eRNA production at F4A does not merely indicate tracking of upstream enhancer-bound transcriptional complex moving towards NRAMP1 TSS, for instance [18]. The area
F6 F11 F4A
A
hypoM partiallyM F6 F11 F4AB
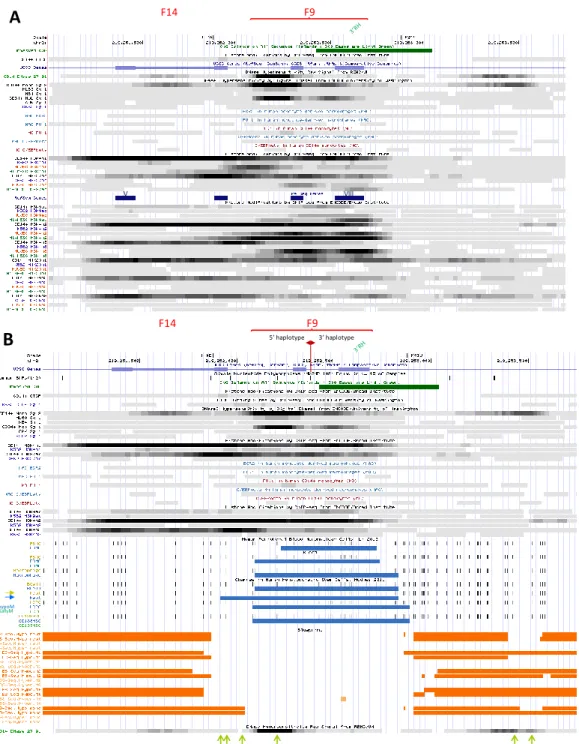
Figure 4.Epigenetic modifications at NRAMP1 locus region i, encompassing Dnase1 footprints F6, F11 and F4A (described in text Sections2.3.1.1,2.3.1.2and2.3.2.1, respectively). (A), (B) same as Figure2.
Regarding DNA methylation, few CpGs are present in the area but reduced methylation at F6 site was detected in MFs, PMNs and HSPCs, supporting activation of this element during myelo-monocytic differentiation (Figure4B).
Modest interaction with STAT1 was also detected and seemingly constitutive (Figure S10) [99]. This observation correlates with low level PU.1 binding in MNs and MDMs, as well as EGR2
binding in MDMs, suggesting several factors may cooperate at F6 element to control NRAMP1 basal expression level.
The signals detected imply F6 site binds TFs important for myelo-monocytic fate. F6 is mobilized early during myelopoiesis and its functional status differs between myelo-monocytic and erythrocytic lineages. However, this regulatory element is not fully active in mature cells. It is possible that full transcriptional activation of this element depends on recruitment of lineage- and/or signal-dependent TF(s).
2.3.1.2. Pair of DNase1 Footprints in CATIP Intron 6 (DHS F4A)
CAGE revealed only forward signal in this area, with low abundance transcript tags observed in MNs and PMNs essentially (Figure S5). The area comprises two DHSs of medium intensity (previously reported as F4A); the upstream footprint was detected only in CD14+MNs while that in 30is shared by HL-60 cells (Figure4A) wherein it demonstrates little RNA Pol II binding (Figure S5). The 30footprint matches a PU.1 binding site evidenced in both MNs and MDMs (Figure4A), implying that weak eRNA production at F4A does not merely indicate tracking of upstream enhancer-bound transcriptional complex moving towards NRAMP1 TSS, for instance [18]. The area also contains few CpGs, some of which are hypomethylated in mature phagocytes vs. HSCs, with differences between MDMs and PMNs (Figure4B).
Marked histone decoration is myelo-monocytic specific (Figure4A). Marks essentially flank in 30 or overlap the downstream footprint, including both acetylated (predominantly K27ac) and methylated (K4me1/2) histones. Lighter deposition of K4me3 and K9ac is consistent with low level transcriptional activity. Still, histone decoration pattern may suggest broad nucleosomal displacement and several TFBS were predicted in the area (e.g., C/EBP, NR, POU, FOX, ETS, GFI, NF-IL3).
These data point a regulatory area that is bound by PU.1. F4A dual determinant is specific of the myelo-monocytic lineage, apparently activated late in the differentiation program and demonstrating little transcriptional activity in blood phagocytes. The nature of the TF(s) collaborating with PU.1 and of the potential signals required to fully activate this element remain to be investigated, using microbial compounds for instance.
2.3.1.3. NRAMP1 TSS Area (DHS F1)
This site is the strongest CAGE tag cluster observed in blood cells, predominantly in phagocytes, including MN subpopulations (peak value at TSS 272±73), MDMs (49.5), pDCs (12), and MDDCs (5.5) as well as GNs (neutrophils, 395; eosinophils, 263; basophils, 134) and other cell types such as HSPCs (29), GMP (8.5) and some lymphocytes (B and NK, both 11; Figure1and Figure S4). These data demonstrate NRAMP1 TSS is transcribed at high level in microbicidal phagocytes. CAGE tag clusters map within 60 nucleotides downstream of the TSSs previously identified [76,104], suggesting they may indicate stalled RNA Pol II [18]. F1 constitutes a major DHS in both CD14+MNs and HL-60 cells (Figure3A).
F1 footprint overlaps binding sites for the TFs C/EBPb and PU.1, detected in both MNs and MDMs, and EGR2 (MDMs; Figure3A). RNA Pol II associates strongly with this area in HL-60 cells (Figure S4). In CD14+MNs, F1 site is heavily decorated with K27ac and surrounded by K9ac marks as well; K4me2 is the dominant H3 methylation mark detected together with K4me3 while K4me1 is less abundant, consistent with a pattern generally observed at TSSs. In contrast, the area lacks histone marks in K562 cells. Apparent nucleosomal displacement from the central area in MNs is compatible with binding of several TFs (e.g., TFBS predicted for IRF, FOX, RUNX, CREB, NF-KB, PU.1, ETS, SP1, GFI, GKLF, NR, C/EBP, NF-Y, NF-AT and NF-IL3 within F1 area).
F1 also corresponds to moderate HIFa ChIP-seq signals that overlap the polymorphic TG repeat known to contain two sites for the HIF-1α/ARNT heterodimer, whose binding stimulated NRAMP1 expression in THP-1 MFs activated by pathogen or proinflammatory signals [105]. ChIP-seq data in response to hypoxia suggested both HIFas may bind NRAMP1 promoter, while IL-10 pre-treatment