Official URL
https://doi.org/10.1109/KSE.2019.8919433
Any correspondence concerning this service should be sent
to the repository administrator:
[email protected]
This is an author’s version published in:
http://oatao.univ-toulouse.fr/26262
Open Archive Toulouse Archive Ouverte
OATAO is an open access repository that collects the work of Toulouse
researchers and makes it freely available over the web where possible
To cite this version: Mothe, Josiane and Laporte, Léa and Chifu,
Adrian-Gabriel Predicting Query Difficulty in IR: Impact of Difficulty
Definition. (2019) In: 11th International Conference on Knowledge and
Systems Engineering (KSE 2019), 24 October 2019 - 26 October 2019
(Da Nang, Viet Nam).
Predicting Query Difficulty in IR:
Impact of Difficulty Definition
Josiane Mothe
ESPE, Universit´e de Toulouse IRIT, UMR5505 CNRS Toulouse, France [email protected] L´ea Laporte INSA Lyon LIRIS, UMR 5205 CNRS Lyon, France [email protected] Adrian-Gabriel Chifu
Univ. d’Aix-Marseille, Univ. de Toulon CNRS, LIS UMR 7020
Marseille, France [email protected]
the user’s query (i.e. precision of 0.33) can be either a good or a poor result, depending on the context, the ambiguity of the query, etc.
Furthermore, from the definition of the notion of query difficulty can depend the evaluation of the accuracy of an automatic query difficulty prediction.
This paper investigates the query difficulty definition. More precisely, it focuses on how much the definition of query difficulty impacts the query difficulty prediction accuracy. To answer this hard problem, after reviewing the related work (Section II), we suggest several ways of defining query difficulty (Section III) and we measure the quality of query difficulty prediction according to these definitions (Section V), before drawing some conclusions (Section VI).
II. RELATED WORK
Grivolla et al. introduced a binary classification of query difficulty [9]. They classify queries into difficult and non-difficult queries. They use the median value of the average precision over the set of queries to define the two classes. Moreover, the authors used a set of features to represent the queries and a SVM-based classifier; they show that this model allows to classify the 50 TREC8 topics with about 80% of classification accuracy. Although this work did not follow-up and the model was not evaluated on other collections, nor on larger sets of queries, it provides an interesting definition of query difficulty which is class-based.
Most of the related work does not need a precise definition of difficulty, since it rather aims at predicting the performance that is to say the effectiveness of the system on a query. Query performance prediction (QPP) indeed aims at estimating system effectiveness for a given query [2], [13], [21]; the prediction is evaluated by the means of ¨Pearson correlation between the predicted system effectiveness and the real system effectiveness [2], [16].
The usefulness of QPP is not demonstrated while there are concrete applications of query difficulty prediction.
Indeed, if the difficulty of a query could be predicted, this knowledge could be used to enhance the system query-document matching one those only queries, by adding some processes such as query disambiguation [4], [6], [17], selective query expansion [8], [20], or matching parameter selection [7].
Abstract—While it exists information on about any topic on the web, we know from information retrieval (IR) evaluation programs that search systems fail to answer to some queries in an effective manner. System failure is associated to query difficulty in the IR literature. However, there is no clear definition of query difficulty. This paper investigates several ways of defining query difficulty and analyses the impact of these definitions on query difficulty prediction results. Our experiments show that the most stable definition across collections is a threshold-based definition of query difficulty classes.
Index Terms—Information retrieval, Query difficulty predic-tion, Query features
I. INTRODUCTION
Information Retrieval (IR) aims at providing a user with documents that fulfill an information need that is expressed generally through a query. In textual IR, search models are mainly based on matching bags of words from the query and from the documents, allowing search engines to retrieve documents for almost any query submitted by a user.
However, system effectiveness which measures the ability of the system to retrieve relevant documents and only relevant ones, is not the same for all the queries the system treats. For example, TREC evaluation campaigns1 have shown that a system can perform well on a given query, but poorly on another one, while another system will perform reversely [10], [15].
In IR literature, query difficulty is mainly associated with system failure and, as a consequence, a difficult query is a query for which the system gets poor performance in terms of system effectiveness measures [1]. One very active research topic in IR related to query difficulty is query difficulty prediction and query performance prediction.
There is no precise definition of what a difficult query is. Yet, a query can be difficult for a given system (just one system fails but other systems succeed) or for systems in general (all systems fail in retrieving relevant documents). Moreover, getting a third of the retrieved documents actually relevant to
1http://trec.nist.gov: the TREC Conference series supports “research within
the information retrieval community by providing the infrastructure necessary for large-scale evaluation of text retrieval methodologies”
Alternatively, the system could also start a conversational interaction to better answer a difficult query; such a (time consuming) conversation would be acceptable for the user if it was applied to difficult queries only.
However, predicting query difficulty implies precisely defin-ing the difficulty.
III. QUERY DIFFICULTY DEFINITIONS
There is no consensual definition of query difficulty in the literature. Most of the existing studies consider the correlation between predicted and actual effectiveness, which does not require a clear definition of query difficulty.
When considering query difficulty prediction as a classifica-tion problem, a definiclassifica-tion needs to be provided. Classificaclassifica-tion can be binary (a query is difficult or not), or graded (e.g. a query can be very easy, easy, difficult or very difficult for a system). If q is a query, M a given effectiveness measure such as AP (average precision) obtained by a system S, then a poor effectiveness corresponds to a low value of M .
We consider three kinds of strategies to define the difficulty of a query q, based on the value mS of an effectiveness
measure M obtained for a given system S. Our objective is to analyse the impact of the definition on the results in order to suggest the most stable definition as the best definition.
A. Percentile-based strategies.
In the binary case, a query q is considered as difficult for a system S if the value of the effectiveness measure is lower than the xth percentile p
x, which means that x% of queries
have a mS value lower than
px: difficulty(q) = 1{mS≤px} (1) In the graded difficulty case, the N difficulty classes can be defined thanks to N− 1 percentiles.
Let Di, i = 1, . . . , N be the ith difficulty class and Pj,
j= 1, . . . , N − 1, be the jthpercentile value. Then, we have
q∈ D1 if mS ≤ P1 Di,∀i = 2, . . . , N − 2 if Pi−1< mS≤ Pi DN if mS > PN−1 (2) where D1 (resp. DN) is the class of the most difficult (resp.
easiest) queries.
B. Threshold-based strategies.
In the binary case, a query q is considered difficult for a system S if the value of the effectiveness measure M is lower than a given threshold
T : difficultyq = 1{mS≤T } (3)
Graded relevance is defined in a similar way as for the percentile-based strategy, replacing the percentiles values by the thresholds values pi, i = 1, . . . , N − 1, where N is the
number of difficulty classes.
C. Combined strategies.
In the binary case, a query q is considered as difficult for a system S if it is judged as difficult regarding both the threshold-based and the percentile-based definitions:
difficulty(q) = 1{mS≤T &mS≤px} (4) In the graded difficulty case, let consider DT
i (resp. DiP,
the ithdifficulty class for the threshold (resp percentile)-based
strategy. Then q belongs to the ith difficulty class for the
combined strategy if q∈ DT
i and q∈ DiP.
In this paper, we consider a system-centered approach, which means that we define the difficulty regarding one given system instead of a set of systems. Nevertheless, the definitions we consider are generic enough to be used to define query difficulty regarding a set of systems S= {S1, . . . , Sn}. One
can just replace mS, the value of the effectiveness measure
M for the system S, bym¯ = 1 n
Pn
i=1mSi, the average of the effectiveness measure values over all the systems.
IV. QUERY DIFFICULTY PREDICTION AND EXPERIMENTAL SETTINGS
The main objective of this work is to evaluate how the different definitions impact the performance of the query difficulty. Our methodology and experimental settings are now described.
A. Methodology
Let C be a collection associated to a set of queries Q and S a system. The difficulty of each query q∈ Q for S can be assessed by using the definitions presented in section III.
Let yd= [yd
1, . . . , yd|Q|] the difficulty labels for each q ∈ Q
according to the definition d. We proceed as follows. Given a set of difficulty predictorsP, for each vector y(.)of difficulty
labels, we learn a model to predict the query difficulty by using a machine learning algorithm A.
We thus evaluate the learned model based on some per-formance metrics and analyse the results we obtain when considering different definitions for query difficulty.
As mentioned in the introduction, we focus on the queries that are the most difficult for a system, since there are the most crucial with regard to user engagement.
The experimental settings are detailed in the next sections.
B. Query difficulty predictors
We consider both pre-retrieval and post-retrieval features from the literature. Pre-retrieval features can be calculated prior the system runs the query while post-retrieval features implies to use initially-retrieved documents.
As pre-retrieval features, we used
• 2 variants of the linguistic feature SynSet: max and mean
number of synonyms of the query term synonyms in WordNet [14];
• 2 variants of IDF: the maximum and mean of the query
terms Inverse Document Frequency in the entire docu-ment collection.
As post-retrieval features, we considered :
• Query Feedback (QF) which measures the overlap of
documents between initially retrieved documents and the retrieved documents after query expansion [22];
• Weighted Information Gain (WIG) [22] which measures
the divergence between the average score of the top retrieved documents and the score of the entire corpus;
• Normalized Query Commitment (NQC) which is based
on the standard deviation of the retrieved document scores normalized by the score of the whole collection [18];
• Clarity score which measures the divergence between the
mean of the top-retrieved document scores and the mean of the entire set of document scores [5].
C. Machine learning algorithm
We use Random Forest as the learning algorithm since it has been shown to provide the best results in related work and in our preliminary studies. We performed 10-fold cross validation on the train set to tune the parameters. We used the rf package for Random Forest inR software in our experiments.
Since the number of queries is rather small per collection, we use leave-one-out cross validation in our experiments.
D. Collections and effectiveness measures
We consider two TREC collections from the ad hoc and web tasks: Robust [19] and WT10G ( [11], [12]), respectively. The TREC tasks allow researchers to investigate the performance of systems that search a static set of documents using new information needs (called topics). These collections are very popular in the literature and having two types of benchmarks, ad hoc and web, involves a wider evaluation perspective. We use the topic title as the query and the provided qrels (document relevance judgements) with trec_eval in order to compute system effectiveness.
In the case of TREC Robust, the competition provided approximately 2 gigabytes worth of documents and a set of 250 natural language topic statements (per collection). The documents were articles from newspapers like the Financial Times, the Federal Register, the Foreign Broadcast Information Service and the LA Times. The WT10G collection provided approximately 10 gigabytes worth of Web/Blog page docu-ments with its 100 corresponding topics. In Table I we present a summary of benchmark collections features regarding the topics, the documents and the disk space required for each set of documents.
TABLE I: Topic and document features from the data collec-tions
Collection No. of Topic number No. of Space topics documents on disk TREC Robust 250 301-450; 601-700 528,155 2GB WT10G 100 451-550 1,692,096 10GB
We use precision after 10 retrieved documents (P@10), as the effectiveness measure to define difficulty classes. We anal-yse the results of prediction through the confusion matrices,
the true positive rate and the false positive rate for the hard queries.
E. Systems
We use two different systems:
(1) BM25 with default parameters from Terrier and (2) the best run for each collection.
To choose the best run, we tried various system configura-tions by making Terrier parameters varying.
F. Query difficulty instanciations
In our experiments, we consider four instanciations of the proposed query difficulty definitions.
1) Experiment 1.: In experiment 1, we use the graded, percentile-based strategy to define four classes of difficulty (”very hard”, “hard”, “easy” and “very easy”), according to the first quartile, the median and the third quartile. Our goal is to evaluate a graded definition of query difficulty with automatically fixed and quite homogeneous classes in terms of number of queries.
The three other experiments aim to analyse the impact of using definitions that focus on the hardest queries.
2) Experiment 2: In experiment 2, we consider the binary threshold-based strategy to isolate the very hard queries.
We use three different thresholds for P@10: T ∈ {0, 0.1, 0.2}. T = 0 implies that we consider a query to be very difficult for a system if it fails to retrieve any relevant document among the ten first documents. For T = 0.1 (resp. 0.2), a query is judged as very difficult if it retrieves only one (resp. two) relevant documents among the ten first documents. All other queries are considered as not difficult for the system.
3) Experiment 3: In experiment 3, we established the very hard queries according to P@10 thresholds such as T ∈ {0.1, 0.2, 0.3}, but instead of considering all other queries as not hard, we keep only the easiest queries in the dataset. Once T is fixed, the threshold used to define the easiest class is set to1 − T .
Thus, we consider the following (Tveryhard,Tveryeasy) pairs of
P@10 thresholds: (0.1, 0.9), (0.2, 0.8) and (0.3, 0.7).
We do not report the (0,1) pair of P@10 thresholds since it tends to produce empty difficulty classes on our datasets. The underlying idea is that, in experiment 2, the discrimination between the very hard class and all the rest may be hard to make, due both to the larger number of “not very hard” queries and to the smooth change when passing through values that belong to the “very hard” class towards values that belong to the “not very hard”. We thus want to check whether it is easier to distinguish between queries from different classes that have a higher P@10 gap, or not.
4) Experiment 4 : Finally, in experiment 4, we investigate the combined definition of difficulty in the binary case. We consider the same P@10 thresholds than in the second exper-iment, T ∈ {0, 0.1, 0.2}, and the first quartile.
TABLE II: False positive and true positive rates for “very hard” (VH) class, for experiments 2-4, systems BM25 and BestRun and collections Robust and WT10G using the SMOTE class balancing method [3]. The upper and the middle sub-tables correspond to the threshold definition with 2 classes of query difficulty, experiments 2 (binary threshold-based) and 3 (easiest-hardest threshold based), respectively. The bottom sub-table corresponds to the combined definition with 2 classes, experiment 4 (combined-based). The threshold values are indicated in the first line of each sub-table.
EXPERIMENT2 -BINARY THRESHOLD-BASED DEFINITION(VH/NVH)
TVH= 0 TVH= 0.1 TVH= 0.2
VH False Pos VH True Pos VH False Pos VH True Pos VH False Pos VH True Pos 2*Robust BestRun 79.25% 28.95% 58.70% 55.07% 52.94% 53.09%
BM25 78.26% 35.71% 57.14% 49.09% 52.22% 53.09%
2*WT10G BestRun 61.29% 48.00% 52.17% 62.86% 43.86% 68.09%
BM25 56.67% 54.17% 51.02% 58.54% 32.65% 61.11%
EXPERIMENT3 -THRESHOLD-BASED DEFINITION WITHP@10GAP(VH/VE)
(TVeryhard,TVeryeasy) = (0.1,0.9) (TVeryhard,TVeryeasy) = (0.2,0.8) (TVeryhard,TVeryeasy) = (0.3,0.7) VH False Pos VH True Pos VH False Pos VH True Pos VH False Pos VH True Pos 2*Robust BestRun 24.24% 72.46% 24.69% 71.76% 22.52% 72.88%
BM25 16.98% 80.00% 27.78% 64.20% 26.32% 63.06%
2*WT10G BestRun 21.88% 71.43% 20.00% 85.11% 18.64% 82.76%
BM25 7.89% 85.37% 10.91% 90.74% 9.09% 88.24%
EXPERIMENT4 - COMBINED DEFINITION(VH∩Q1)
TVH= 0 & Q1 TVH= 0.1& Q1 TVH= 0.2& Q1
VH False Pos VH True Pos VH False Pos VH True Pos VH False Pos VH True Pos 2*Robust BestRun 79.25% 28.95% 58.70% 55.07% 58.70% 55.07%
BM25 78.26% 35.71% 57.14% 49.09% 52.22% 53.09%
2*WT10G BestRun 61.29% 48.00% 61.29% 48.00% 61.29% 48.00%
BM25 56.67% 54.17% 51.02% 58.54% 51.02% 58.54%
TABLE III: Confusion matrices using the WT10G collection and the BM25 run, for experiment 2 with TVH= 0.2, experiment
3 with (TVeryhard, TVeryeasy) = (0.1, 0.9), experiment 4 with Combined VH∩Q1(TVH= 0.2), and with SMOTE balancing.
(a) Experiment 2 Prediction Class VH NVH VH 33 21 NVH 16 27 (b) Experiment 3 Prediction Class VH NVH VH 35 6 NVH 3 0 (c) Experiment 4 Prediction Class VH VE VH 24 17 VE 25 31
TABLE IV: Confusion matrices using the WT10G collection and the best run, for experiment 2 with TVH= 0.2, experiment
3 with (TVeryhard, TVeryeasy) = (0.1, 0.9), experiment 4 with Combined VH∩Q1(TVH= 0.2), and with SMOTE balancing.
(a) Experiment 2 Prediction Class VH NVH VH 32 15 NVH 25 25 (b) Experiment 3 Prediction Class VH NVH VH 25 10 NVH 7 1 (c) Experiment 4 Prediction Class VH VE VH 22 13 VE 24 38
G. Dealing with unbalanced classes.
The threshold-based definitions of difficulty used in exper-iments 2-4 may produce very unbalanced classes, since the number of very hard queries is small compared to the total number of queries. We use the SMOTE algorithm, a hybrid approach for resampling.
V. RESULTS AND DISCUSSION
Tables II and VIII present the false and true positives rates for the very hard queries for experiment 1 and experiments 2-4 with resampling, respectively. Tables III, IV, V, VI and VII present the confusion matrices for experiment 1, and ex-periments 2-4 with resampling, respectively. For exex-periments 2
and 4, we present the matrices for T = 0.2, and for experiment 3,(Tveryhard, Tveryeasy) = (0.1, 0.9). In the following, we denote
the “very hard, “hard”, “easy” and “very easy” classes as “VH”, “H”, “E” and “VE”, respectively.
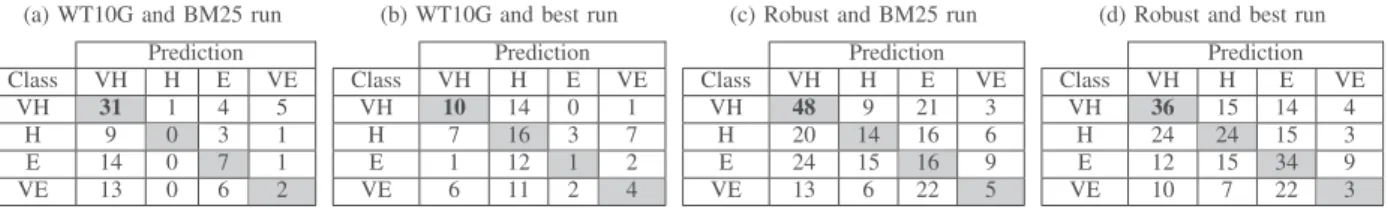
First of all, from Table VIII, one can notice that “very hard” queries are hardly predicted when using 4 classes of difficulty (percentile-based strategy, experiment 1), apart from WT10G, which is detailed in Table VIIa, with most of the very hard queries truly detected when considering BM25 (75.61%). This very high true positives rate is not consistently obtained across collections, nor across systems.
ob-TABLE V: Confusion matrices using the Robust collection and the BM25 run, for experiment 2 with TVH= 0.2, experiment
3 with (TVeryhard, TVeryeasy) = (0.1, 0.9), experiment 4 with Combined VH∩Q1(TVH= 0.2), and with SMOTE balancing.
(a) Experiment 2 Prediction Class VH NVH VH 43 38 NVH 47 119 (b) Experiment 3 Prediction Class VH NVH VH 44 11 NVH 9 17 (c) Experiment 4 Prediction Class VH VE VH 27 28 VE 36 156
TABLE VI: Confusion matrices using the Robust collection and the best run, for experiment 2 with TVH= 0.2, experiment
3 with (TVeryhard, TVeryeasy) = (0.1, 0.9), experiment 4 with Combined VH∩Q1(TVH= 0.2), and with SMOTE balancing.
(a) Experiment 2 Prediction Class VH NVH VH 40 45 NVH 45 117 (b) Experiment 3 Prediction Class VH NVH VH 50 19 NVH 16 14 (c) Experiment 4 Prediction Class VH VE VH 38 31 VE 54 124
TABLE VII: Confusion matrix on WT10G and Robust collections for the BM25 and best runs with 4 classes using percentile-based definition (experiment 1).
(a) WT10G and BM25 run Prediction Class VH H E VE VH 31 1 4 5 H 9 0 3 1 E 14 0 7 1 VE 13 0 6 2
(b) WT10G and best run Prediction Class VH H E VE VH 10 14 0 1 H 7 16 3 7 E 1 12 1 2 VE 6 11 2 4
(c) Robust and BM25 run Prediction Class VH H E VE VH 48 9 21 3 H 20 14 16 6 E 24 15 16 9 VE 13 6 22 5
(d) Robust and best run Prediction Class VH H E VE VH 36 15 14 4 H 24 24 15 3 E 12 15 34 9 VE 10 7 22 3
TABLE VIII: False positive and true positive rates in the case of 4 difficulty classes using percentile-based definition (experiment 1), with respect to the “very hard” (VH) class.
VH/H/E/VE VH False Pos VH True Pos 2*Robust BestRun 56.10% 52.17%
BM25 54.29% 59.26%
2*WT10G BestRun 58.33% 40.00%
BM25 53.73% 75.61%
tained when considering a threshold-based definition of query difficulty with two classes of difficulty (middle subtable) -experiment 3 and a high P@10 gap between the classes. True positives are detected at rates from 63% (Robust collection and BM25 run) up to 90% (WT10G collection and BM25 run).
The definition based on threshold makes sense in concrete applications, since the percentage of queries which a system is going to fail on is not known, as it depends on the queries themselves.
Combining the two definitions (threshold-based plus percentage-based) does not make the prediction easier: true positive and false positive rates are almost balances (which means the prediction is rather poor).
The choice of the system (BestRun vs. BM25 in our case) has an impact on the true positive rate (e.g. 71.76% vs. 64.20% on Robust and 85.11% vs. 90.74% on WT10G, on experiment
3, with the same thresholds). However, the impact of the system is smaller than the impact of the collection (64.20% for Robust and 90.74% for WT10G, for the BM25 run, in experiment 3). The threshold value within the same experiment has a small impact (e.g. 72.46%, 71.76% and 72.88%, for the chosen thresholds in experiment 3 - Table II, middle sub-table). Overall, the definition of query difficulty has an impact on the accuracy of the predictive model. When considering the definition that makes the most sense to us (threshold-based rather than percentage-(threshold-based) and a P@10 gap between classes, we got the highest level of true positives. Although the hard queries for the different systems may not be the same, the accuracies we obtain are similar across systems, given a collection.
VI. CONCLUSION
Since there is no clear definition for query difficulty, we pro-posed in this article three strategies to define query difficulty, based on percentiles, on thresholds and combined, respectively. With data sets built on Robust and WT10G TREC collec-tions and based on pre and post retrieval features as query difficulty predictors, we designed four experiments according to our query difficulty definitions, with the purpose of predict-ing “very hard” queries.
The results show that “very hard” queries are hardly pre-dicted, except for a few cases (WT10G collection and BM25 system).
We conclude that the best predictions are obtained with threshold-based strategies and a P@10 gap between difficulty classes and that the choice of the collection has the greatest impact on the predictions, while the threshold choices have the least impact.
REFERENCES
[1] Carmel, D., Yom-Tov, E.: Estimating the query difficulty for information retrieval. Synthesis Lectures on Information Concepts, Retrieval, and Services 2(1), 1–89 (2010)
[2] Carmel, D., Yom-Tov, E.: Estimating the Query Difficulty for Informa-tion Retrieval. Morgan and Claypool Publishers, 1st edn. (2010) [3] Chawla, N.V., Bowyer, K.W., Hall, L.O., Kegelmeyer, W.P.: Smote:
Syn-thetic minority over-sampling technique. J. Artif. Int. Res. 16(1), 321– 357 (Jun 2002), http://dl.acm.org/citation.cfm?id=1622407.1622416 [4] Chifu, A.G., Hristea, F., Mothe, J., Popescu, M.: Word sense
discrim-ination in information retrieval: A spectral clustering-based approach. Information Processing & Management 51(2), 16–31 (2015)
[5] Cronen-Townsend, S., Croft, W.B.: Quantifying query ambiguity. In: Proceedings of the Second International Conference on Human Lan-guage Technology Research. pp. 104–109. HLT ’02, Morgan Kaufmann Publishers Inc., San Francisco, CA, USA (2002)
[6] De Luca, E.W., Scheel, C.: Disambiguate yourself: Supporting users in searching documents with query disambiguation suggestions. Language technologies for a multilingual Europe 4, 123 (2018)
[7] Deveaud, R., Mothe, J., Ullah, M.Z., Nie, J.Y.: Learning to adaptively rank document retrieval system configurations. ACM Transactions on Information Systems (TOIS) 37(1), 3 (2018)
[8] Fern´andez-Reyes, F.C., Hermosillo-Valadez, J., Montes-y G´omez, M.: A prospect-guided global query expansion strategy using word embed-dings. Information Processing & Management 54(1), 1–13 (2018) [9] Grivolla, J., Jourlin, P., de Mori, R.: Automatic classification of queries
by expected retrieval performance. ACM SIGIR 5 (2005)
[10] Harman, D., Buckley, C.: Overview of the reliable information access workshop. Information Retrieval 12(6), 615 (2009)
[11] Hawking, D.: Overview of the trec-9 web track. In: Trec. ERIC (2000) [12] Hawking, D., Craswell, N.: Overview of the trec-2001 web track (2001) [13] Mizzaro, S., Mothe, J., Roitero, K., Ullah, M.Z.: Query performance prediction and effectiveness evaluation without relevance judgments: Two sides of the same coin. In: SIGIR. pp. 1233–1236 (2018) [14] Mothe, J., Tanguy, L.: Linguistic features to predict query difficulty. In:
Predicting query difficulty, ACM SIGIR workshop. pp. 7–10 (2005) [15] Mothe, J., Tanguy, L.: Linguistic analysis of users’ queries: towards an
adaptive information retrieval system. In: 2007 Third International IEEE Conference on Signal-Image Technologies and Internet-Based System. pp. 77–84. IEEE (2007)
[16] Raiber, F., Kurland, O.: Query-performance prediction: setting the expectations straight. In: ACM SIGIR. pp. 13–22. ACM (2014) [17] Shokouhi, M., Sloan, M., Bennett, P.N., Collins-Thompson, K.,
Sarki-zova, S.: Query suggestion and data fusion in contextual disambiguation. In: Proceedings of the 24th International Conference on World Wide Web. pp. 971–980. International World Wide Web Conferences Steering Committee (2015)
[18] Shtok, A., Kurland, O., Carmel, D.: Predicting query performance by query-drift estimation. In: Conference on the Theory of Information Retrieval. pp. 305–312. Springer (2009)
[19] Voorhees, E.M.: The trec robust retrieval track. SIGIR Forum 39(1), 11–20 (Jun 2005), http://doi.acm.org/10.1145/1067268.1067272 [20] Zhao, L., Callan, J.: Automatic term mismatch diagnosis for selective
query expansion. In: ACM SIGIR. pp. 515–524 (2012)
[21] Zhao, Y., Scholer, F., Tsegay, Y.: Effective pre-retrieval query perfor-mance prediction using similarity and variability evidence. In: Proceed-ings of 30th ECIR. pp. 52–64 (2008)
[22] Zhou, Y., Croft, W.B.: Query performance prediction in web search environments. In: ACM SIGIR. pp. 543–550 (2007)
![TABLE II: False positive and true positive rates for “very hard” (VH) class, for experiments 2-4, systems BM25 and BestRun and collections Robust and WT10G using the SMOTE class balancing method [3]](https://thumb-eu.123doks.com/thumbv2/123doknet/2965899.82016/5.892.102.795.219.533/positive-positive-experiments-systems-bestrun-collections-robust-balancing.webp)