Role of NLRX1 in glutamate uptake and release by astrocytes
Par
Shaimaa Mahmoud Programme d’Immunologie
Mémoire présenté à la Faculté de médecine et des sciences de la santé en vue de l’obtention du grade de maitre ès sciences (M. Sc.) en immunologie
Sherbrooke, Québec, Canada Mai, 2019
Membres du jury d’évaluation Dr. Denis Gris, programme d’Immunologie Dr. Lee-Hwa Tai, programme d’Immunologie
Dr. Rona Graham, département de pharmacologie-physiologie
This thesis is dedicated to
My beloved husband and my sweet son who were always by my side giving me power, support,and love to overcome all the challenges though out my way to achieve this work, My dearest, Mother and sisters who were always a source of love, motivation and confidence
RÉSUMÉ
Rôle de NLRX1 dans l'absorption et la libération de glutamate par les astrocytes Par
Shaimaa Mahmoud Programme d'immunologie
Mémoire présenté à la Faculté de médecine et des sciences de la santé en vue de l’obtention du diplôme de maitre ès sciences (M.Sc.) en immunologie, Faculté de médecine et des sciences de
la santé, Université de Sherbrooke, Sherbrooke, Québec, Canada, J1H 5N4
Le glutamate est le principal neurotransmetteur excitateur du système nerveux central (SNC). Lorsque le glutamate est libéré dans la fente synaptique par les neurones présynaptiques, seulement 20% du glutamate libéré est absorbé par les neurones postsynaptiques. Le glutamate restant dans l'espace extracellulaire doit être collecté puisqu’il peut être toxique pour les neurones. Une exposition excessive ou prolongée des neurones au glutamate induit une hyperstimulation des récepteurs du glutamate, conduisant éventuellement à la mort neuronale dans le cadre d'un processus appelé « excitotoxicité du glutamate ».
Les astrocytes sont les cellules qui absorbent la majorité du glutamate extracellulaire grâce à leur expression de transporteurs d’acides aminés excitateurs 1 et 2 (EAAT1 et EAAT2). Les astrocytes absorbent le glutamate contre le gradient de concentration, ce qui demande un taux élevé d’ATP intracellulaires. Un haut taux de stress oxydatifs inhibe l’absorption du glutamate.
Les astrocytes libèrent également des traces de glutamate, par exocytose médiée par le Ca2+, dans l'espace extracellulaire, ce qui permet de synchroniser les neurones adjacents. Toute anomalie astrocytaires entraîne une absorption réduite ou une libération excessive de glutamate prédisposant à une excitotoxicité du glutamate. Ces anomalies sont présentes dans plusieurs troubles du SNC.
NLRX1 est un capteur immunitaire inné de la famille des récepteurs de type NOD. Il s'agit d'une molécule anti-inflammatoire qui inhibe les voies de signalisation telles que NF-κB et RIG-1-MAVS. NLRX1 est aussi considéré un facteur de survie puisqu’il inhibe la mort neuronale. Contrairement aux autres NLRs, NLRX1 est localisé dans les mitochondries. NLRX1 augmente la fission mitochondriale et la production d'ATP et il inhibe le stress oxydatif.
Par conséquent, nous avons émis l’hypothèse qu’en renforçant les fonctions mitochondriales dans les astrocytes, NLRX1 améliore l’absorption du glutamate et inhibe la libération de glutamate par les astrocytes. Pour répondre à notre hypothèse, nous avons étudié le rôle de NLRX1 dans la capture et la libération du glutamate par des cultures d'astrocytes primaires de souris WT et Nlrx1 -/- et les mécanismes par lesquels NLRX1 atténue ses effets. Nos résultats ont révélé que NLRX1
potentialise la capture de glutamate astrocytaire en augmentant la production d’ATP mitochondriale et en prévenant le stress oxydatif, qui à leur tour maintiennent les fonctions saines de EAAT1 et EAAT2 dans les astrocytes. NLRX1 supprime également la libération de glutamate astrocytaire en réprimant la libération de Ca2+ du réticulum endoplasmique (ER), ce qui supprime l'exocytose du glutamate médiée par le Ca2+. Ensemble, nos données suggèrent que NLRX1 est un régulateur potentiel de l'homéostasie du glutamate dans le SNC.
SUMMARY
Role of NLRX1 in glutamate uptake and release by astrocytes By
Shaimaa Mahmoud Immunology Program
Thesis presented to Faculty of Medicine and Health Sciences for the obtention of a Master’s degree (M.Sc.) in Immunology, Faculty of medicine and health sciences, Université de
Sherbrooke, Sherbrooke, Québec, Canada, J1H 5N4
Glutamate is the major excitatory neurotransmitter in the central nervous system (CNS). When glutamate is released from the presynaptic neurons to the synaptic cleft, only 20% of the released glutamate is taken up by the postsynaptic neurons to transmit the excitatory signals. The remaining glutamate (80% or more) must be collected from the extracellular space as it is potentially toxic to neurons. Excessive or prolonged exposure of neurons to glutamate induces hyperstimulation of the glutamate receptors in neurons that eventually leads to neuronal death in a process known as “glutamate excitotoxicity”.
The process of glutamate uptake from the extracellular space is achieved mainly by astrocytes, which are the most numerous cell type in the CNS. Astrocytes express excitatory amino acid transporters 1 and 2 (EAAT1 and EAAT2) which are responsible for glutamate uptake. To uptake glutamate against its concentration gradient, EAAT1 and EAAT2 consume a high level of intracellular ATP. By contrast, oxidative stress inhibits their function of glutamate uptake.
In addition to glutamate uptake, recent studies demonstrate that astrocytes release traces of glutamate to the extracellular space, which helps synchronize and reinforce the firing of the adjacent neurons. Astrocytes release glutamate mainly by Ca2+-mediated exocytosis. Any defect in astrocytic functions that results in reduced glutamate uptake and/or excess glutamate release predisposes to glutamate excitotoxicity, as occurs in many CNS disorders.
NLRX1 is an innate immune sensor from the non-inflammasome NOD-like receptors’ family. It is known as an anti-inflammatory molecule that inhibits NF-κB and RIG-1-MAVS signaling pathways. NLRX1 also acts as a survival factor that inhibits neuronal death. Unlike other NLRs, NLRX1 is localized to the mitochondria and was shown to enhance mitochondrial fission and ATP production while it inhibits oxidative stress.
Therefore, we hypothesized that by enhancing mitochondrial functions in astrocytes, NLRX1 enhances glutamate uptake and inhibits glutamate release by astrocytes. To address our hypothesis, we investigated the role of NLRX1 in glutamate uptake and release by primary astrocyte cultures from WT and NLRX1-/- mice and the mechanisms by which NLRX1 mediates its effects. Our
results revealed that NLRX1 potentiates astrocytic glutamate uptake by enhancing mitochondrial ATP production and preventing oxidative stress, which in turn maintain healthy functions of EAAT1 and EAAT2 in astrocytes. NLRX1 also suppresses astrocytic glutamate release by repressing Ca2+ release from the endoplasmic reticulum (ER), which in turn suppresses Ca2+ -mediated glutamate exocytosis. Taken together, our data suggest that NLRX1 is a potential regulator of glutamate homeostasis in the CNS.
TABLE OF CONTENTS
RÉSUMÉ ... III SUMMARY ... IV TABLE OF CONTENTS ... V LIST OF FIGURES AND TABLES ... VII LIST OF ABBREVIATIONS ... VIII
1. INTRODUCTION ... 1
1.1. The Central Nervous System and its cellular components ... 1
1.1.1. Neurons and neurotransmitters ... 1
1.1.1.1. Functions of neurotransmitters ... 1
1.1.1.2. Types of neurotransmitters ... 2
1.1.2. Oligodendrocytes ... 3
1.1.3. Microglia ... 4
1.1.4. Astrocytes ... 4
1.2. Glutamate uptake by astrocytes in the CNS ... 6
1.2.1. Excitatory amino acid transporters (EAATs) ... 7
1.2.2. Expression profile of EAAT1 and EAAT2 ... 7
1.2.3. Evidence that EAAT2 and EAAT1 play the major role in glutamate uptake in the CNS .... 8
1.2.4. Mechanism of glutamate uptake by EAATs ... 8
1.2.5. Metabolism of glutamate in astrocytes ... 9
1.2.6. EAAT1 and EAAT2 regulation of expression ... 10
1.2.6.1. Transcriptional and translational modifications ... 10
1.2.6.2. Post-translational modifications and regulation of the transporter activity ... 12
1.3. Glutamate release by astrocytes in the CNS ... 13
1.3.1. Functions of astrocytic glutamate release ... 13
1.3.2. Mechanisms of astrocytic glutamate release ... 14
1.3.2.1. Ca2+-mediated glutamate exocytosis ... 14
1.3.2.2. Bestrophin-1 and TREK-1 channel-mediated glutamate release ... 15
1.3.2.3. Glutamate release through P2X7 receptors ... 17
1.3.2.4. Cystine/glutamate antiporters... 17
1.3.2.5. Reversal of glutamate uptake transporters ... 17
1.3.2.7. Volume-regulated anion channels (VRACs) ... 17
1.4. Glutamate excitotoxicity ... 18
1.4.1. CNS disorders associated with glutamate excitotoxicity ... 18
1.4.2. Molecular mechanisms of glutamate excitotoxicity ... 20
1.5. Pattern recognition receptors (PRRs) ... 21
1.5.1. Toll-like receptors (TLRs) ... 22
1.5.2. C-type lectin receptors (CLRs) ... 22
1.5.3. RIG-I-like receptors (RLRs) ... 23
1.5.4. NOD-like receptors (NLRs) ... 23
1.5.4.1. NOD-like receptor X1 (NLRX1) ... 25
2. HYPOTHESIS AND OBJECTIVES ... 29
3. ARTICLE ... 30
4. DISCUSSION ... 55
4.1. Effect of NLRX1 on glutamate release by astrocytes ... 55
4.1.1. Extracellular Ca2+ does not play a role in NLRX1-mediated astroglial glutamate release . 56 4.1.2. NLRX1 inhibits Ca2+ release from the ER in astrocytes ... 56
4.1.3. NLRX1 inhibits glutamate exocytosis by astrocytes ... 57
4.2. Effect of NLRX1 on glutamate uptake by astrocytes ... 58
4.2.1. NLRX1 does not influence the protein expression of glutamate transporters ... 58
4.2.2. NLRX1 enhances mitochondrial functions and the functional activity of glutamate transporters in astrocytes ... 60
4.3. How NLRX1 modulates the functions of the mitochondria and the ER ... 61
4.4. Conclusion and future perspectives ... 63
5. ACKNOWLEDGMENTS ... 65
LIST OF FIGURES AND TABLES
Thesis
Figure 1: Structure of neurons and synapses………... 3
Figure 2: Morphological difference between protoplasmic and fibrous astrocytes………... 6
Figure 3: Glutamate uptake and metabolism by astrocytes………... 9
Figure 4: Mechanisms of glutamate release by astrocytes………... 16
Figure 5: Molecular mechanisms of glutamate excitotoxicity………... 20
Figure 6: Structure of NLRs………... 24
Figure 7: Functional classification of NLRs………... 25
Article
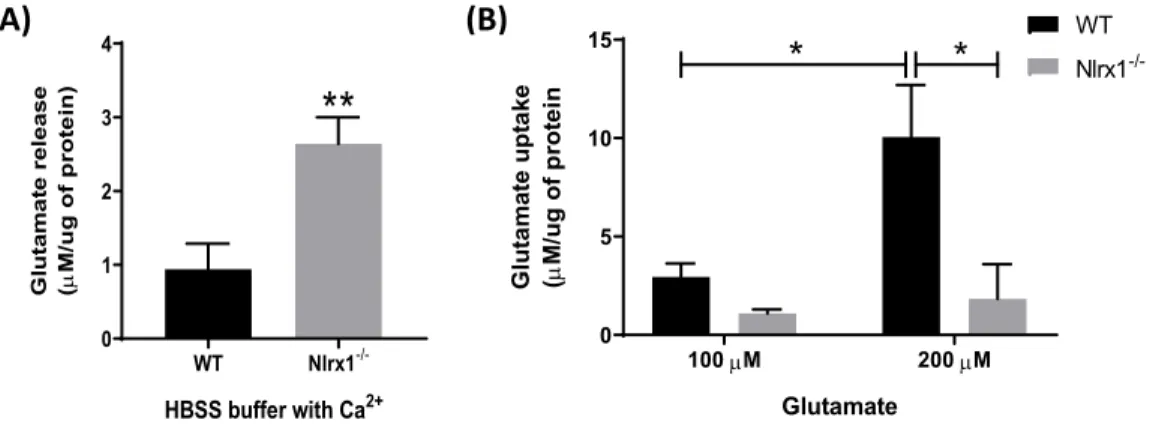
Figure 1: NLRX1 inhibits glutamate release and enhances glutamate uptake by astrocytes…... 38Figure 2: Excess Ca2+ release from the ER mediates glutamate release from Nlrx1 astrocytes... 39
Figure 3: Increased mRNA expression of the proteins of exocytosis in Nlrx1-/- astrocytes…... 40
Figure 4: mRNA and protein expression of GLT-1 and GLAST in astrocytes ………... 41
Figure 5: NLRX1 enhances mitochondrial functions in astrocytes ………. 43
Figure 6: NLRX1 maintains glutamate homeostasis in the CNS. ………... 46
LIST OF ABBREVIATIONS
[Ca2+]
i Intracellular Ca2+
µM Micromolar
2-APB 2-Aminoethyl diphenylborinate
AA Arachidonic acid
AAT ACR
Aspartate aminotransferase Acute cellular rejection
AD Alzheimer’s disease
AD domain Acidic transactivation domain
ALS Amyotrophic lateral sclerosis
AMPA α-amino-3-hydroxy-5-methylisoxazole-4-propionate
APCs ATN
Antigen-presenting cells Acute tubular necrosis
ATP Adenosine triphosphate
BBB Blood-brain-barrier
BCAT Branched-chain aminotransferase
BDNF Brain-derived neurotrophic factor
Best-1 Bestrophin-1
bFGF Basic fibroblast growth factor
BIR Baculovirus inhibitor of apoptosis protein repeat
CAPS Cryopyrin-Associated Periodic Syndromes
CARD Caspase recruitment domain
CIITA CCI CHB
Class II transactivator Controlled cortical impact Chronic hepatitis B
CLRs C-type lectin receptors
CNS COPD
Central nervous system
Chronic obstructive pulmonary disease
CsA Cyclosporin A
DAMPs Damage-associated molecular patterns
DCs Dendritic cells
dFBS Deactivated fetal bovine serum
DHK Dihydrokainate
DHR Dihydrorhodamine 123
DMSO Dimethyl sulfoxide
dsRNA Double-stranded RNA
EAAC-1 Excitatory amino acid carrier-1
EAATs Excitatory amino acid transporters
EAE Experimental autoimmune encephalomyelitis
EGF Epidermal growth factor
ER Endoplasmic reticulum
FCCP Carbonyl cyanide 4-(trifluoromethoxy) phenylhydrazone
GABA ɣ-aminobutyric acid
GDH Glutamate dehydrogenase
GDNF Glial-derived neurotrophic factor
GDNF Glial cell line-derived neurotrophic factor
GLAST Glutamate-aspartate transporter
GLT-1 Glutamate transporter-1
GPCRs G protein-coupled receptors
GRP75 The chaperone glucose-regulated protein 75
H2O2 Hydrogen peroxide
HBSS Hank’s Balanced Salt Solution
HIV Human immunodeficiency virus
HSP Heat shock proteins
IBD Inflammatory bowel disease
IFN Interferon
IGF-1 Insulin-like growth factor-1
iGluRs Ionotropic glutamate receptors
IP3 Inositol-1,4,5-trisphosphate
IRFs Interferon regulatory factors
JNK pathway JUN amino-terminal kinases-dependent pathway
LGP2 Laboratory of genetics and physiology 2
LPS Lipopolysaccharide
LRR Leucine-rich repeat
MAM Mitochondria-associated membrane
MAVS Mitochondrial antiviral signaling
MDA5 Melanoma differentiation associated gene 5
MDD Major depressive disorder
MFN2 Mitofusin 2
mGluRs Metabotropic glutamate receptors
mM Millimolar
MS Multiple sclerosis
mtDNA Mitochondrial DNA
NBD Nucleotide binding domain
NCM Neuron-conditioned medium NF-κB Nuclear factor-κB NH3/NH4+ Ammonia/Ammonium NLRs NOD-like receptors NLRX1 NOD-like receptor X1 Nlrx1-/- NLRX1-KD NLRX1-KI Nlrx1 knockout NLRX1-knock down NLRX1-knock in NMDA N-methyl-D-aspartate NO Nitric oxide
NOS Nitric oxide synthetase
O2- Superoxide
OH. Hydroxyl radicals
OONO- Peroxynitrite
P2X7 P2X Purinoceptor 7
PACAP Pituitary adenylate cyclase-activating polypeptide
PAMPs Pathogen-associated molecular patterns
PBS Phosphate-buffered saline
PGE Prostaglandin E
PI3K Phosphoinositide 3-kinase
PKA Protein kinase A
PKC Protein kinase C
PRRs Pattern recognition receptors
PYD Pyrin domain
qPCR Quantitative real-time PCR
RLRs RIG-I-like receptors
RNS Reactive nitrogen species
ROS Sc
Reactive oxygen species Scrambled ShRNA
SEM Standard error of the mean
SH group Sulfhydryl group
SNAP25 Synaptosomal-associated protein 25
SNARE complex Soluble N-ethylmaleimide-sensitive factor attachment protein receptors complex
ssRNA Single-stranded RNA
TCA Tricarboxylic acid
TG2 Transglutaminase type 2
THA D,L-threo-hydroxyaspartate
TLRs Toll-like receptors
TNF-α Tumor necrosis factor-α
TUFM Tu translation elongation factor
VAMP2 Vesicle-associated membrane protein 2
V-ATPase Vacuolar (H+) ATPase
VGLUT1 and VGLUT2 Vesicular glutamate transporters 1 and 2
VRACs Volume-regulated anion channels
1. INTRODUCTION
1.1. The Central Nervous System and its cellular components
The central nervous system (CNS) consists of the brain and the spinal cord. It is the fascinating system in our body that controls all our voluntary and involuntary movements, sensations and higher cognitive functions such as the memory, emotions, thinking, learning…. etc. It also controls our internal body functions including, but not restricted to the heart rate, respiration, and digestion. In order to perform its highly integrated functions, the CNS contains two major types of cells: neurons and glial cells, which include astrocytes, oligodendrocytes, and microglia.
1.1.1. Neurons and neurotransmitters
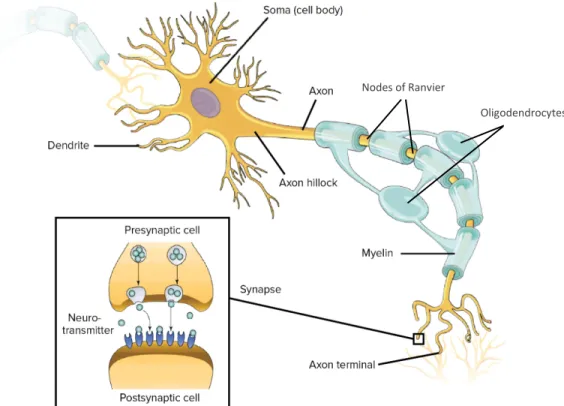
Neurons are the main functional unit in the CNS. They are responsible for the transmission of signals from the body to the CNS and vice versa. The structure of neurons is divided into three main parts, which are: the cell body, the dendrites, and the axon (Figure 1). The neuronal cell body is the central part of the neuron that contains the nucleus and all the organelles necessary for the proper neuronal function (Jacobson and Marcus 2008). Many projections arise from the cell body, that are called the dendrites. They are responsible for the transmission of signals from the presynaptic to the postsynaptic neurons at the regions of the synapses (Vanderah, Gould, and Preceded by (work): Nolte n.d.). The longest projection from the cell body is called the axon, that ends with the nerve terminal. The axon is covered by the myelin sheath, which is a lipid bilayer that helps to strengthen and speed up the signal transmission along the axon, through what is called the salutatory conduction (Jacobson and Marcus 2008). The fast propagating signals travel along the axons in the form of electrical impulses known as the “action potential”, while the transmission from one neuron to the next occurs in a chemical form, through molecules known as “neurotransmitters” (Jacobson and Marcus 2008).
1.1.1.1. Functions of neurotransmitters
According to their functions, neurotransmitters could be excitatory, inhibitory or modulatory (Deutch 2013):
• Excitatory: These transmitters are likely to induce depolarization in the postsynaptic neuron and generate an action potential. Glutamate is the major excitatory neurotransmitter in the CNS. Epinephrine and norepinephrine are also common excitatory neurotransmitters.
• Inhibitory: Transmitters that are more likely to induce hyperpolarization in the postsynaptic neuron and inhibit the generation of the action potential. The most common inhibitory neurotransmitter in the brain is ɣ-aminobutyric acid (GABA), while glycine is the most common one in the spinal cord.
• Modulatory: These transmitters can modulate the action of other neurotransmitters. They diffuse to affect a larger number of neurons than the excitatory or the inhibitory neurotransmitters; however, they conduct a slower effect.
1.1.1.2. Types of neurotransmitters
According to the structure of neurotransmitters (Deutch 2013), they are classified into: • Amino acids, such as:
Glutamate: The predominant excitatory neurotransmitter in the CNS that plays a role in cognitive functions such as memory and learning.
GABA: Inhibitory neurotransmitter that is involved in vision, motor control, and the regulation of anxiety.
• Acetylcholine: plays a role in both the central and the peripheral nervous systems. In the CNS, it is involved in cognitive functions such as memory and learning.
• Monoamines: examples are:
Epinephrine and norepinephrine: play a role in the alertness in cases of dangers or stress. Serotonin: participates in the regulation of the mood, sleep, anxiety, sexuality, and appetite. Dopamine: plays a major role in the coordination of body movements.
• Peptides: include oxytocin, which plays a role in social recognition, bonding, and sexual reproduction, and endorphins, that inhibit pain signals and stimulate the feeling of euphoria. • Purines: such as adenosine and adenosine triphosphate (ATP).
Figure 1: Structure of neurons and synapses. Representative scheme of a typical neuron
containing the cell body (soma) with the dendrites and the axon covered by myelin and ends with the axon terminal. The detailed structure of the synapse is presented on the left side of the figure. It shows the presynaptic and the postsynaptic neurons, with space in between known as the synaptic cleft where the neurotransmitter is released. (Untitled image licensed by Khan Academy
under CC-BY-NC-SA and is available for free at www.khanacademy.org).
1.1.2. Oligodendrocytes
They represent a type of glial cells in the CNS. The main function of oligodendrocytes is to form the myelin sheath around the axons (Jacobson and Marcus 2008). Myelin is a lipid layer that is formed by a sheet of the oligodendrocyte’s plasma membrane, and a single oligodendrocyte can form myelin sheaths for several axons. Myelin sheath has a protective role for the axon against degeneration (Fitzner et al. 2006). It also wraps the axon in a non-continuous manner, leaving bare areas of the axon known as the “nodes of Ranvier”. As the action potential is traveling along the axon, the electrical impulses jump across the nodes of Ranvier, which helps to accelerate and reinforce the signal transmission (Byrne and Roberts 2009). In addition to myelin formation, oligodendrocytes release several neurotrophic factors such as glial-derived neurotrophic factor (GDNF), brain-derived neurotrophic factor (BDNF), and insulin-like growth factor-1 (IGF-1) (Bradl and Lassmann 2010).
Nodes of Ranvier
1.1.3. Microglia
They are the professional innate immune cells in the CNS. Microglia represent the tissue-resident macrophages, and they express the specific macrophage markers such as CD11b, CD14, CSF1R, CD80/86, and MHC-II (Graeber and Streit 2010; Kettenmann et al. 2011; Saijo and Glass 2011). They represent 10 to 15% of the total glial cells in the CNS (Nayak, Roth, and McGavern 2014) and they are found in the brain, spinal cord, retina and optic nerve (Goldmann and Prinz 2013). Unlike other glial cells, they possess a characteristic morphology. In the resting state, they are highly ramified cells which allow them to scan the environment of the CNS for the presence of pathogens or damaged tissue, with the alternative extension and retraction of their ramifications. When microglia become activated, they retract their ramifications and acquire a rounded or ameboid shape (Nayak et al. 2014). Microglia play a role in neurogenesis, neuroprotection, and synapse formation, in addition to their innate immune functions (Shastri, Bonifati, and Kishore 2013). Like macrophages, microglia function as phagocytic cells and antigen-presenting cells on MHC-II (Nayak et al. 2014; Shastri et al. 2013). In case of CNS pathology, microglia are classically activated to the inflammatory M1 phenotype, which release various pro-inflammatory molecules such as IL-1β, TNF-α, IL-6, CCL5, ROS, NO, iNOS, that skew the adaptive immune response towards the inflammatory phenotypes. By contrast, if microglia are alternatively activated to M2 subtype, they release regulatory cytokines such as IL-10 and TGF-β that inhibit inflammation and promote tissue repair (Goldmann and Prinz 2013; Kettenmann et al. 2011). 1.1.4. Astrocytes
They are the most plentiful cell type in the CNS, as their number exceeds the number of neurons by more than 5-folds (Liu et al. 2018). Astrocytes are star-shaped cells that connect to each other by gap junctions. They also form extensive connections with the blood vessels and neurons; therefore, they coat the CNS in a continuous and non-overlapping mechanism (Sofroniew and Vinters 2010).
According to their morphology, astrocytes are classified into two main types, protoplasmic and fibrous astrocytes (Figure 2). Protoplasmic astrocytes are found in the gray matter, and they were shown to envelop synapses. They exhibit a characteristic morphology with numerous short fine branches. Fibrous astrocytes are present in the white matter, and they are characterized by
their long fiber-like processes, by which they connect to the nodes of Ranvier (Sofroniew and Vinters 2010).
Astrocytes perform several vital functions in the CNS that maintain the homeostasis and ensure proper neuronal functions. During ontogeny, astrocytes play an essential role in the development of both white and gray matters. They form molecular boundaries and release several mediators such as “thrombospondin”, that guide the formation and growth of axons and synapses (Christopherson et al. 2005; Powell and Geller 1999). Through their connections to the blood vessels, astrocytes control the amount of blood flow to neurons, by releasing molecular mediators such as prostaglandin E (PGE), nitric oxide (NO) and arachidonic acid (AA), that modulate the diameter of the blood vessel according to the neuronal activity (Gordon, Mulligan, and MacVicar 2007). Astrocytes also uptake glucose from the blood, convert it to lactate and provide it to neurons as a source of energy (Suh et al. 2007). Additionally, they store glycogen, and by glycogenolysis, they maintain the energy support to the neurons in case of hypoglycemia or increased neuronal activity (Pellerin et al. 2007). Moreover, Astrocytes’ end-feet support the blood-brain-barrier (BBB) and maintain its integrity (Abbott, Rönnbäck, and Hansson 2006). The BBB is a diffusion barrier that protects the CNS from the blood-born infections and harmful substances. It is formed by the cerebral capillary endothelial cells, capillary basement membrane, perivascular pericytes, and astrocytes’ end-feet (Ballabh, Braun, and Nedergaard 2004). Through astrocytes’ ion channels (such as Ca2+ and K+), aquaporin-4 water channel, and Na+/H+ exchanger, astrocytes maintain the ionic and fluid balance and regulate the pH in the CNS, respectively (Obara, Szeliga, and Albrecht 2008; Simard and Nedergaard 2004). They also play a very important role in the homeostasis of neurotransmitters. Astrocytes uptake the excess synaptically-released neurotransmitters such as glutamate, GABA, and glycine from the extracellular space, metabolize them using specific enzymes expressed by astrocytes and release their metabolites back to the extracellular space, where they are taken up by neurons to resynthesize active neurotransmitters (Mahmoud et al. 2019; Sofroniew and Vinters 2010). In addition to the uptake of neurotransmitters, astrocytes release traces of transmitters, known as “Gliotransmitters” such as glutamate, GABA, D-serine and ATP to the adjacent neurons, which help to synchronize and strengthen their firing (Hamilton and Attwell 2010; Mahmoud et al. 2019). Moreover, astrocytes release many growth factors and neuroactive steroids such as estradiol and progesterone to maintain normal synaptic functions (Barres 2008; Garcia-Segura and Melcangi 2006). In CNS pathologies, astrocytes act as innate
immune cells that release several cytokines such as IL-6, IL-1ß, TNF-α, TGF-ß, IL-12, and IL-23 and chemokines such as CCL2, CCL5, CXCL10, CXCL12, CXCL8, and CXCR5 which reactivate and recruit peripheral and resident immune cells to the site of the lesions. Like microglia, activated astrocytes can present antigens on MCH-II, in addition to their limited phagocytic function (Farina, Aloisi, and Meinl 2007).
Figure 2: Morphological difference between protoplasmic and fibrous astrocytes. Scheme
showing the morphological difference between protoplasmic astrocytes in the grey matter with their short fine branches (left side) and fibrous astrocytes in the white matter with their long fiber-like processes (right side). Figure modified from (Ingo et al. 2018).
1.2. Glutamate uptake by astrocytes in the CNS
This section is modified from my published review (Mahmoud et al. 2019).
Although glutamate is the predominant excitatory neurotransmitter in the CNS (Fonnum 1984), excess glutamate in the extracellular space is potentially toxic to neurons. Therefore, proper uptake of the excess synaptically-released glutamate from the extracellular space is indispensable and is performed by all cells in the CNS, including astrocytes, microglia, oligodendrocytes, and neurons (Mahmoud et al. 2019). Astrocytes are the principal cells responsible for glutamate uptake as they uptake about 90% of the released glutamate in the CNS (Eulenburg and Gomeza 2010; Lehre and Danbolt 1998).
1.2.1. Excitatory amino acid transporters (EAATs)
The process of glutamate uptake is mediated by Na+-dependent glutamate uptake transporters, known as “excitatory amino acid transporters” (EAATs). Five isoforms of EAATs were identified so far, which are EAAT1 and EAAT2 in human and known in murine animals as glutamate-aspartate transporter (GLAST) and glutamate transporter-1 (GLT-1), respectively. Together EAAT1 and EAAT2 (GLAST and GLT-1) represent the majority of EAATs in the CNS, and they are expressed mainly by astrocytes. They uptake 80-90% of the total extracellular glutamate in the CNS (Anderson and Swanson 2000; Rose et al. 2018). Other isoforms include EAAT3, also known as excitatory amino acid carrier-1 (EAAC-1) and is expressed by neuronal cell bodies (Kanai and Hediger 1992), EAAT4 expressed by cerebellar Purkinje cells (Fairman et al. 1995), and EAAT5 expressed by retinal glial cells (Arriza et al. 1997).
1.2.2. Expression profile of EAAT1 and EAAT2
EAAT1 and EAAT2 share the same structure with 65% similarity in their amino acid components (Gegelashvili and Schousboe 1997). They also have the same affinity to glutamate, and both can reduce extracellular glutamate to the same level (Owe, Marcaggi, and Attwell 2006). However, they differ in their anatomical distribution in the CNS.
EAAT1 (GLAST) predominates in the CNS early after birth and is expressed by radial glial cells and immature astrocytes (Shibata et al. 1997). In adult CNS, EAAT1 (GLAST) predominates in the cerebellum, Müller glia in the retina, and cochlear glial cells in the inner ear, with limited expression in the forebrain. In adulthood, EAAT1 is expressed primarily by astrocytes, with some limited expression by microglia and oligodendrocytes (Schmitt et al. 1997).
On the other hand, EAAT2 (GLT-1) represents the major EAAT in the adult CNS. It acquires its maximum expression within 3-5 weeks after birth. Unlike EAAT1, EAAT2 predominates in the forebrain and represents the main EAAT expressed by mature astrocytes in the CNS (Furuta, Rothstein, and Martin 1997; Ullensvang et al. 1997).
In astrocytes, EAAT1 and EAAT2 are distributed in the form of clusters on the astrocytic processes in contact with active glutamatergic neurons (Zhou and Sutherland 2004). Moreover, the expression of both EAATs in astrocytes positively correlates with increased neuronal activity and its associated increased glutamate release (Poitry-Yamate, Vutskits, and Rauen 2002).
1.2.3. Evidence that EAAT2 and EAAT1 play the major role in glutamate uptake in the CNS Many experimental studies revealed the importance of EAAT-2 and EAAT-1 in the clearance of glutamate and prevention of its toxic effect on neurons. A study on astrocyte-deficient neuronal cultures reported a 100-fold increase in neuronal death mostly by glutamate toxicity (Rosenberg and Aizenman 1989). Other studies on preparations from the hippocampus and cerebellum showed that glutamate release from glutamatergic neurons induced glutamate transporter-associated currents in astrocytes, while no similar currents were detected in the excitatory neurons. These currents were abolished upon using D,L-threo-hydroxyaspartate (THA, a nonselective EAAT inhibitor) or dihydrokainate (DHK, a GLT-1 selective inhibitor) and in GLT-1 knockout mice (Clark and Barbour 1997; Kojima et al. 1999).
In vivo studies on GLAST and GLT-1 double knockout mice revealed the development of neurodegeneration and progressive paralysis in these mice (Rothstein et al. 1996). Regarding the preferential importance of EAAT2 (GLT-1) in glutamate uptake, GLT-1 deficient mice, as well as mice lacking GLT-1 exclusively in astrocytes in a conditional knockout mouse model showed higher susceptibility to lethal seizures and loss of neurons (Petr et al. 2015; Tanaka et al. 1997), while GLAST-mutant mice were presented with cerebellar injury that resulted in defective motor coordination (Watase et al. 1998). By contrast, EAAT3 and EAAT4 knockout mice showed only minor neurological deficits (Huang and Bergles 2004; Peghini, Janzen, and Stoffel 1997), while no EAAT5 knockout animal model has yet been reported.
1.2.4. Mechanism of glutamate uptake by EAATs
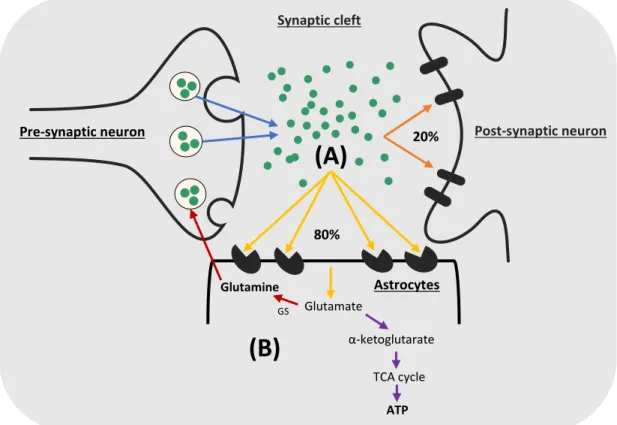
When glutamate is released from the excitatory pre-synaptic neurons, a small percentage of this glutamate is taken up by the post-synaptic neurons (20% in the retina and cerebellar cortex, and a less percentage in the hippocampus), which is enough to perform the function of excitatory transmission. The majority of the released glutamate (80% or more) is taken up by EAAT1 and EAAT2 in astrocytes (Figure 3A) (Anderson and Swanson 2000; Mahmoud et al. 2019).
Normally, glutamate concentration in the extracellular space is in the millimolar range (mM) while its concentration intracellularly is in micromolar quantities (µM). To achieve glutamate uptake against its concentration gradient, astrocytes consume high levels of intracellular adenosine triphosphate (ATP) generated by activation of the Na+/K+ ATPase in astrocytes (Pellerin and
Magistretti 1997); therefore, glutamate uptake is considered one of the highest energy-consuming processes in the CNS (Anderson and Swanson 2000).
Several previous studies described the stoichiometry driving glutamate uptake by astrocytes to be achieved by the inward transport of 3 Na+ and 1 H+ ions with each glutamate anion taken up, in exchange with the outward transport of 2 K+ ions, with their concentration gradients (Levy, Warr, and Attwell 1998). This process is associated with what is called “uptake current”, which is a form of membrane depolarization in astrocytes caused by the inward transport of 2 additional positive ions (Bowman and Kimelberg 1984).
Figure 3: Glutamate uptake and metabolism by astrocytes. (A) Glutamate uptake by
astrocytes: only 20% of the released glutamate at the synapses is transferred to the post-synaptic neurons while the remaining extracellular glutamate (80%) is taken up by EAAT2 and EAAT1 in astrocytes. (B) Glutamate metabolism in astrocytes: glutamate can be metabolized by glutamine
synthetase enzyme to glutamine which is released back to neurons or could be metabolized to α-ketoglutarate to be used in ATP synthesis (Mahmoud et al. 2019).
1.2.5. Metabolism of glutamate in astrocytes
Glutamate metabolism in astrocytes follows one of two main pathways as shown in (Figure 3B) (Mahmoud et al. 2019). Via glutamine synthetase enzyme, which is preferentially expressed
Pre-synaptic neuron Post-synaptic neuron
Synaptic cleft Astrocytes 20% 80% Glutamate Glutamine GS α-ketoglutarate TCA cycle ATP
(A)
(B)
in astrocytes, glutamate is converted to glutamine (Waniewski and Martin 1986), which is then released from astrocytes to the extracellular space by the Na+-dependent, electroneutral transporter SN1. Neurons then uptake glutamine from the extracellular space by their system A transporters and use it to resynthesize active neurotransmitters such as glutamate and GABA (Bröer et al. 2002; Bröer and Brookes 2001). Interestingly, activation of glutamine synthetase enzyme also has a detoxifying effect in the CNS, as it breaks down the blood-derived ammonia and brain ammonium (NH3/NH4+), keeping their concentrations less than 0.1 mM which protects against ammonium neurotoxicity (Marcaggi and Coles 2001).
On the other side, glutamate can undergo oxidative degradation to produce α-ketoglutarate, which enters the tricarboxylic acid (TCA) cycle and represents a precursor for ATP production. Oxidative metabolism of glutamate is achieved either by deamination, via the mitochondrial enzyme, glutamate dehydrogenase (GDH), or by transamination using aspartate aminotransferase (AAT), alanine aminotransferase, and branched chain aminotransferase (BCAT) enzymes (McKenna et al. 2016). Curiously, the oxidative metabolism of glutamate results in the production of an excessive amount of energy that compensates for the ATP originally consumed in glutamate uptake (McKenna 2013).
Depending on the concentration of glutamate in the extracellular space, glutamate metabolism is directed to one of these two pathways. If glutamate concentration is less than 0.2 mM, glutamate metabolism is directed towards glutamine synthesis to provide sufficient glutamate for neurons, while if it is more than 0.2 mM, glutamate is oxidatively degraded to maintain enough amount of ATP for glutamate uptake (McKenna et al. 1996).
1.2.6. EAAT1 and EAAT2 regulation of expression
Many factors regulate the expression of EAAT-1 and EAAT-2 under physiological and pathological conditions, at the level of the gene transcription and translation, post-translation, as well as the transporter activity. Here, we summarize the important factors at different levels. 1.2.6.1. Transcriptional and translational modifications
Glutamate concentration in the extracellular environment is one of the essential factors that influence the expression of glutamate transporters in astrocytes, as increased glutamate concentration was shown to upregulate GLAST protein expression and this effect was mediated
by activation of AMPA/Kainate receptors (Gegelashvili et al. 1996). Another study showed that glutamate also increases the cell surface expression of GLAST on astrocytes (Duan et al. 1999).
Additionally, stimulation of different types of glutamate receptors in astrocytes could have either a positive or negative effect on the expression of the transporters. For example, activation of metabotropic glutamate receptors (mGluRs) group II upregulates GLAST mRNA and protein expression, while stimulation of group I mGluRs inhibits the expression of both GLAST and GLT-1, and both mediate their effects via activation of ERK/PI3K/ NF-κB pathway (Lin et al. 2014). On the other hand, activation of ionotropic glutamate receptors (iGluRs) suppresses GLAST expression via activation of protein kinase C (PKC) signaling pathway (Lopez-Bayghen and Ortega 2004).
Co-culturing astrocytes with neurons or neuron-conditioned medium (NCM) is a major factor that increases both GLT-1 and GLAST protein expressions and functional activities (Swanson et al. 1997). This effect could be attributed to the soluble molecules released from neurons to the culture medium such as pituitary adenylate cyclase-activating polypeptide (PACAP), whose effects on GLT-1 and GLAST were mediated by activation of PKC and protein kinase A (PKA) signaling pathways ( Figiel and Engele 2000).
Various other factors mediate a positive effect on GLAST and/or GLT-1 mRNA and protein expression including hormones such as estrogen and glucocorticoids, growth factors such as epidermal growth factor (EGF), glial cell line-derived neurotrophic factor (GDNF), basic fibroblast growth factor (bFGF), and IGF-1, as well as treating astrocyte cultures with dibutyryl cyclic adenosine monophosphate (dbcAMP), ATP or adenosine. All these factors mediate their positive effects on glutamate transporters’ through activation of phosphoinositide 3-kinase (PI3K), nuclear factor-κB (NF-κB) or PKA signaling pathways (Chi-Castañeda, Suárez-Pozos, and Ortega 2017; Gegelashvili and Schousboe 1997; Mahmoud et al. 2019; Sattler and Rothstein 2006).
By contrast, other factors mediate a negative effect on the expression of one or both transporters involving, insulin hormone, endothelins, dopamine, and retinoic acid, in addition to many neuropathological conditions in the CNS such as brain ischemia and inflammatory conditions associated with the release of tumor necrosis factor-α (TNF-α). The repression of the transporters’ expression is achieved via the activation of PKA, NF-κB and YY1 pathways, and by suppressing JAK/STAT signaling pathway (Chi-Castañeda et al. 2017; Gegelashvili and Schousboe 1997; Mahmoud et al. 2019; Sattler and Rothstein 2006).
From the previous studies, it is obvious that depending on the interaction with environmental factors and other signaling pathways, activation of various singling pathways such as NF-κB, PKA or PKC could mediate either activation or inhibition of the expression of glutamate transporters in astrocytes (Mahmoud et al. 2019).
1.2.6.2. Post-translational modifications and regulation of the transporter activity
It is well-known that both GLAST and GLT-1 express potential sites of glycosylation. However, two independent studies revealed that glycosylation of both proteins during protein maturation does not have any effect on their protein trafficking to the cell surface or their functional activity (Conradt, Storck, and Stoffel 1995; Raunser et al. 2005).
Another study in 2004 showed that the interaction with the membrane cholesterol is essential to stabilize EAAT2 protein on the cell membrane and maintain its glutamate uptake ability (Butchbach et al. 2004).
Many contradictory reports were published regarding direct protein phosphorylation of GLAST and GLT-1 by PKC, PI3K or PKA, where different studies reported that they upregulate, have no effect or downregulate the movement of one or both transporter proteins to the astrocytic plasma membrane (Chi-Castañeda et al. 2017; Gegelashvili and Schousboe 1997; Mahmoud et al. 2019; Sattler and Rothstein 2006).
Moreover, various elements were shown to influence the glutamate uptake activity of one or both transporters. Arachidonic acid (AA) is one of these factors that is known to be a differential regulator, as it downregulates EAAT1 activity, while it upregulates glutamate uptake by EAAT2 (Zerangue et al. 1995). In patients with Alzheimer’s disease (AD), Amyloid β-peptide was shown to inhibit the activity of glutamate transporters (Masliah et al. 1996), while in another study, it was shown to increase trafficking of GLAST protein to the cell membrane and enhance its functional activity (Ikegaya et al. 2002).
One of the major cellular factors that inhibit the functional activity of glutamate transporters in astrocytes is oxidative stress. Two different reports showed that oxidative stress caused by hydrogen peroxide (H2O2) was associated with reduced glutamate uptake in astrocyte cultures due to direct oxidation of the sulfhydryl (SH) group of both transporter proteins (Trotti et al. 1997; Volterra et al. 1994). This negative effect of H2O2 was eliminated by treating the cultures with superoxide dismutase and catalase anti-oxidant enzymes (Sorg et al. 1997). In a recent study on
ascorbate (an antioxidant released by astrocytes during glutamate uptake and protects against glutamate neurotoxicity), ascorbate-deficient mice showed behavioral changes and a higher susceptibility to epilepsy than wild-type (WT) mice. In the same study, the authors demonstrated that ascorbate deficiency might explain the development of subclinical seizures in patients with AD (Mi et al. 2018).
1.3. Glutamate release by astrocytes in the CNS
This section is modified from my published review (Mahmoud et al. 2019).
In addition to glutamate uptake, recent studies revealed that astrocytes release traces of glutamate to the extracellular space, which modulates neuronal firing. The interest in astrocytic glutamate release started in 1990 when Cornell-Bell and colleagues reported that glutamate release from glutamatergic neurons induced intracellular Ca2+ ([Ca2+]i) level elevation in astrocytes (Cornell-Bell et al. 1990), followed by elevation of the [Ca2+]i in the adjacent neurons (Nedergaard 1994). Later on, it was shown that this high [Ca2+]i level in astrocytes evoked glutamate release from astrocytes (Parpura et al. 1994).
1.3.1. Functions of astrocytic glutamate release
The released glutamate from astrocytes plays many vital roles that modulate neuronal firing and regulate the synaptic activity (Hamilton and Attwell 2010; Mahmoud et al. 2019). These roles include:
Synchronization and strengthening of the firing of excitatory neurons. The released glutamate from glutamatergic neurons stimulates type I and V mGluRs in astrocytes, which induce elevation of [Ca2+]i level in astrocytes, that in turn evokes glutamate release. The released glutamate from astrocytes activates group I mGluRs or N-methyl-D-aspartate (NMDA) receptors in the adjacent neurons which increases the amount of glutamate release from the excitatory neurons and generates neuronal slow inward currents that are thought to synchronize their firings (Fellin et al. 2004; Jourdain et al. 2007).
Potentiation of neuronal inhibition. GABA release from the inhibitory neurons stimulates GABAB receptors in astrocytes, which triggers [Ca2+]i rise and induces glutamate release from astrocytes. Through activation of neuronal presynaptic iGluRs, the released glutamate from astrocytes increases GABA release from the adjacent inhibitory neurons (Kang et al. 1998).
Potentiation of the transient hetero-synaptic inhibition in the hippocampus. The released glutamate from the excitatory afferents to CA1 pyramidal cells stimulates interneurons to release GABA. GABA activates GABAB receptors in astrocytes, which elevates [Ca2+]i and triggers glutamate release from astrocytes. This glutamate acts on presynaptic Group I and III mGluRs in the adjacent afferents to inhibit glutamate release (Andersson, Blomstrand, and Hanse 2007). 1.3.2. Mechanisms of astrocytic glutamate release
Glutamate release by astrocytes is mediated primarily by Ca2+-dependent exocytosis; however, several other Ca2+-dependent and Ca2+-independent mechanisms were shown to be implicated in astrocytic glutamate release in healthy CNS and pathological conditions (Mahmoud et al. 2019; Malarkey and Parpura 2008). In this context, we summarize these mechanisms and their contribution to glutamate release from astrocytes (Figure 4) (Mahmoud et al. 2019).
1.3.2.1. Ca2+-mediated glutamate exocytosis
Ca2+-mediated exocytosis is yet considered the principal mechanism responsible for glutamate release by astrocytes in the healthy CNS (Figure 4A). Similar to neurons, astrocytes express all the machinery necessary for glutamate exocytosis. In neurons, glutamate is packed inside small intracellular vesicles, from which glutamate is released to the synaptic cleft. Electron microscopic visualization of the hippocampal astrocytes revealed the presence of small intracellular vesicles (~ 30 nm), like those in neurons (Bezzi et al. 2004). Another imaging study demonstrated that rat hippocampal astrocytes contain large intracellular vesicles (~ 300 nm) containing glutamate, from which only 10% of their glutamate content is released in a “kiss and run” mechanism (Chen et al. 2005).
In addition, the small intracellular vesicles in astrocytes express the vesicular glutamate transporters 1 and 2 (VGLUT1 and VGLUT2), like those expressed by neurons. These transporters are localized in astrocytes in contact with presynaptic neurons expressing NMDA receptors. The function of these transporters is to transfer glutamate from the cytosol to the vesicles to be ready for exocytosis. The function of both transporters in astrocytes, as well as in neurons is derived by the voltage and proton gradient generated by the vacuolar (H+) ATPase across the vesicular membrane (Montana et al. 2004).
Glutamate exocytosis from neurons occurs in response to [Ca2+]
i elevation caused by extracellular Ca2+ entry via the voltage-gated Ca2+ channels. This rise in the [Ca2+]
i is sensed by the Ca2+ sensor, synaptotagmin 1, expressed by neurons. Unlike neurons, the main source of [Ca2+]
i elevation in astrocytes comes from the intracellular Ca2+ stores. Stimulation of the G protein-coupled receptors (GPCRs) in astrocytes activates inositol-1,4,5-trisphosphate (IP3), which in turn triggers Ca2+ release from the endoplasmic reticulum (ER) (Hua et al. 2004). Mitochondrial Ca2+ also plays a role in astrocytic glutamate release by modulating cytoplasmic Ca2+ dynamics (Reyes and Parpura 2008). By contrast, extracellular Ca2+ plays a minor role in astrocytic glutamate exocytosis (Hua et al. 2004).Further studies demonstrated that astrocytes express synaptotagmin 4, 7 or 11 (analogs of synaptotagmin 1 in neurons) (Wang et al. 2003). To trigger glutamate exocytosis from astrocytes, the [Ca2+]i level should reach approximately 250–350 nM (Parpura and Haydon 2000).
To complete the process of exocytosis in neurons, in response to the [Ca2+]i elevation, the vesicle fusion protein, vesicle-associated membrane protein 2 (VAMP2) attaches to the cell membrane fusion proteins, Syntaxin and synaptosomal-associated protein 25 (SNAP25) to form soluble N-ethylmaleimide-sensitive factor attachment protein receptors complex (SNARE complex) (Jahn and Scheller 2006). Similar fusion proteins are expressed in astrocytes to achieve glutamate exocytosis. Astrocytes express the vesicle fusion protein VAMP2 or its analog VAMP3 (Bezzi et al. 2004), and the cell membrane fusion proteins, Syntaxin and SNAP23 (analog of SNAP25 in neurons) (Hepp et al. 1999; Parpura et al. 1995). Therefore, they have the ability to form a SNARE complex, as do neurons, resulting in glutamate release from the vesicles to the extracellular space.
1.3.2.2. Bestrophin-1 and TREK-1 channel-mediated glutamate release
A newly identified Ca2+-mediated glutamate release channel is called Bestrophin-1 (Best-1 channel) (Figure 4B). Glutamate release through Best-1 channels also occurs in response to GPCR stimulation in astrocytes, which triggers a rise in the [Ca2+]
i that induces glutamate release. However, it is not yet identified whether these channels can directly sense the rise in [Ca2+]i or through a Ca2+ sensor. The released glutamate via Best-1 channels targets the synaptic NMDA receptors in neurons and generates inward neuronal currents that are much slower than those generated by glutamate exocytosis. TREK-1 channels are other newly identified channels that
release glutamate in a Ca2+-independent mechanism (Figure 4C). They are K+ channels that allow the outward transport of glutamate in exchange with K+. The released glutamate via TREK-1 channels targets mGluRs in neurons and generates neuronal currents that are very rapid compared to those generated by Best-1-mediated glutamate release (Han et al. 2013; Woo et al. 2012).
Figure 4: Mechanisms of glutamate release by astrocytes. (A) Ca2+-mediated exocytosis:
astrocytes express VGLUT1 and VGLUT2, which transport glutamate to the intracellular vesicles. Stimulation of the GPCRs in astrocytes results in Ca2+ release from the ER in response
to IP3 formation. Sensing the intracellular Ca2+ elevation by synaptotagmin 4, 7 or 11, induces
fusion of the vesicular protein VAMP2 or VAMP3 with the cell membrane fusion proteins Syntaxin and SNAP23 to form SNARE complex, resulting in glutamate release. (B) Best-1
channels: glutamate release occurs in a Ca2+-dependent mechanism following GPCR stimulation.
(C) TREK-1 channels: glutamate is released in exchange with K+ uptake. (D) P2X7 receptors:
glutamate release occurs in exchange with ATP uptake. (E) Cystine/glutamate antiporters:
glutamate is released in exchange with cystine uptake. (F) Reversal of uptake transporters: in
severe ischemia or stroke. (G) Gap junction hemichannels: formed by connexin and pannexin
proteins. (H) Volume-regulated anion channels (VRACs): as in the case of brain edema
(Mahmoud et al. 2019). ER Ca2+
(A)
(B)
(C)
SNARE complex K+ ATP Cystine(G)
(H)
Synaptotagmin 4,7 or 11 VAMP2 or VAMP3 SN AP 23 Sy nt ax in VGLUT1 or VGLUT2 Best-1 channels TERK-1 channels Hemichannels VRACs1.3.2.3. Glutamate release through P2X7 receptors
P2X Purinoceptor 7 (P2X7) receptors are ATP uptake receptors. When these receptors are activated in astrocytes in vitro, they allow the release of glutamate in exchange with the inward transport of ATP (Duan et al. 2003) (Figure 4D). However, the contribution of these receptors to the glutamate release in vivo is still unclear.
1.3.2.4. Cystine/glutamate antiporters
They are Cl- dependent cystine uptake transporters that allow the outward transport of glutamate in exchange with the cystine uptake (Figure 4E). In two different studies, activating these transporters in the cerebellum and rat striatum induced glutamate release from astrocytes and generated inward currents in the adjacent neurons (Baker et al. 2002; Warr, Takahashi, and Attwell 1999). In a third study, adding cystine to the acutely-cut brain slices increased the level of the extracellular glutamate (Moran et al. 2005).
1.3.2.5. Reversal of glutamate uptake transporters
This mechanism of glutamate release occurs only in pathological conditions. In case of reversal of the driving forces of glutamate uptake such as reversal of intracellular and extracellular Na+/K+ ratio or ATP depletion as in case of severe ischemia, glutamate transporters lose their function of glutamate uptake, and they may reverse, resulting in glutamate release via a Ca2+ -independent mechanism (Grewer et al. 2008; Phillis and O’Regan 1996; Rossi, Oshima, and Attwell 2000) (Figure 4F).
1.3.2.6. Gap junction hemichannels
The gap junctions connecting astrocytes are formed by Connexin and Pannexin proteins arranged in the form of hemichannels. Activation of these hemichannels in vitro in ischemic astrocytes results in the release of glutamate from the cytoplasm to the extracellular space in a Ca2+-independent mechanism (Ye et al. 2003) (Figure 4G).
1.3.2.7. Volume-regulated anion channels (VRACs)
Glutamate release through the VRACs was reported to occur in pathological conditions, in vitro in swollen astrocytes, and in vivo in brain edema and stroke. In these conditions, VRACs
open and allow the outward transport of glutamate (Kimelberg et al. 1990; Seki et al. 1999) (Figure 4H). However, it is not yet known whether this mechanism of glutamate release is Ca2+-dependent or independent (O’Connor and Kimelberg 1993).
1.4. Glutamate excitotoxicity
This section is modified from my published review (Mahmoud et al. 2019).
Under physiological conditions, glutamate concentration in the extracellular space of the CNS must be maintained at very low levels to prevent overstimulation of glutamate receptors in neurons and its subsequent neuronal death.
Under pathological conditions, the pathogenesis of almost all CNS disorders is associated with inflammation. Astrocytes respond to inflammation by undergoing molecular, morphological, and functional changes in a process known as “reactive astrogliosis”. Reactive astrocytes may lose some of their vital functions in the CNS or acquire many harmful effects that exacerbate the inflammatory response and delay the process of recovery. Reactive astrogliosis may be associated with loss of the astrocytic function of glutamate uptake and/or excessive glutamate release, which lead to accumulation of glutamate in the extracellular space and predispose to glutamate excitotoxicity (Sofroniew and Vinters 2010).
Glutamate excitotoxicity is defined as “the process by which neuronal death, by apoptosis or necrosis, occurs as a result of excessive or prolonged exposure of neurons to the extracellular glutamate” (Mahmoud et al. 2019).
1.4.1. CNS disorders associated with glutamate excitotoxicity
Glutamate excitotoxicity caused by reduced astrocytic glutamate uptake occurs in many CNS diseases such as CNS trauma. The expression of both glutamate transporters, EAAT1 and EAAT2, is significantly reduced in astrocytes for up to 7 days post-trauma (Landeghem et al. 2006). The same effect on the transporters occurs following CNS infection with human immunodeficiency virus (HIV) (Vesce et al. 1997).
Neurodegenerative diseases are commonly associated with impaired glutamate uptake. In amyotrophic lateral sclerosis (ALS), the affected patients suffer from loss of functions of the motor neurons caused by loss of EAAT2 expression in the spinal cord astrocytes (Rothstein et al. 1995). Interestingly, β-lactam antibiotics were neuroprotective in the animal models of ALS, as β-lactam
upregulates the expression and the functional activity of GLT-1 (EAAT2) in the CNS of these animal models (Rothstein et al. 2005). Inhibition of glutamate uptake may also be involved in other neurodegenerative diseases such as Parkinson’s disease (PD), AD, Huntington’s disease and epilepsy (Sheldon and Robinson 2007).
Many in vitro and in vivo studies demonstrated that glutamate excitotoxicity is implicated in the pathogenesis of multiple sclerosis (MS), an autoimmune disease affecting the CNS. Incubating astrocytes in vitro with MOG-activated T-cells (myelin-specific T-cells) induced marked reduction of GLAST expression in astrocytes, and this effect was mediated by T-cell-released TNF-α (Korn, Magnus, and Jung 2005). In vivo studies on experimental autoimmune encephalomyelitis (EAE, a mouse model of MS) revealed that reduced glutamate uptake in the CNS resulted in the death of neurons and oligodendrocytes, and exacerbated the process of demyelination (Pitt, Werner, and Raine 2000). Moreover, several studies on human MS revealed that glutamate excitotoxicity is involved in the pathogenesis of the disease (Werner, Pitt, and Raine 2001). Therefore, riluzole, an anti-glutamatergic drug, is now in clinical trials for the treatment of early onset MS (onset of less than one year) (Waubant et al. 2014).
Total failure of glutamate uptake occurs in CNS disorders associated with reversal or depletion of the driving forces of glutamate uptake such as the depletion of intracellular ATP that may occur in brain ischemia or stroke (Grewer et al. 2008; Phillis and O’Regan 1996; Rossi et al. 2000). Reversal of the Na+/K+ ratio is another example that occurs in hepatic encephalopathy, in which intracellular Na+ is markedly augmented as a result of ammonium toxicity (Kelly et al. 2009). In addition to the glutamate uptake failure in these diseases, reversal of glutamate uptake transporters also may occur, as previously described, resulting in glutamate release, which exacerbates the glutamate excitotoxicity (Grewer et al. 2008; Phillis and O’Regan 1996; Rossi et al. 2000).
Glutamate excitotoxicity caused by abnormal excessive release of glutamate from astrocytes commonly occurs in CNS disorders accompanied by increased release of the inflammatory mediators, TNF-α and prostaglandin E (Bezzi et al. 1998, 2001). These two mediators trigger a rise in the [Ca2+]i level in astrocytes, which in turn enhances glutamate exocytosis, as occurs in the CNS infection with HIV, brain stroke, AD and MS (Hamilton and Attwell 2010).
Various studies on neuro-psychiatric disorders demonstrated that combined dysregulation of both glutamate uptake and release by astrocytes contributes to the development of mood disorders and depression-like symptoms in animal models. Also, it was shown to be implicated in the
pathogenesis of the major depressive disorder (MDD) and schizophrenia in human (Bechtholt-Gompf et al. 2010; Haroon, Miller, and Sanacora 2017; Takahashi, Foster, and Lin 2015). Therefore, riluzole (the anti-glutamatergic drug) is used as an anti-depressant treatment for patients with MDD (Sanacora et al. 2007; Zarate et al. 2004).
1.4.2. Molecular mechanisms of glutamate excitotoxicity
Hyperstimulation of neuronal glutamate receptors results in the activation of several molecular pathways that interact synergistically and lead eventually to neuronal death. Here, we summarize the key molecular mechanisms involved in the pathogenesis of glutamate excitotoxicity (Figure 5) (Mahmoud et al. 2019).
Figure 5: Molecular mechanisms of glutamate excitotoxicity. (A) Excess extracellular
glutamate triggers hyperexcitation of neuronal ionotropic glutamate receptors and metabotropic receptors, resulting in augmentation of the [Ca2+]i level caused by excess Ca2+ entry via ionic
channels and excess Ca2+ release from the ER, respectively. This elevation in the [Ca2+]i level
represents a signal for apoptosis. (B) The rapid influx of Na+ and Cl- ions, and water to neurons
results in rupture of the neuronal plasma membrane. (C) Oxidative stress caused by excess ROS,
RNS, and the deficiency of antioxidants induces damage to the cellular proteins and nucleic acid, which in turn triggers apoptosis. (D) Excessive Ca2+ entry into the mitochondria (D1) and
mitochondrial overstimulation by oxidative stress (D2) result in the opening of mitochondrial
transition pores and release of Cytochrome C which initiate the apoptotic cascades (Mahmoud et al. 2019).
First, excess glutamate in the extracellular space, caused by reduced glutamate uptake or increased glutamate release by astrocytes induces hyperstimulation of glutamate ionotropic receptors in neurons, which are NMDA, α-amino-3-hydroxy-5-methylisoxazole-4-propionate
Ionotropic receptors Metabotropic receptors Ca2+ Na+, Cl- and water ONOO¯ O2.– OH・ ROS, NO and less anti-oxidants Apoptosis Mitochondria
(A)
(B)
(C)
(D
2)
(D
1)
(AMPA), and kainic acid (KA) receptors. The stimulation of which triggers Ca2+ entry through the voltage-gated anion channels in neurons. Excess glutamate also hyperstimulates group I and V mGluRs in neurons, which in turn triggers the formation of IP3 and Ca2+ release from the ER. The resulting high [Ca2+]
i level will raise the Ca2+ concentration in the Ca2+-sensitive organelles, mitochondria and ER, which represents the first signal to induce neuronal apoptosis. Also, the elevated [Ca2+]i level activates apoptotic proteases such as calcineurin and calpain to induce apoptosis (Dong, Wang, and Qin 2009; Mahmoud et al. 2019; Wang and Qin 2010).
Second, the excessive Ca2+ entry mediated by hyperstimulation of NMDA receptors causes excessive influx of water and ions such as Na+ and Cl- into neurons, which in turn induces acute rupture of the neuronal plasma membrane and neuronal death by necrosis (Dong et al. 2009; Mahmoud et al. 2019; Wang and Qin 2010).
Third, the pathogenesis of glutamate excitotoxicity is often associated with oxidative stress, caused by excessive production of reactive oxygen species (ROS), especially superoxide (O2-) and hydroxyl radicals (OH.). Neurodegenerative diseases also could be associated with reduced levels of antioxidants. Excessive reactive nitrogen species (RNS) also play a role in oxidative stress. Excess Ca2+ entry via the cation channels mediated by NMDA receptor stimulation activates nitric oxide synthetase (NOS) enzyme that synthesizes NO. NO interacts with O2- to produce peroxynitrite (OONO-). The resulting oxidative stress causes damage to the intracellular proteins, nucleic acid, lipids, and other molecules, resulting in activation of the intracellular apoptotic pathways (Dong et al. 2009; Mahmoud et al. 2019; Wang and Qin 2010).
Finally, Excessive mitochondrial stimulation by the high [Ca2+]
i levels and oxidative stress results in the opening of mitochondrial permeability transition pores and release of pro-apoptotic molecules into the cytosol such as cytochrome C, which activate the mitochondria-mediated apoptotic pathways (Dong et al. 2009; Mahmoud et al. 2019; Wang and Qin 2010).
1.5. Pattern recognition receptors (PRRs)
PRRs are groups of receptors expressed mainly by innate immune cells. They detect unique molecular structures of conserved pathogen-associated molecular patterns (PAMPs) in the structure of the microorganisms that are important for their physiology such as the cell membrane and the nuclei. They can also recognize patterns from the released molecules of tissue damage or stress, known as damage-associated molecular patterns (DAMPs) such as heat shock proteins
(HSP), damaged nucleic acid, and ATP. Upon recognition of PAMPs or DAMPs, PRRs initialize series of signaling cascades that lead to the activation of transcription factors such as NF-κB and MAPK, and production of chemokines and cytokines that recruit and activate other innate and adaptive immune cells (Mogensen 2009). PRRs are divided into 4 groups of receptors which are situated either on the cell membrane or intracellularly. These groups are:
1.5.1. Toll-like receptors (TLRs)
TLRs are a big group of PRRs that is expressed in most of the cell types. 10 subtypes of TLRs were identified, among which TLRs 1, 2, 4, 5, 6, and 10 are transmembranous and can recognize extracellular molecules such as bacterial lipopolysaccharide (LPS) and flagellin. Once the surface TLRs become activated, they activate NF-κB transcription factor, that leads to the production of pro-inflammatory mediators including chemokines, cytokines, and ROS that activate phagocytosis, recruit more neutrophils and macrophages to the site of infection, activate cells of the adaptive immune response, and accelerate clearance of the microorganism. TLRs 3, 7, 8, and 9 are expressed in the endosomes and can recognize virus single-stranded RNA (ssRNA) or double-stranded RNA (dsRNA), and unmethylated CpG DNA. When endosomal TLRs get activated, they activate interferon regulatory factors (IRFs), which induce the production of type I interferon (IFN-α and IFN-β) to eradicate the viral infection (Dowling and Mansell 2016).
1.5.2. C-type lectin receptors (CLRs)
This group of PRRs is expressed on the cell surface and can recognize carbohydrate structures of the microorganism such as mannose, fucose, and glucan. Recognition of these molecules results in internalization and phagocytosis of the pathogen followed by antigen presentation. Therefore, CLRs are expressed mainly in the antigen-presenting cells (APCs) such as monocytes, macrophages, and dendritic cells (DCs). Furthermore, activation of the mannose-binding lectins activates the complement system, which can fight the infection in several ways; direct lysis of the pathogen, generation of anaphylatoxins, and opsonization of the infected cells (Dunkelberger and Song 2010).
1.5.3. RIG-I-like receptors (RLRs)
RLRs are intracellular PRRs expressed in the cytosol of immune and non-immune cells. 3 members of this group were identified, which are RIG-1, melanoma differentiation associated gene 5 (MDA5), and laboratory of genetics and physiology 2 (LGP2). They recognize viral RNA, and upon activation, RLRs activate the antiviral signaling pathways to produce type I interferons (Sparrer and Gack 2015).
1.5.4. NOD-like receptors (NLRs)
They are also known as the nucleotide-binding and leucine-rich repeat-containing proteins (NLRs). NLRs are expressed in the cytoplasm of immune cells such as macrophages, dendritic cells, and neutrophils, as well as non-immune cells. They can sense a wide variety of PAMPs such as bacterial peptidoglycans and viral RNA, in addition to DAMPs from uric acid, ATP, nucleic acid proteins, ROS, alterations in osmolarity, and polysaccharides (Kumar, Kawai, and Akira 2011). The importance of NLRs in the host defense is highlighted by being evolutionary conserved across different species including plants and mammals (Jha and Pan-Yun Ting 2015). Also, genetic mutations in several members of NLRs are associated with the development of many human diseases such as Cryopyrin-Associated Periodic Syndromes (CAPS), which are auto-immune syndromes associated with a mutation in Nlrp3 gene (Lequerre et al. 2006). Mutations in Nlrp1 were shown to be associated with vitiligo (Jin et al. 2007), and mutations in the NOD2 gene is associated with Blau Syndrome (Miceli-Richard et al. 2001).
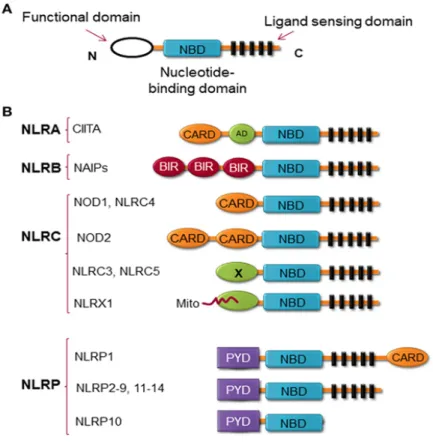
According to their structure, NLR family members contain 3 characteristic domains (Figure 6A), the C-terminal leucine-rich repeat (LRR), which is the ligand binding domain, the central nucleotide binding domain (NBD), which is responsible for oligomerization of the protein, and the N-terminal domain, which is the effector domain (Allen 2014; Gharagozloo et al. 2018). Till now, 23 members of the NLR family were identified in human, and more than 34 were identified in mice (Franchi et al. 2009). According to the difference in their N-terminal domain structure, NLRs are classified into 4 sub-categories (Figure 6B), (1) NLRA, including only one family member, Class II transactivator (CIITA), in which the effector domain is the acidic transactivation (AD) domain, (2) NLRB, possesses baculovirus inhibitor of apoptosis protein repeat (BIR), (3) NLRC,
contains caspase recruitment domain (CARD) or unknown (X) domain, and (4) NLRP, containing pyrin domain (PYD) (Barbé, Douglas, and Saleh 2014; Gharagozloo et al. 2018).
Figure 6: Structure of NLRs. (A) NLR proteins contain 3 domains, the C-terminal LRR, which
is the ligand sensing domain, the central NBD, and the N-terminal functional domain. (B)
According to the structure of the functional domain, NLRs contain 4 subgroups: NLRA with an AD domain, NLRB with a BIR domain, NLRC with a CARD or X (unknown) domains. One member of the NLRC group, NLRX1, contains a Mito sequence, which is the mitochondrial addressing sequence that localizes the protein to the mitochondria, and NLRP with a PYD domain (Gharagozloo et al. 2018).
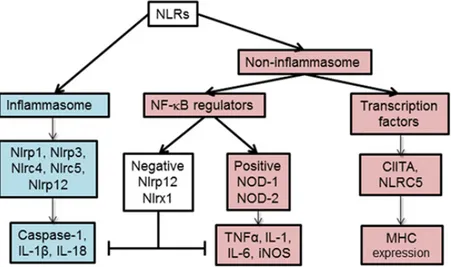
According to their functions, NLRs are classified into 2 main categories, the inflammasome and the non-inflammasome NLRs (Figure 7). The inflammasome NLRs are proteins that can assemble into large cytoplasmic multiprotein complexes such as NLRP1, NLRP3, NLRC4, NLRC5, and NLRP12. They cleave caspase 1 to active caspase-1, which in turn cleaves pro-IL-1β and pro-IL-18 into the active pro-inflammatory cytokines pro-IL-1β and IL-18. On the other side, the non-inflammasome NLRs contains 2 further subgroups. The first one contains the transcriptional co-activators, CIITA and NLRC5, which are the master regulators of MHC-II and MHC-I expressions, respectively. The second subgroup contains the regulators of NF-κB


![Figure 5: Molecular mechanisms of glutamate excitotoxicity. (A) Excess extracellular glutamate triggers hyperexcitation of neuronal ionotropic glutamate receptors and metabotropic receptors, resulting in augmentation of the [Ca 2+ ] i level caused by](https://thumb-eu.123doks.com/thumbv2/123doknet/5393933.125506/31.918.111.802.427.729/molecular-mechanisms-excitotoxicity-extracellular-hyperexcitation-ionotropic-metabotropic-augmentation.webp)