SEYED
M E H D I S H A R I F IKALAHROUDI
SOME ADVANCEMENT IN IONIZATION OF
ATOMS AND MOLECULES IN INTERMEDIATE
INTENSITY REGIME USING ULTRA-FAST LASER
PULSES
Thèse présentée
à la Faculté des études supérieures de l'Université Laval
dans le cadre du programme de doctorat en Physique
pour l'obtention du grade de Philosophiae Doctor (Ph.D.)
DEPARTEMENT DE PHYSIQUE, GENIE PHYSIQUE ET D'OPTIQUE
FACULTÉ DES SCIENCES ET DE GÉNIE
UNIVERSITÉ LAVAL
QUEBEC
2010
In the name of God
PhD Thesis
Seyed Mehdi Sharifi Kalahroudi
University Laval
Quebec, QC - Canada
Professor See Leang Chin
2010
COPYRIGHT NOTICE
I hereby grant Professor See Leang Chin and at his discretion, other members of his
laboratory the permission to use any part of this thesis.
Résumé
Dans cette thèse, nous présentons une étude de l'ionisation multiphotonique ou tunnel de certains atomes et molécules dans un régime intermédiaire d'intensité (~1013-1014 W/cm2) en utilisant des impulsions provenant d'un laser ultra rapide Ti:saphir. En étudiant l'ionisation à deux couleurs de Ar et de Xe, nous présentons un modèle pour quantifier les contributions tunnel quasi-statique et multiphotonique. La dépendance du taux d'ionisation de Ar et de Xe sur l'angle entre les vecteurs de polarisation de deux impulsions (co et 2(D) est mesurée. L'ionisation de cinq molécules organiques, CÔHÔ,
C5NH5, C3H6, C2H4, et C2H2, est étudiée. Deux phénomènes sont observés. La première observation montre que la probabilité d'ionisation jusqu'à un état uniquement chargé (+1) est supprimée en comparaison avec des atomes fictifs ayant le même potentiel d'ionisation. La seconde montre que l'ionisation double de ces molécules se produit principalement par un processus non séquentiel. Ces molécules présentent une probabilité relative énorme pour l'ionisation non séquentielle, qui est attribuée à la suppression de l'ionisation multiphotonique ou tunnel d'un ion de charge +1. Finalement, pour une application de spectroscopic laser, les spectres de masse de deux isomères de butène, 1-butène et cis-2-1-butène ionisés par des impulsions laser femtosecondes intenses sont comparés. On montre que la différence entre ces deux spectres est beaucoup plus prononcée que celle qu'on observe sur des spectres obtenus par collisions d'électrons de
100 eV. Notre observation suggère l'application possible de l'ionisation multiphotonique dissociative par des impulsions d'un laser ultrarapide pour la spectroscopic de masse de haute performance pour distinguer des molécules similaires.
Abstract
This dissertation presents a study of multiphoton and tunnel ionization in some atoms and molecules in the intermediate intensity regime (~10l3-1014 W/cm2) using ultrafast TkSapphire laser pulses. By studying two-color (<x> and 2co) ionization of Ar and Xe, a model is proposed that separates the independent contributions of quasi-static tunneling and multiphoton ionization. The ionization of five unsaturated organic molecules, CÔHÔ,
C5NH5, C3H6, C2H4, and C2H2, was studied. Two phenomena were observed. The first is that the probability of ionization to the singly charged ion is suppressed compared to fictitious atoms with the same ionization potentials. The second is that double ionization of these molecules occurs mainly through the non-sequential process. These molecules exhibit unusually large relative probability for non-sequential ionization which was attributed to the suppression of multiphoton/tunnel ionization to singly charged ions. Finally, as an application to laser mass spectroscopy, the mass spectra of two organic isomers of butène, 1-butène and cis-2-butene ionized by the intense femtosecond laser pulses were compared. It was demonstrated that the difference between the two spectra are much more pronounced than the corresponding spectra prepared by 100 eV electron ionization ion source. The observation suggests potential application of dissociative multiphoton/tunnel ionization to distinguish similar molecules with high sensitivity by ultrafast laser pulses as a source for high performance mass spectroscopy.
Acknowledgements
I would like to profoundly thank my supervisor Professor See Leang Chin. He provided a great opportunity for me by allowing me to join his scientific group at Laval University. I profited from his scientific insight and rich experience. Moreover, he also graciously supported my living via different financial resources. I sincerely appreciate his guidance, support and humble attitude during my years of doctoral studies.
In all these years, I have benefited from the kind and generous help of Dr. Abdossamad Talebpour. Our enduring friendship has been a great asset for me in all aspects of my life. In particular, his advice and numerous suggestions have played a major role in the
formation of this thesis. I stick to this opportunity to thank him from the bottom of my heart.
I have had the pleasure to work with several other colleagues at Professor Chin's laboratory. I was mostly in contact with Dr Francis Théberge. Moreover, Mr. Mario Martin was a key figure in running the experiments. Dr. Abbas Hosseini and Dr. Ali Saliminia were also close and supporting friends in the department. I owe each one of them and express my deepest gratitude.
Last, but not the least, I thank my children Amin and Matin and my beloved wife Mrs. Maryam Aghajani and our uncle Dr. G. Jafari. Without my wife's patience and constant support, it was definitely impossible for me to pursue this long and difficult journey. I owe her all my success.
Table of Contests
Chapter 1: Multiphoton and Tunneling Ionization 1- 1 : Single photon and multiphoton ionization 1- 2: Electrons in the alternatives electric field 1-3: Above threshold ionization (ATI) 1- 4: Tunneling ionization
1-5: The PPT and ADK model for ionization rates 1- 6: Ionization suppression
1- 7: Multiple ionization and non-sequential double ionization 1- 8: About this thesis
Chapter 2: Experimental Setup 2- 1 : Laser system
2-1-1: Oscillator 2-1-2: 1 kHz laser beam 2-1-3: Terawatt laser system 2- 2: Interaction chamber 2- 3: Experiment procedure 2- 4: Calibration
2-4-1 : Mass spectra calibration 2-4-2: Intensity calibration 2- 3: Laser beam delivery setup
Chapter 3: Contributions of quasi-static tunneling and multiphoton processes in the ionization of Ar and Xe.
3-1 : Experimental setup consideration 3-2: Experimental results and discussions
3.2.1: The dependence of the total ionization rate of Ar on the relative phase of the eo and 2oo pulses
3.2.2: The dependence of the total ionization rate of Ar on the angle between the polarization vectors of co and 2co pulses
3.2.3: The dependence of the total ionization rate of Xe on the angle between the polarization vectors of co and 2© pulses
3.2.4: The dependence of the total ionization rate of Xe to doubly charged ion on the angle between the polarization vectors of© and 2<a pulses 3.3: Conclusion
Chapter 4: Double ionization of some hydrocarbons 4-1: Introduction
4-2: Results and discussion of non-sequential ionization of Benzene
4-3: Results and discussion of non-sequential ionization of some hydrocarbons 4-3-1: Pyridine (C5H5N)
4-3-2: Propene (C3H6) 4-3-3: Ethylene (C2H4) 4-3-4: Acetylene (C2H2) 4-4: Conclusion
Chapter 5: Application of ultra-fast laser pulses for highly selective mass spectroscopy
5-1: Introduction
5-2- Experimental results 5-3- Discussion
Chapter 6: Summary and conclusion Appendix A: Software
A-l : Data acquisition software A-2: Data analyze software
A-3: Data analyze software for mass spectra A-4: Preparation LabView Software
Appendix B: List of the journal publications: Bibliography
Table of Figures
Chapter 1
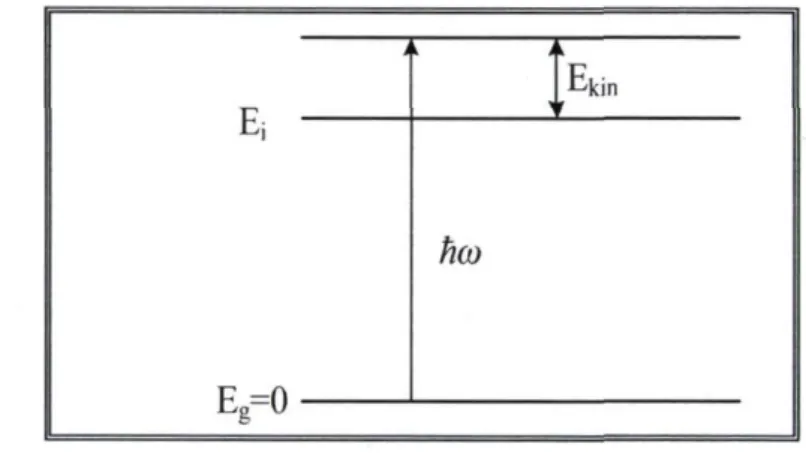
Figure 1-1: Schematic diagram of single-photon photon-ionization at low intensity.
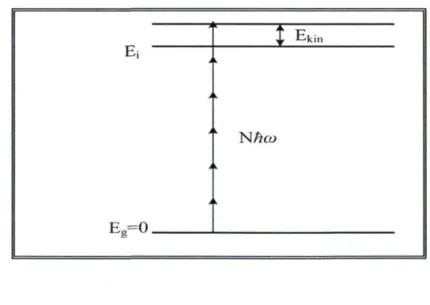
Figure 1-2: Schematic diagram of multiphoton ionization. Since ha>< En the absorption of at least N photons is required to ionize the atom. Figure 1-3: Schematic diagram of a strong external field which bends the
Coulomb potential well. The dash-dot line is delta-like potential, which approximates the potential of the ionic core as adopted by analytical models of tunnel ionization. The more realistic case of field
petrubed Coulomb potential is also presented. , The length of the barrier is l=X2-X/.
Chapter 2
Figure 2-1: Schematic diagram of oscillator, regenerative amplifier and 1 kHz laser beam.
Figure 2-2: Schematic diagram of Tsunami as a femtosecond laser oscillator Figure 2-3: Schematic diagram of Spitfire.
Figure 2-4: Block diagram of terawatt laser amplifier. Figure 2-5: Schematic diagram of time of flight chamber.
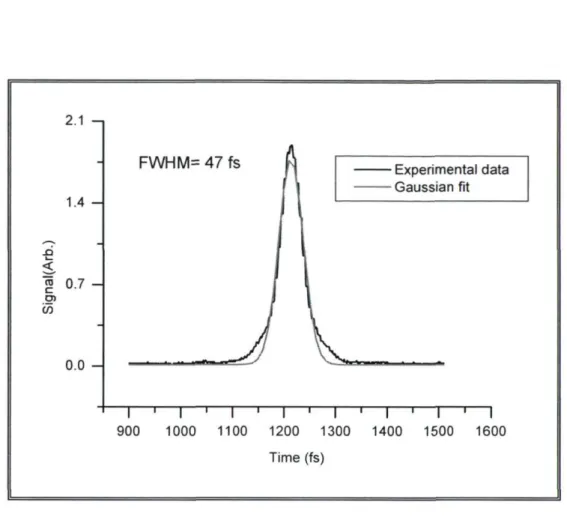
Figure 2-6: Signal from autocorollator for pulse duration measurement .the full width of half maximum is around 47 fs.
Figure 2-7: Beam profile after pulse compressor.
Figure 2-8: A samples of calibrated mass spectra of propene C3H6.
Figure 2-9: The experimental setup for measuring the focal spot size. The CaF2 window is identical with entrance window of interaction chamber.
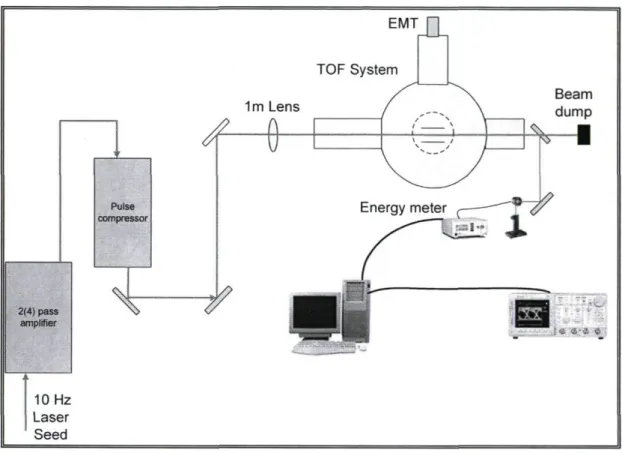
Figure 2-10: Schematic diagrams of a simple beam delivery and measurement instruments.
Figure 2-11: A sample of ionization curve in different fill pressure and saturation intensity
Figure 2-12: The experimental setup for two color experiment.
Figure 2-13: The top picture shows the overlap of 800 nm laser pulse and 400 nm with diffraction pattern. The second picture without diffraction pattern, show a delay between 800 nm laser pulse and 400 nm.
Chapter 3
Figure 3-1: Schematic diagram of the experimental setup for two-color multiphoton process study where, BS1: Harmonic separator HR@800 nm, AR/HT@400 nm; BS2: Harmonic separator, HR@400 nm, AR/HT@800 nm; MPA: Micrometer piezoelectric actuator; FA: Fixed arm ~400-nm arm; FM: Folding mirror.
Figure 3-2: The numerically calculated temporal shape of the 2ai pulses are compared with the experimentally measured shape through the sum-frequency measurement by a BBO crystal.
Figure 3-3: The ion signal of Ar+ simultaneously interacting with 800 nm and 400 nm pulses as a function of the time delay between the temporal centers of the pulses. The two temporal centers were determined by assuming that the zero delay is where the ion signal, or correspondingly the sum frequency signal of figure 3-2, is maximum. The signals for either of the 800 nm and 400 nm alone are represented with straight, delay independent, lines.
Figure 3-4: The dependence of Ar+ ion signal on the relative phase between co and 2to pulses.
Figure 3-5: The dependence of Ar+ signal on 0 which is the angle between the polarization vectors of co and 2co pulses. The "measured signal" plot corresponds to the case when both pulses are present. The dashed and solid horizontal lines indicate the ion signal when either of the co or 2co pulses are present alone.
Figure 3-6: The total ion signal of singly charged Ar ion produced in interaction with TbSapphire laser pulses are plotted as a function of peak laser field [20]. The two curves denoted by SPPT and SADK are calculated using the PPT and
ADK models.
Figure 3-7: The measured S()SI(ll0,I2ti),6) plot was fitted by the model described in section 3.2.2.
Figure 3-8: The total ion signal of singly charged Xe+ ion produced in interaction with TkSapphire laser pulses are plotted as a function of peak laser field [20]. The curve denoted by SADK is calculated using the ADK model.
Figure 3-9: The dependence of Xe+ signal on 0 which is the angle between the polarization vectors of co and 2co pulses.
Figure 3-10: The measured SOST(llo,I2(o,6) plot was fitted by the model described in section 3.2.3.
Figure 3-11: The dependence of Xe++ signal on 0 which is the angle between the polarization vectors of co and 2co pulses.
Chapter 4
Figure 4-1: Multiphoton/tunnel single and double ionization of benzene interacting with linearly polarized laser pulses from a TkSapphire laser.
Figure 4-2: The ion yield versus peak intensity plots of CsNH5+ and CsNH5++ along with four theoretically calculated curves are presented. The S0bs is obtained according to relation (4-1).
Figure 4-3: The ion yield versus peak intensity plots of C^Hb and C3H6++ along with four theoretically calculated curves are presented.
Figure 4-4: The ion yield versus peak intensity plots of C2H4+ and C2WA++ along with
four theoretically calculated curves are presented.
Figure 4-5: The ion yield versus peak intensity plots of C2H2+ and C2H2++ along with four theoretically calculated curves are presented.
Chapter 5
Figure 5-1: The chemical structure of 1 -butène. Figure 5-2: The chemical structure of cis-2-butene.
Figure 5-3: Comparison of mass spectra for cis-2-butene and 1-butène prepared by exposing pure gases to linearly polarized short laser pulses focused to peak intensity of 2 x 10¹³ W/cm2 (SI=0.793).
Figure 5-4: Comparison of mass spectra for cis-2-butene and 1-butène prepared by exposing pure gases to linearly polarized short laser pulses focused to peak intensity of 6.5x10¹³ W/cm2 (SI=0.918).
Appendix
Figure A-l: The GUI of LabView program for data acquisition Figure A-2: The GUI of LabView program for data analyze.
Figure A-3: The GUI of LabView program for data analyze of mass spectra. Figure A-4: The GUI of LabView program for preparation.
Table of Tables
Table 4-1: First and second ionization potentials (Ip) of the studied molecules.
Chapter 1: Introduction
Chapter 1
Introduction
This thesis presents the multiphoton/tunneling ionization of some atoms and molecules in the intermediate intensity regime (-101 -1014 W/cm2), interacting with ultra-fast ThSapphire laser pulses. We begin by analyzing the experimental observation on the dependency of the ionization rate in dichroic fields on the angle between the polarization vectors of two field. Accordingly, we demonstrate that the ionization process proceeds via two independent and parallel channels; "pure multiphoton" and "quasi-static tunnel" ionization. The finding is used to explain the measurements on the suppressed single ionization and non-sequential double ionization of some unsaturated hydrocarbons. Then, one potential applications of the high power femtosecond laser pulse induced ionization, and the associated fragmentation of polyatomic molecules for highly selective mass spectroscopy is identified and described. In this Chapter we give an overview of some basic concepts, which have been employed in the discussions presented in the subsequent chapters.
1-1: Single photon and multiphoton ionization
At the beginning of twentieth century Albert Einstein [1], based on Hertz's observation and by using the concept of the quantum unit of Max Planck, explained the phenomena of photo-ionization. An atom can absorb a single photon with an energy of tico that is higher than the binding energy of the electron in the atom. This process is known as
Chapter 1 : Introduction
Photoelectric effect and has been explained by invoking the lowest order perturbation theory and Fermi's golden role. Figure 1-1 shows a schematic diagram of this process. In the figure, E, is the binding energy of an electron in the ground state, ha> is the energy of photon, and Ekm is the kinetic energy of the electron after ionization by the photon. According to energy conservation law, we have:
E\in = h c o - E , (1-1)
The phoroelectron signal has a linear dependency on the illumination intensity as long as the intensity is sufficiently weak.
Figure 1-1: Schematic diagram of single-photon photon-ionization at low intensity.
In an article published in 1931, Maria Goeppert-Mayer [2] predicted that a very intense light would be able to induce two-photon ionization of atoms. Shortly after the availability of intense light sources following the invention of the laser in 1960, experimental observation of two-photon excitation in CaF2:Eu2+ by a ruby laser was reported by Kaiser and Garrett [3] in 1961.
Theoretically,by solving the Schrôdinger equation, using the time-dependent perturbation theory, we can explain the experimental observation of multiphoton
Chapter 1: Introduction
ionization of atoms. A simple approach is to assume that the laser field produces a small perturbation on the Coulomb potential of the atom. For two-photon ionization the second-order perturbation theory predicts that the ionization rate is proportional to the square of laser intensity. Generalizing these calculations, the transition rate for N photon ionization is given by:
r
N=o-
Ni
N, (i-2)
where o~N is the generalized photoionization cross section and / is the intensity of external laser field. When the photon energy is less than the binding energy of electron in the atom or ionization potential (Ej), more photons are necessary for ionization. If N photons are needed to ionize the atom we have
Ek i n= N h œ - E , . (1-3)
Figure 1-2 shows a schematic diagram of multiphoton ionization. The multiphoton ionization picture is valid as long as the electric field strength is much smaller than the Coulombic potential (/< 1012 W/cm2).
Figure 1-2: Schematic diagram of multiphoton ionization. Since ftco < Et, the absorption of at least YV photons is required to ionize the atom.
Chapter 1 : Introduction
1-2: Electrons in the alternating electric field
When an atom is ionized by an intense laser field, the ionized electron is not in free space and it is under the influence of an oscillating electromagnetic field. In a classical picture, the electron moves in an oscillating electric field E(t) = Fo sin(ait). Hence, its velocity and position in one dimension can be obtained as follows:
F = ma(t) - -eE(t) = -eF0 sin(&>/)
v(0 = - ^ - c o s ( û > 0 - v „ (1-4)
meOJ
eF
x(t) = ^-sin(«0 - v0t + x0 meo)
The constants of integration vo and xo are determined by the initial conditions. The average energy U = m^v yC over one cycle of the electric field is given by
c/ = l [ ^ = ^ 4
+< (1-5)
T\ 2 4meco2 2
e2F2
Where T is the oscillation period. The first term, Up = ^ is known as the 4me(o~
ponderomotive energy and can be more easily calculated using the following relation Up (in electron volts) = 9.33738 x 10"M I A2
where I and X have the units of W/cm2 and microns, respectively. The importance of Up, as much as we are concerned in this thesis, is that its magnitude is used to differentiate the "pure multiphoton" and "quasi static" ionization process in chapter 3.
1-3: Above threshold ionization (ATI)
In 1979, Agostini et al [4] reported an electron kinetic energy spectrum in contrast to the single energy peak predicted by Equation (1-3). Subsequently, the name "above threshold ionization" (ATI) was given to the process by which an atom in the intense laser field absorbs more photons than the threshold number N required for ionization. The observation of ATI was a strong indication that the description of multiphoton ionization
Chapter 1: Introduction
based on lowest order perturbation theory (eq. 1-2) is not appropriate. Thus, more satisfactory models were needed.
1-4: Tunneling ionization
Another phenomenon, which could happen in the ionization of atoms, is tunnel ionization. Consider the case when the external field becomes so strong that it cannot be considered as a mere perturbation relative to the Coulomb potential. Then, the lowest order perturbation theory breaks down and the simple multiphoton ionization picture, depicted in figure 1.2, is not suitable to explain the interaction process. If the laser frequency is low (starting from the near infrared), it is possible to use the quasi-static approximation, which was introduced by Keldysh [5] in 1965. Keldysh, basically, used Fermi's Golden Rule to calculate the probability of transition from a ground state to a Volkov state. The Volkov state is the exact solution of Schrôdinger equation for free oscillation in the alternating electric field. In the Keldysh model, the atom experiences a strong external oscillating (alternating) field which bends the Coulomb potential well [6, 7]. Figure 1-3 shows the schematic diagram for this situation.
The factor y, called the Keldysh parameter, was introduced to define a quantitative criterion for transition between the two ionization regimes as a function of laser parameters such as field strength and frequency and the ionization potential. In atomic units (me=e=h=\) the Keldysh parameter is defined as:
r = ^ M (i-7)
where OJL is the laser frequency and Fn is the peak strength of external laser field. The Keldysh parameter y was derived from the following consideration. According to Figure
1-3, the ease and difficulty of tunneling of electron in the potential well can be expressed as the ratio between the equivalent classical times it takes for the electron to tunnel out of the barrier, and the time over which the potential barrier is sufficiently bent down in the electrical field. Thus, the Keldysh parameter also can be expressed as follows:
co, V 2 Up
Chapter 1 : Introduction
where CUT is the tunneling frequency. When y is higher than unity ( y » l ) the multiphoton process takes places, and for y less than one ( y « l ) the tunneling ionization will dominate. Keldysh neglected the detail of atomic structure and the effects of ionic Coulomb potential on post-ionization dynamics of the electron in determining the ionization probability. Subsequent studies indicated that the later approximation was the root cause of the failure of Keldysh theory to quantitatively predict the ionization rates of atoms. In the next section we briefly review the ADK and PPT models, which have overcome this shortcoming of Keldysh model.
Figure 1-3: Schematic diagram of a strong external field which bends the Coulomb potential well. The dash-dot line is delta-like potential, which approximates the potential of the ionic core as adopted by analytical models of tunnel ionization. The more realistic case of field petrubed Coulomb potential is also presented. , The length of the barrier is l=X2-Xi.
Chapter 1 : Introduction
1-5: The PPT and ADK model for ionization rates
In 1966, Perelemov, Popov and Terent'ev (PPT model) [8] approximated the potential well of a hydrogen-like atom by a delta-like potential,V(r) = ^2EtS(r). The dash-dot line in Figure 1-3 shows this delta-like potential in the external electric field having an amplitude of Fo. Then the effects of the ionic potential, which behaves like 1/r at long distances from the nucleus, were calculated through the first order correction on the semi-classical action [9]. According to the PPT model the ionization rate of an arbitrary state of hydrogen atom is given by:
K r r = Cn Jf ( l , m ) E , 3F n(2EA 3/2 2(2£,) F 3/2 \ 2n-|m|-l exp 2(2E,) 3F 3/2 "\ (1-9)
where the factor 3F n(2E,)
m
The factor ' 2(2£,)j/2^
is a result of averaging the rate over one cycle of field.
is the effect of long range Coulomb potential. The parameters C„,/ and f(l,m) contain the information of the initial atomic state.
In 1986, Ammosov, Delone and Krainov [10], at limiting case of y « 1, extended this formula for complex atoms by replacing n,l (principal and azimuthal quantum numbers of hydrogen) with the effective quantum numbers n* and /* . They also gave an expression for C„*j* . In 1992 Ilkov el al [11] did some comments and corrections on the ADK model. The ionization rate of ADK model is given by:
WADK = Cn. J f ( l , m ) E ,
where f(l,m) and d*/* are given by:
/ **- \ 2n*-|m|-3/2 6f2(2£,)V 2^ exp 2(2£,) 3F 3 / 2 \ (1-10) 21
Chapter 1 : Introduction (21 + ■)(/ + \m\)\ y ( /'W ) = 2H( H ) ! ( /_H ) !' a i ( A J W „ * _ / * V+>/2 r r =■ 2/T77: 4e2 « *2 / *2,
«*+/'
(1-11) c = 2.71828.The first experimental observation of tunneling ionization of Xe atoms, using CO2 laser, was reported by Chin et al [12] in 1985. They satisfied the condition of / « 1 by using nanosecond CO2 laser pulses providing a peak intensity of 1014 W/cm2. The ADK model fitted very well to the first observation of tunnel ionization of Xe atoms [12]. After the invention of Chirped Pulse Amplification (CPA) technique by Donna Strickland and Gerard Mourou [13] in 1985, peak laser intensity increased by 3 orders of magnitude in a very short time. This enabled the study of multiphoton/tunnel ionization over much wider rang of experimental parameters. One land mark experiment has been done by Walker et al in 1994 [14] on the ionization of helium. They studied the production of He+ and He +H by 160 fs, 780 nm laser pulses and plotted ion signal versus intensity over 12 orders of magnitude dynamic range. They showed that ADK model can fit on a single ion curve especially at high intensity. They measured the short pulse resonant photoelectron spectrum of Xe as a function of pulse energy for calibration of intensity. This absolute intensity calibration method verified that the ADK model quantitatively fits the experimentally observed tunnel ionization rates with satisfactory precision.
Most of experiments using visible or near-infrared lasers take place in the multiphoton/tunneling or intermediate regime, where the ADK model underestimates the ionization rates. Chin's group at Laval University did extensive series of ionization experiments over a period of three decades with different laser wavelengths and pulse durations. The results were more than 100 papers in the laser ionization by collaboration with different theoretical groups. In 90's they developed a program that could calculate the ionization rate and ion yield in different models such as PPT and ADK for atoms and molecules. This program was employed to calculate all theoretical curves used in this thesis. More recently Gingras et al [15] performed an experiment for wavelength and intensity dependence of short pulse laser on single and double ionization of Xe. They
Chapter 1 : Introduction
used 50 fs laser pulses and 500 nm to 2300 nm wavelength to show ion yield versus intensity in different wavelength and compared the results with PPT model.
In 1998, Larochelle et al [16], by comparing the experimental data with different theoretical models for ionization rates such as PPT, ADK, SFA (strong-field approximation) [17] and Szoke's model [18], found that the inclusion of the effects of the long -range Coulomb potential of parent ion through quasi-classical perturbation theory on ionization rate (PPT model) gives a rather good overlap with the experimental results. They also examined Krainov's model [19], which included the Coulomb correction in SFA model, and showed that in the limit of y ~ \ , Krainov's model and PPT model give the same results. This indicated the gauge independency of these models. This is a remarkable result noting that SFA model suffered from being gauge dependent. The most important contribution of Larochelle et al was the use of the C„*,/* factor of the ADK model ( for y « 1), in the PPT model thus enabling the application of the PPT model to the case of complex atoms. The calculated ion rates agreed well with the experimental data. The range of validity was argued to be y < yc r, where, the quantity ycr is given by
ycr=(A2E~lla>)cT„ (1-12)
where, cr(Tis defined as the limiting value of o~ for which the following equation has a real solution for the dummy variable r :
i f c o s h ( r ) - l - I ( s i n h ( r ) - y ) ) = L J ° . (1-13) y \ 2 J \smh(T)-y
They showed that the ionization of rare gas atoms interacting with 800 nm TkSapphire pulses with durations below 200 fs occurs in the validity domain of the PPT model. For instance, in references [16, 20], it has been shown that the ion yield versus intensity curve of Ar in 200 fs, 800 nm pulses, for which ycr =9.4and the ionization occurs mainly in the range 0.7 < y < 2.5, can be satisfactorily fitted with the PPT model.
Chapter 1 : Introduction
1-6: Ionization suppression
The interaction of laser field with diatomic molecule has been studied both experimentally and theoretically. Earlier, some experiments C02 lasers by Chin et al [21,21] and Walsh et al [22, 23], had shown that the laser field ionization signal of diatomic molecule and rare gas atoms with the same ionization energy, Ej, are the same. In 1996 Talebpour et al [24] using TkSapphire laser found that the ionization rate of O2 molecule is greatly suppressed compared to that of Xe even though the ionization potential of the two species are similar (E,xe/Ejo2 = 1-005). They explained their observation as electron re-scattering and dissociative recombination of O2 . Guo et al [25] in 1998 showed that, the suppression of O2 is independent of polarization of laser field and the suppression should be related to the electronic structure of molecule. All experiments showed that N2 has only a small ionization suppression compared to Ar. Later on, Talebpour et al [26, 27], studied the ionization suppression of the D2 , O2 , N2 and introduced a single parameter Zejf to fit the PPT model to the ionization signal of molecules. This parameter is an empirically determined quantity that approximates the ionization suppression by assuming the tunneling of an electron from a Zejj/r barrier instead of purely Coulombic barrier of 1/r used in the case of rare gas atoms.
Recently, several groups have studied the ionization suppression in different molecules. For example, in 2000 Haskin et al [28] showed that the ionization suppression occurs in 23 organic molecules. Also Muth-Bohm et al [29] proposed that for diatomic molecule, the suppression effect can be visualized as due to an effective destructive interference between the two subwaves of the ionization electron emerging from two atomic centers. Similar conclusion had been reached by Talebpour et al [30] in connection with the multiphoton ionization of the unsaturated hydrocarbons. Today, the ionization suppression has been observed in different kinds of molecules such as diatomics [Error! Bookmark not defined.- 23], hydrocarbons [28], unsaturated hydrocarbons and biomolecules [30], chlorinated and fluorinated benzene [31]. In conclusion, at Ti:Sapphire laser wavelength ionization suppression in molecules appears
Chapter 1 : Introduction
to be a general phenomenon [32]. In chapter 4 we will show that the degree of suppression (indicated by the parameter ZeJj) is similar for unsatured hydrocarbons. 1-7: Multiple ionization and non-sequential double ionization
Under the effect of oscillating external field, an electron with acquired kinetic energy can return to the parent ion and interact with it. Several processes could result from this interaction. The electron can recoil elastically as well as inelastically. The electron could recombine to parent ion and high harmonic generation occurs, or the electron could send out another electron and produce multi-electron ionization. This process is known as the non-sequential ionization. The case of non- sequential double ionization can be described as the following:
A laser > A++ e ~
j + return-electron A + + i ") o ~
The phenomenon of non-sequential double ionization of atoms exposed to intense laser fields has been the subject of many theoretical and experimental studies for several years. First in 1993, L'Huillier et al [33] observed a knee structure on the Xe++ ion signal versus peak laser intensity curve. Two mechanisms have been proposed for explaining the occurrence of non-sequential ionization. The shake-off model of Fittinghoff et al [34] and the electron re-scattering model. The electron re-scattering model, was proposed independently by different groups such as Kuchiev [35, 36], Corkum [37], Becker [38] and Faisal [39]. According to the shake-off model, the electron is ionized by laser field so rapidly that that the remaining electrons do not have time to adjust themselves to the new energy state. After Thus, there is some probability that the second electron is excited to the higher energy level or ionized.
The electron re-scattering model describes that, when an electron is tunnel ionized, it interacts with oscillating laser field. If the electron has been ionized with proper phase of the field, it may pass by the position of parent ion in the next half cycle. It has been found that the non-sequential ionization rate is strongly polarization dependent [40] and is strongly suppressed for circular polarization. The wavelength dependency has been showed by Kundo et al [41 ]. A famous experiment has been done by Walker et ai [14] on He with linearly polarized 160 fs and 780 nm wavelength. They found that the enhancement of a doubly charged ion in lower laser intensity is proportional to the
Chapter 1 : Introduction
tunneling rate for neutral atoms. Chin's group set a systematic series of experiment on multi-ionization on the rare gas atoms. For example they [20] observed up to Xe6+ and fit their experimental date with some theoretical models. The most important conclusion of their work on rare gas atoms was the observation of a relation between the rate of non-sequential ionization to any charge state and the rate of quasi-static tunnel ionization (given by the ADK model) to the previous charge states [42]. Their finding can be summarized by the following relation.
So hi l , A+ +) = auSA D K( l , A+) + s J l , A+ +) (1-15)
The observed ion signal of the doubly charged ion A++, S0bS(I;A++), as a function of peak laser intensity, /, consists of two distinct parts. At lower laser intensities, the signal results from the non-sequential double ionization of neutral atoms and its rate is proportional to the rate of ionization through quasi-static tunneling. At higher intensities, the contribution from the sequential ionization of A+ ions, Sseq(I,A++), dominates the signal. Comparing theoretically predicted ion versus intensity curves of rare gas atoms interacting with TkSapphire laser pulses with experimental measurements, Larochelle et al. [16] have shown that Sseq(l,A++) can be satisfactorily predicted by the PPT model.
SADK(LA+), in relation (1-15), is the signal of those ions that are generated through
A—i"0"-"""'0 >J4+ channel. This implies that the non-sequential double ionization is
related to the ejection of electrons from neutral atoms via tunneling through a quasi-static barrier.
1-8: About this thesis
After reviewing a brief ionization history and some theoretical aspect in this chapter as an introduction, in chapter 2 the experimental setup will be described. This experimental setup includes the TkSapphire laser system, interaction chamber, experiment procedure as well as system and intensity calibration. In chapter 2, the setup for two-color ionization is also explained. Chapter 3 is devoted to the two-color ionization for estimating the contribution of quasi-static tunneling and multiphoton ionization in total ion signal in rare gases. In Chapter 4, we explain the experimental results in non-sequential double ionization in some hydrocarbons. In chapter 4, it has been shown that the source of non-sequential ionization could be the quasi-static tunneling. One of the
Chapter 1 : Introduction
applications of ultra-fast laser pulses for highly selective mass spectroscopy is suggested
in chapter 5. Using the ultra-fast laser we can demonstrate that the differences between
the two mass spectra are much more pronounced than the corresponding spectra prepared
by 100 eV electron ionization ion source.
Chapter 2: Experimental setup
Chapter 2
Experimental Setup
Our experimental setup consists of three subsystems; a laser chain system to produce femtosecond laser pulses, an interaction chamber equipped with the time of flight mass spectrometer and laser beam delivery setup to focus the laser pulse into the interaction chamber. In this chapter each subsystem will be described in detail.
2- 1: Laser system
The laser system contains a laser chain that can simultaneously deliver three femtosecond laser beams with different repetition rates. The laser chain is custom built by the Spectra Physics Corporation. Like most ultrafast high power laser systems the laser chain is based on the Chirped Pulses Amplification (CPA) technique invented by Donna Strickland and Gerard Mourou in 1980 [13].
The block diagram of the laser chain is presented in Figure 2.1.
2-1-1: Oscillator
The oscillator (Tsunami, Spectra Physics) is used to generate the seed femtosecond pulses. It is pumped by Millennia (Spectra Physics) that could deliver 5 Watt CW laser beam at 532 nm wavelength output. Millennia has a Nd:YV04 crystal that is end pumped by diode laser and emits 1064 nm wavelength. An internal cavity LBO crystal is used for second harmonic generation. The Ti: Sapphire crystal in the Tsunami is pumped by continuous 532 nm laser beam of Millennia and could oscillate at 74 MHz to deliver 25 fs laser pulses to the Spitfire box that contains stretcher, regenerative amplifier and compressor. Figure 2 -2 presents the schematic diagram of the Tsunami.
n. -t/i 2 u E s D. y. r i — U «— Q. RI J Z
si 017
'ZH^Ii
Jt
asind/pLU 2= jndino Jase
!
X
\—
o
OT Q . OPuis
e
Slice
r
CD i— •—» Q . CO OT Q . O*
n CD i— •—» Q . COO
t 01
OT
I =31
CL r 1 CL rr
i CL i—1
i—1
CD t»^
1
"5.
IE
1<
1
1— CDOT
M—OT
1 ^ ro'
Q . Q.1
E
CD (D CM i 1<
J D . C1
c M— O CD 5 ^ (D CO1
D ) CDcr:
JD TD CD 1 _ (D CO1
D ) CDcr:
JD TD CD 1 _ t CD1
>
N 1 ^ X ik CD TD X i ^ TD CD O1
1
Q .E
"2 i
1
1
Q .E
Is
e
tow
a
se
r
syst
e
Q . CD TD Ob
Is
e
tow
a
se
r
syst
e
Q . CD TD Ob
Is
e
tow
a
se
r
syst
e
!
t i Q . CD TD Ob
S. .s
" D CD CDOC uoiin|OA3
1S. .s
" D CD CDOC uoiin|OA3
I ÇO ( 0 ' c ( 0 C*<
_ÇDI^E
jojenpso iLueunsi
jojenpso iLueunsi
0< r i U —g
— ;= "Ë.1
>1
U C u CU ■_> c en O 2 E u t/3 = et• 1 CO 5 S /> £ 5 y y CD -D <Z ~ c
3*
3 o o - '1
^ ^\OT, 1
^\OT < D " ^ E tu "O ^ E > o ro "DS
Q O O o O Q. o II < 1 < CO < LL 2r
k
O < c B u tn "3 u E u tu D. X ri •— u c - C <D Q> O Q-C fc ro 3 tu CL JO o ca O E E ca E ed L. 00"3
cj 03 E u JS CJ tVJ ri i fN i l U 3 S£ i lChapter 2: Experimental setup
The Tsunami is a mode-locked laser; the acousto-optic modulator (AOM) ensures reliable mode-locked operation at laser start up. It also allows the laser to operate for extended periods without dropouts or shut downs that often take place in standard passively mode-locked systems. The Tsunami is wavelength tuned using a sequence of four prisms and a slit. The prism sequence provides a region in the cavity where the wavelengths are spatially spread. The variable slit is located in this spread beam. The output wavelength is tuned by changing the position of the slit in the vertical plane. The width of the slit can also be changed to vary the bandwidth of the output pulse. The optical components inside the cavity introduce positive GVD (Group Velocity dispersion) and cause pulse spreading. Further pulse spreading is caused by SPM (self phase modulation) in the Ti: Sapphire crystal. In order to obtain stable and short optical pulses this effect must be compensated with negative GVD. For this purpose the two prism pairs are used to produce negative intra-cavity GVD. The oscillator produces a pulse train at a repetition rate of 74 MHz with a central wavelength of 802 nm. The energy per pulse is ~6 nJ, the spectral width is 40 nm (FWHM) and the transform limited pulse duration is about 25 fs (FWHM).
2-1-2 - 1 kHz Laser Beam
Spitfire is the name of the box that contains a Faraday isolator, pulse stretcher, regenerative amplifier, two-pass amplifier, pulse sheer and a pulse compressor. The Spitfire has two inputs and two outputs. The first input is the seed pulse train from Tsunami and the second input is the green beam from Evolution 30 (Positive Light) intended to pump the Ti:Sapphire crystals of the regenerative amplifier and two-pass amplifier. Evolution 30 is a diode pumped Nd:YLF commercial laser in nanosecond regime with LBO as a second harmonic generation crystal. First output of the TkSapphire system is 1 kHz laser pulses from compressor and second output is the 10 Hz seed from pulse slicer toward 10 Hz laser amplifier system as shown in Figure
2-1.
Chapter 2: Experimental setup
The input pulse from the oscillator is stretched to about 200 ps in the stretcher and
propagates to the regenerative amplifier for further amplification. In Figure 2-3, the
schematic diagram of inside the Spitfire has been shown.
m r. G C eu
Oscillateur
Tsunami
%Evolution 30
f
0 0 X
u t« U E *— u r i L . U — es ta \ f t r > / / / . CJJ e O (/) 73 0 u Q. S, S \ o yo
I l5 ( S l
CL 03 O fe * ■ <D " ô S c X o £ Q)* O co "* 3 ^ E , CM u 'a. 03 t * . o E L W) _ra ■5 o ra E U C CJ «s ilChapter 2: Experimental setup
There are two Pockels cells inside the regenerative amplifier that change the polarization of the beam with a time delay. The delay can be controlled by a Signal Delay Generator (SDG) electronic box. By turning on the first Pockels cell a pulse is injected into the regenerative amplifier and after about eleven full round trips inside the cavity of the regenerative amplifier the pulse will be extracted by turning on the second Pockels cell.
The output beam from the regenerative amplifier has 1 kHz repetition rate. Then the pulses are sent to a pulse sheer unit. The pulse sheer is a combination of the third Pockels cell with polarizer and located after the regenerative amplifier, when it is turned on, the sheer could send out a 10 Hz beam from 1 kHz toward the 10 Hz terawatt laser system. The laser beam will pass through to the two-pass amplifier and compressor to give a 1 kHz laser beam with energy of about 2 mj per pulse with 40 fs pulse duration (FWHM).
2-1-3: Terawatt laser system
Most of experiments in this dissertation have been done with the 10 Hz, terawatt laser amplifier system that is shown schematically in Figure 2-4.
The 10 Hz seed beam coming from slicer in the Spitfire will split in two parts to be separately amplified in a two pass amplifier and a four pass pulse amplifier. These amplifiers contain Ti: Sapphire crystals that are pumped by two commercial Nd:YAG lasers. Quanta Ray 1 & 2 are high power flash lamp pump Nd:YAG laser oscillators and amplifiers with KDP as a second harmonic crystal.
The output from the two-pass amplifier passes through a compressor to generate 800 nm, 0.2 TW, 40 femtosecond beam at 10 Hz and the four-pass amplifier beam propagates through vacuum compressor to generate 800 nm, 2 terawatt, 40 femtosecond beam at 10
Hz.
ro Q. ro t—< c ro 3 O CM ro ÛL ro c ro O CD Q. E < w If) co Q . E 3 3 O ro > o CT) OT CD L _ CL E O O IT) o N * O 3 T Q. . 3 0
S sa
L 3s ^
.3 E
o . O 0J "o. E ra ra ra c 3 — U "râ — c «J E '•— Q -LU ri ' Ja
ra C Ojayndujv ssed 2
<:#" ^ CD _W ! 3 j C L T D I CD CD I CO1 M— m O N o Z X CD OT "ô OT ■S CO ro i i"5 °
•» t . Q. 3 CD° E
0 o O O OT° E
0 o O i 3 CD C L co < ro "2 J E o CM E ra '— Bfi ra c j CQ eu S SXChapter 2: Experimental setup
400 nm laser beam
Two-color ionization and pump probe experiments need 400 nm laser pulses. The 400 nm beam is generated by means of second harmonic generation using KDP crystal.
Changing the duration of the laser pulses
In some of our experiments it was necessary to increase the pulse duration of the laser beam to compare the long and short pulse effect in the ionization of atoms and molecules. For this purpose a band pass filter centered at 800 nm is set right after the oscillator. This reduced the width of the spectrum from 23 nm to 10 nm. The new bandwidth tailored seed after amplification and compression produced 175 fs transform limited laser pulses.
2- 2: Interaction chamber
An ultra vacuum chamber equipped with a time of flight (TOF) mass spectrometer is used to investigate the interaction of ultrafast femtosecond laser pulses with atoms and molecules. The main function of the TOF system is to separate and measure the number of different ions produced in the interaction volume situated at the focal region of a lens at different laser intensities. This measurement requires a system to separate the different ions created at the interaction volume from one another and at the same time have a capability of detecting very small number of ions (few ions). With this system one could measure the difference in the ratio mlq (m the mass and q the charge ) of the ions using their respective time of flight (TOF) between the source and the detector.
The vacuum chamber is equipped with an oil free mechanical pump followed by a turbo pump that could be having a background pressure of 3X10" torr. A schematic diagram of the interaction chamber and TOF mass spectrometer is presented in Figure 2-5. Ion species are collected using TOF mass spectrometer having a 60 cm drift tube (d4 = 60 cm). The laser beam is focused into the centre of two plates PI and P2 spaced by 5 mm (dl = 5 mm). The voltage applied to PI and P2 are 4.0 kV and 3.5 kV respectively and are chosen in order to avoid space charge effects. The distance between P2 and the entrance of the grounded TOF tube is 26 mm (d3 = 26 cm). Ions are detected at the end of
Chapter 2: Experimental setup
the tube with an electron multiplier tube (EMT) and recorded on a digital oscilloscope
coupled to a computer. The diameter of mesh on opening at P2 is 25 mm (d2 = 25 mm).
This opening of the entrance of the TOF tube restricts the region of the focal volume
from which ions are collected. This has been designed in order to minimize the gathering
of ions from regions of low intensity compared with the maximum intensity in the focal
volume. This helps to minimize space charge effects on the collection of higher-charge
states. The entrance diameter of the detector is 25 mm. When an ion arrives at the EMT,
it creates around 10
6electrons which via a coaxial cable create a current in a 50 Q load
resistor inside the digital oscilloscope. The length of the pipe with entrance window is 94
cm (d5 = 94 cm). A 1 m focal length lens could be located in front of the entrance
window to focus the laser pulse between PI and P2. By opening the extension pipe one
can change the length of d5 to 44 cm for using a 50 cm focal length lens.
X . C B u r râ C u E — u C . UJ r i D. ra J=
u
u 25 E ra c CJ -— JZ t / j O u E o E E ca° — CJ râ E u ■c CJ 05 i g = =1Chapter 2: Experimental setup
2-3: Experimental procedure
The ionization experiments are performed by taking the following steps:
1- Starting the vacuum chamber and baking the system to go to the high vacuum with the pressure around 3x 10"9 torr. One may need to keep running the system for a week. 2- Start the laser chain and try to get an acceptable spatial quality of the laser beam and stability of laser pulse from shot to shot by warming up the laser chain, then by adjusting the grating of the pulse compressor to get the transform limited pulses. The spatial quality of the laser beam is determined by a CCD camera and the beam profile should be gaussian with roundness around 95%. The temporal quality and profile are determined by a single shot autocorrelator. Figures 2-6 and 2-7 show a sample of autocorrelator signal for pulse duration and beam profile after pulse compressor.
3 -The laser beam should be aligned somehow to have the focal point of the lens in the middle of PI and P2 in the chamber. For this purpose it is better to put the lens in three dimensional translation stages and it is very helpful to use a He-Ne laser for pre-alignment of system.
4- The detector head of energy meter should be located in the output of chamber or in the back of last mirror to record the relative energy of the laser pulses that are used for the ionization.
5- A computer with GPIB card should run a LabView program to control i) the half wave plate in the pulse amplifier for changing the laser pulse energy, ii) the energy meter via GPIB cable and iii) the digital oscilloscope that reads the ionization signal as a mass spectrum from EMT connected via GPIB cable to the computer.
Ion curves are produced by combining a series of intensity scans with different fill pressures in the interaction chamber. The gas pressure in the interaction chamber is controlled by a precision leak valve and ranged from 10"8 to 10"4 torr. Higher pressures can only be used for low ion numbers since space charge effects and detector saturation have to be avoided.
Chapter 2: Experimental setup 2.1 - , 1.4 -xi < ™ 0.7 -o> CO 0.0 -2.1 - , 1.4 -xi < ™ 0.7 -o> CO 0.0
-FWHM= 47 fs A
2.1 - , 1.4 -xi < ™ 0.7 -o> CO 0.0-FWHM= 47 fs A
Gaussian fit 2.1 - , 1.4 -xi < ™ 0.7 -o> CO 0.0 -2.1 - , 1.4 -xi < ™ 0.7 -o> CO 0.0 -I , | . | . | . | i | i | i | 900 1000 1100 1200 1300 1400 1500 1600 Time (fs)Figure 2-6: Signal from autocorrelator for pulse duration measurement. The full width of half maximum is around 47 fs.
Chapter 2: Experimental setup
Figure 2-7: Beam profile after pulse compressor
Chapter 2: Experimental setup 2-4: Calibration
2-4-1: Mass spectra calibration
In order to characterize the mass spectrum that is obtained by the digital oscilloscope w e need to convert the time to m/q ratio. A s it was mentioned before the voltages applied to Pi and P2 are usually Vj=4 kV and V2=3.5 kV, respectively. The time o f flight of an ion, Tf, with mass m and charge q (from the interaction region to the detector) is calculated to be: «/, d,(j(Vl+V2)/2-J(Vl-v2)/2) dA -r \2m \ (2.1). p(l\-V2) V2 J2(VI +V2)/
where dl to d4 are the dimensions of interaction chamber according to Figure 2-5. This relation shows that the ions with different ratios of m/q have different flight times. In practice a quadratic relation between 7}-and m/q is assumed as follows:
- = A0 + A,Tf +A2T2 f (2.2).
<7
If the time of flight of three different peaks with specific m/q (standard peaks) are known then the constants A, can be determined.
As an example of demonstrating a mass spectrum, the mass spectrum of propene (C3H6) is presented in Figure 2-8. As it can be seen from this figure the molecule goes through fragmentation process during interaction with femtosecond laser pulses and produces different peaks related to different ions.
Chapter 2: Experimental setup
C H M a s s S pectra
3 6 5 — H +f v i r p
fry "
VYlrtf
vv 1 iWf
1
T 4 — XJ C3H6 + »ignal( c J i ^ D + C c> C 3H3 + 2 — i i I i 1 1 ' 1 C3H6 ■ 1 0 4 8 12 16 20 24 2! m/q 32 36 40 44Figure 2-8: A samples of calibrated mass spectra of propene (C3H6).
2-4-2: Intensity calibration
In order to characterize the femtosecond laser pulses, the energy, the pulse width and the focal-spot size were measured. The energy measurement was taken off from the leak of mirror situated after the interaction region and was detected with an energy-meter controlled by a computer (Figure 2-I0). The pulse width was measured by a single pulse second-order autocorrelator (Figure 2-6). Through direct measurements, it was found that the fluctuations of the pulse width were not correlated to the fluctuations of the energy. This means that by increasing the pulse energy, the pulse duration does not vary significantly. This allows measuring the intensity by measurement of the energy. For measuring the focal spot size, the beam was attenuated by successive reflections from high-quality glass plates (wedges). The beam was then focused by the 100 cm focal length lens and the image of the focused area was analyzed by an calculated objective
Chapter 2: Experimental setup
lens and a CCD camera. With the 1 m lens, the focal spot diameter (at 1/e2) was found to be 102 microns (Figure 2-9). The beam had a nice gaussian profile and a roundness of 0.95.
Wedge
Beam
dump
f = 100 cm
CaF
2window A
ND filters
li
f=50cm
Figure 2-9: The experimental setup for measuring the focal spot size. The CaF2 window is identical with entrance window of interaction chamber.
The absolute-intensity calibration is based on comparison of the saturation intensity predicted by the ADK formula, in the case of helium. As already observed by Walker et al 1994, near the saturation region, the experimentally measured He+ signal in a Ti:Sapphire laser field has an excellent overlap with the ion yield predicted by the ADK theory within a precision of 15% of the intensity. Intensity calibration of other experimental curves is established in comparison with that of He and is thus free of any assumption on the validity of the ADK model for these gases. The calibration technique used in these cases was to scan successively the saturation part of all gases without, changing the experimental conditions between two runs. The saturation intensity of each gas could then be obtained in comparison with that of He, thus establishing the
Chapter 2: Experimental setup
calibration. The accuracy in the relative-intensity calibration between one given ion curve and the reference He curve is estimated to be 5%.
2(4) pass amplifier 10 Hz Laser Seed Beam dump
Figure 2-10: Schematic diagrams of beam delivery and measurement instruments.
To study the intensity dependence of the ionization (or fragmentation) process, ion curves are produced by combining a series of intensity scans, each having a different fill pressure in the interaction chamber. The gas pressure in the chamber is controlled by a precision leak valve and ranges from 10" to 10"4 torr. Higher pressures could only be used at low intensity, hence producing low ion number, since space charge effects and detector saturation have to be avoided. It has been observed that the saturation of the electron multiplier starts when the signal is more than 200 mV on the oscilloscope with a 50 Q termination. Thus the highest signal voltage accepted is 200 mV. Figure 2-11 shows a typical ion yield signal vs. peak intensity curves at different fill pressures for Kr+. As it can be seen, there is some detector saturation at higher pressure (the data in saturation of detector is not real and should be deleted), but in the lower pressure and in the higher
Chapter 2: Experimental setup
intensity such that the ion signal does not exceed 200 mV on oscilloscope, it will be real saturation in ionization, that occurs when all atoms in the interaction region are ionized. The intersection of the two lines drawn tangent to the ion signal curve vs. intensity in the log-log plot, is defined as the saturation intensity. The saturation behavior of the curves provides a fixed point for comparison of theoretically calculated ion curves and experimental data. 1 07^ 10" "! < cf 104 -c W 3 C 10 O 10' 101 1E13 Kr+ Ion signal Saturation p_>int Saturation ■ P=2x10 Torr • P=4x10"6Torr A P=5x10⁸ Ton-Intensity Intensity W/cnV 1E14
Figure 2-11: A sample of ionization curve in different fill pressure and saturation intensity
Chapter 2: Experimental setup
2- 3: Laser beam delivery setup
Figure 2-10 shows a schematic of a simple beam delivery set up that introduces the laser pulse into the interaction chamber. Because of self focusing effect of short pulses propagating through optical media, it is preferred to use reflecting optics or very thin lenses and windows wherever possible.
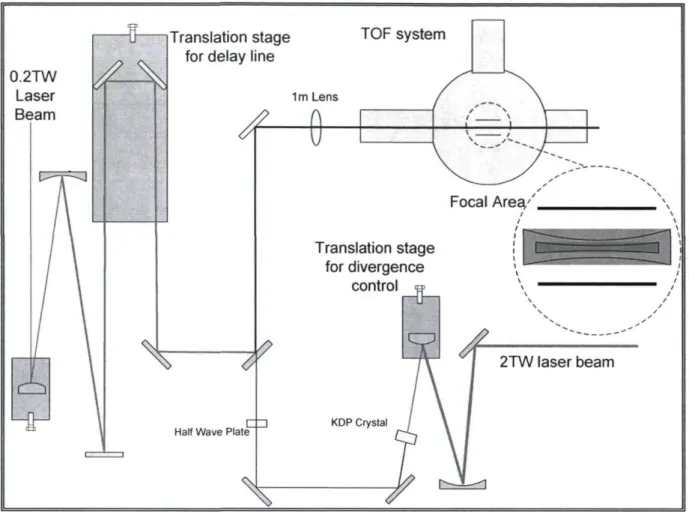
In the two-color interaction experiments the setup of Figure 2-12 has been employed. As it can be seen, two laser beams of laser chain are used for this setup. The 800 nm, 0.2 TW laser beam after reflecting from a telescope has larger diameter and goes through the 60 cm delay line for adjusting the delay between two laser pulses. The 800 nm, 2 TW laser beam will decrease the diameter after reflecting from telescope. This beam will pass through a KDP crystal to generate the second harmonic of 800 nm. This design has been selected for controlling the focal point of 800 nm laser beam and 400 nm laser beam in the interaction volume. With this set up, one could have very good control of the spatial overlap and also temporal overlap of two laser pulses in the chamber. The diameters of laser beams on the focusing lens have been adjusted somehow, such that in the focal zone the 400 nm laser pulse could cover the interaction volume.
Chapter 2: Experimental setup
Translation stage for delay line 0.2TW Laser Beam TOF system 1m Lens Focal Area/. Translation stage for divergence control KDP Crystal 2TVV laser beam
Figure 2-12: The experimental setup for two color experiment.
As an example of demonstrating the overlap of two laser pulses in the chamber, we put a mirror just before the window of the chamber and reflected the two pulses in the air. Figure 2-13 shows these two pulses when they are overlapped in time, and when they have a delay. It is very clear when the delay is zero we have good overlap. The diffraction pattern appears in the image surface at far field.
Chapter 2: Experimental setup
Figure 2-13: The top picture shows the overlap of 800 nm laser pulse and 400 nm with diffraction pattern. The second picture without diffraction pattern is taken when there is a delay between 800 nm laser pulse and 400 nm.
Chapter 3: Contribution of quasi-static tunneling and multiphoton ionization
Chapter 3
Contribution of quasi-static tunneling and multiphoton processes in the
ionization of Ar and Xe.
In this chapter the ionization of Ar and Xe in a dichroic pulsed laser field, comprising the fundamental and second harmonic of a Ti:Sapphire laser, was studied. The ion yield was found to depend on the angle between the polarization vectors of the two fields. The dependency was explained by proposing a model that considered the ionization process to be resulting from the action of two independent mechanisms, namely, the quasi-static tunneling and multiphoton ionization. The content of this chapter is adopted from an article recently published [43].
3-1: Experimental setup considerations
Here we explained the details of the experiment because we need it for better interpretation of results. The schematic experimental setup is shown in Figure 3-1. A Ti: Sapphire laser system provides a 10 Hz train of 800 nm pulses having a full-width-at-half-maximum time duration of 150 fs. A KDP crystal of thickness 2 mm, and phase-matched for the second-harmonic generation, was used to produce the 400 nm pulses whose characteristics will be explained later in this section. The fundamental and second-harmonic beams emerging from the doubling crystal are passed into a Michelson interferometer with a dichroic beam splitter. The IR arm of the interferometer includes a wave plate oriented such that the angle between the polarization vectors of the two beams, 9, can be varied in the range of 0 to TC/2. The laser pulses from both arms of the
Chapter 3: Contribution of quasi-static tunneling and multiphoton ionization
setup were collinearly focused using a 10-cm focal length concave mirror in the vacuum
chamber.
The spatial and temporal overlaps of these pulses were monitored by cross correlation
technique, explained below. Through measurement of spectral width and pulse duration
we ensured that the red (co) pulses were transform limited. In addition, we had access to a
more reliable method to calibrate their intensity at the focal region: The absolute intensity
calibration is based on a comparison with the saturation intensity predicted by the ADK
formula in the case of helium [14] as explained in chapter 2. In contrast to red pulses,
there is no established method to measure the peak intensity of the focused blue (2co)
pulses with reliable accuracy. In this case we determined the intensity by estimating the
focal spot size and the pulse duration. It is well known that this method is not accurate
and the reported intensities of the blue pulses are associated with large uncertainties.
Chapter 3: Contribution of quasi-static tunneling and multiphoton ionization
Experimental
Setup
FU
^f
FM * ~ \Translation Stage 4oonm
for delay Line Half W a v e P l a t e I
Into the rotational stage i
B — i
MPA 800nm * î VB S 1 800nm + 400nm 800 nm laser pulse KDP Crystal ■■■' iiiiiii"iiiiin|s*i I L™™™™™ TOF System 800nm + 400nm ^ ^ "Figure 3-1: Schematic diagram of the experimental setup for two-color multiphoton process studies where, BS1: Harmonic separator HR@800 nm, AR/HT@400 nm; BS2: Harmonic separator, HR@400 nm, AR/HT@800 nm; MPA: Micrometer piezoelectric actuator; FA: Fixed arm ~400-nm arm; FM: Folding mirror.
The temporal envelope of the blue pulses was estimated numerically using the method of reference [44] and was presented as the "numerical prediction" curve in Figure 3-2. The calculation has taken into account the group velocity dispersion for 800 nm and 400 nm pulses. The resulting group velocity mismatch stretches 400 nm pulses and is manifested by the long tail that follows the main pulse. The curve was compared with the experimental data that were obtained by measuring the correlation of the red and blue pulses. The two pulses were sent through a BBO crystal and the strength of the
Chapter 3: Contribution of quasi-static tunneling and multiphoton ionization
frequency signal was measured. The measurement was repeated by varying the delay between the pulses, by which the amount of overlap of the pulses is varied. The measurement result is presented in Figure 3-2 as "experimental sum-frequency signal". As it is observed the 2co pulses are not gaussian in the temporal domain and have a long tail. The duration of these pulses is about 300 fs rather than the theoretical value of 150/v2=100 fs. This indicates that the 2co pulses undergo pulse broadening due to group velocity dispersion in the crystal, which accompanies spectral narrowing but not chirping. However, the pulse tail indicates the presence of chirp. This gives rise to a lack of a definite phase difference between the co and 2co pulses over all cycles during the interaction process and may partially account for the masking of the known phase dependence of the ionization rate [45, 46] as it will be discussed in section 3.2.1.
After setting the energies of the pulses, which correspond to the working intensities, the gas under study was introduced in the vacuum chamber through a leak valve and the pulses were focused in the interaction region. The resulting ions were detected by the TOF (time-of-flight) mass spectrometer and the ion signal was determined by integrating the corresponding peak. The reported signals in the following sections are averaged over
10 events.
Chapter 3: Contribution of quasi-static tunneling and multiphoton ionization 120 X! O) c/> CD
b
o
1008 0 6 0 4 0-20 Experimental sum-frequency signal
Numerical prediction 0--600 -400 i — i — | — i --200 0 200 400 600
Time delay / fs
Figure 3-2. The numerically calculated temporal shape of the 2co pulses are compared with the experimentally measured shape through the sum-frequency measurement by a BBO crystal.
3-2: Experimental results and discussion
The working intensities of the two pulses were fixed at Ia = 1.5xl014 W/cm2 and I2 n = 1 x 10B W/cm2 and their energies were accordingly set. The criterion for selecting the intensities was to provide an ionization regime where the contribution of quasi-static tunneling and MPI in the total ion signal are almost similar. In this respect, our guideline was the published results of reference [20], which is presented in Figure 3-3. Moreover, the intensity of the 2co pulses was chosen to be much smaller than the intensity of the co pulses to minimize the dependence of the ion signal to the relative phase of the two pulses for the reasons which will be discussed later in this section.
Chapter 3: Contribution of quasi-static tunneling and multiphoton ionization
Before attempting to explain the observed trend of the ion signal, it is useful to review the main features of the ionization of Ar interacting with co (Ti:Sapphire) pulses. In figure 3-3, we have reproduced the ion signal versus peak laser intensity curve that was reported in reference [20]. As it is observed the curve calculated based on the PPT model satisfactorily fits the experimental points. The ADK curve, which indicates the contribution of ions produced through the quasi-static tunneling (QST), is below the measured signal over the whole intensity range. Its contribution to the ion signal monotonically increases from a negligible value of under 1% at Ia = 4.5 x 10¹³ W/cm2 to 50% at our working intensity of Ia) = \.5x\0] 4 W/cm2. We postulate that the ADK theory provides the ion contribution from quasi-static tunneling while the rest of the ions are produced through "pure multiphoton" process, which will be defined later. Accordingly the red pulse-induced total ion signal, Sg00, at the peak intensity Im can be written as5800 = So s r 800 + SM P l 800. At an intensity Ia - 1.5 x 10¹⁴ W/cm2, it is observed from Figure 3-3 thatS^, 800 » 0.5 x S ^ . This implies that the majority of ions are produced through pure multiphoton process. The Keldysh parameter, ysoo. at the working intensity is 0.9 and contributions of both processes are expected to be of the same magnitude. In contrast, the Keldysh parameter, y4oo, at the working intensity is calculated to be 7. Therefore, when the 2co beam is acting alone the ionization process is dominated by "pure multiphoton", thus Sm ~ SMI>I ,4oo •
Chapter 3: Contribution of quasi-static tunneling and multiphoton ionization 1 ■ Ar*, Exp. 1 0 - o PPT » . m - S ADK fm' 1 JO. 1 i o \ JF»
s
: / m m m u l t i p h o t o n J2 w * £ & = 10"3 -C i A m * » n ^m £ JLM S *- . „ - 4 fw < 1x10 _ c " • ^ r //Sr 1 j a r C / m.5»
/ M? 1x10%
£^F _o j r ^s
' , QST 1 0 % fir * : * * • i o -7- / * •* 1 1 10" I n t e n s i t y (W/cm2)Figure 3-3: The total ion signal of singly charged Ar ion produced in interaction with Ti:Sapphire laser pulses are plotted as a function of peak laser intensity [20]. The two curves denoted by SPPT and SADK are calculated using the PPT and ADK
models.
3.2.1: The dependence of the total ionization rate of Ar on the relative phase of the co and 2to pulses
Ar gas was introduced into the interaction chamber. Then, the delay between red and blue was set to zero and their linear polarizations were made parallel. The area under the detected TOF peak was taken as the signal, and the maximum signal, for the sake of convenience, was set to 100 units. Then the blue pulses were blocked and the ionization was induced by red pulses, only. The signal of Ar+ was found to be Sgoo = 12.4 units in
Chapter 3: Contribution of quasi-static tunneling and multiphoton ionization
the normalized scale. The experiment was repeated by blocking the red pulses and letting the blue pulses. The signal was found to be S400 = 6.0 units. Finally, both pulses were focused collinearly with parallel polarizations. The delay between the pulses, T, was varied in the maximum rang o f - 1 4 0 fs to 140 fs allowable by the precise translation stage. The observed signals, as a function of delay time, are presented in Figure 3-4.
100 80-c 3 b 60 p i— *-' 0 i _ < 1—' 40 c-l p 5u 00 c n 2(J
. . . • • ^ t * - - . .
/ \ / /Measured signal
800 400 ■100 1 — i — i — 1 --50 1 ■ ■ 0 50 r—I—f—1—1-100 Time delay (fs)Figure 3-4: The ion signal of Ar+ simultaneously interacting with 800 nm and 400 nm pulses as a function of the time delay between the temporal centers of the pulses. The two temporal centers were determined by assuming that the zero delay is where the ion signal, or correspondingly the sum frequency signal of Figure 3-2, is maximum. The signals for either of the 800 nm and 400 nm alone are represented with straight, delay independent, lines.


![Figure 3-3: The total ion signal of singly charged Ar ion produced in interaction with Ti:Sapphire laser pulses are plotted as a function of peak laser intensity [20]](https://thumb-eu.123doks.com/thumbv2/123doknet/5597316.134589/56.898.177.680.146.654/figure-charged-produced-interaction-sapphire-plotted-function-intensity.webp)
