Université de Montréal
Role of Zinc Transporter LIV-1 Protein in High-Grade
Serous Ovarian Cancer
par Sarah Al-Rubaish
Département des sciences biomédicales Faculté de médecine
Thèse présentée à la Faculté de médecine pour obtenir le diplôme de maître des sciences
(M.Sc.) en sciences biomédicales
Directrice de thèse Dre Anne-Marie Mes-Masson
Co-directrice de thèse Dre Diane Provencher
August, 2018
Résumé
Le carcinome séreux de haut grade (HGSC) de l'ovaire est le cancer gynécologique le plus létal. Bien que les découvertes récentes aient fait progresser notre compréhension de l'agressivité du HGSC, les mécanismes moléculaires impliqués dans le développement de ce cancer demeurent peu clairs. L'une des principales caractéristiques des tumeurs agressives est leur capacité à métastaser. En général, les cancers épithéliaux de l'ovaire se propagent par extension locale, invasion lymphatique et implantation intrapéritonéale. Des études ont suggéré que la protéine LIV-1, un transporteur de zinc, joue un rôle important dans la formation de métastases dans différents tissus. Néanmoins, aucune étude ne rapporte le rôle de LIV-1 dans les métastases du HGSC. Nous avons donc étudié l’impact de LIV-1 sur le potentiel invasif et migratoire des cellules HGSC. Nous avons observé des niveaux d'expression variables du gène et de la protéine LIV-1 dans 14 lignées cellulaires du HGSC. Bien qu'une corrélation positive ait été observée entre l'expression du gène et les quantités de protéine LIV-1, cette corrélation n'était pas forte et non significative. Nous avons par ailleurs choisi cinq lignées cellulaires pour effectuer des tests biologiques, en fonction de leurs niveaux protéiques: TOV3133G et TOV2295(R) (haute), TOV2978G (moyenne), et TOV1369 et OV866 (2) (faible). Nous avons trouvé qu'il y avait une forte et significative corrélation positive entre les niveaux de LIV-1 et le potentiel invasif de ces cellules HGSC (R2 = 0.8666, p = 0.0216), mais une faible corrélation négative (non significative) avec le potentiel de migration (R2 = 0.4514, p = 0.2142). Des expériences d'ARNi ont montré qu'une expression réduite de la protéine LIV-1 inhibe la capacité invasive. Cependant, aucune différence significative n'a été observée en ce qui concerne la capacité de migration. Nos résultats
suggèrent que LIV-1 joue un rôle positif dans la progression tumorale de HGSC. Nous avons démontré que LIV-1 est impliqué dans l'invasion in vitro mais pas dans la migration des cellules HGSC, et que son expression est associée aux formes les plus avancées du cancer de l'ovaire, suggérant que LIV-1 pourrait être un marqueur potentiel de l'agressivité tumorale.
Mots-clés : Invasion cellulaire, LIV-1, migration cellulaire, cancer de l'ovaire épithélial,
Abstract
High-grade serous carcinoma (HGSC) of the ovary is the most lethal gynecological cancer. Although recent progress has advanced our understanding in the aggressiveness of HGSC, the molecular mechanisms involved in the development of this cancer remain unclear. One of the main features of aggressive tumours is their ability to metastasize. In general, epithelial ovarian cancers (EOCs) spread through local extension, lymphatic invasion, and intraperitoneal implantation. Studies have suggested that the zinc transporter LIV-1 protein has an important role in tumour metastasis in different tissues. However, there are no reports on the role of LIV-1 in HGSC metastasis. We investigated the role of LIV-1 in the invasive and migration potential of HGSC cells. We observed variable expression levels of the LIV-1 gene and protein in 14 HGSC cell lines. Although a positive correlation was observed between the gene expression and the quantities of LIV-1 protein, this correlation was not strong and not significant; thus, we chose five cell lines to perform biological assays, based on their protein levels: TOV3133G and TOV2295(R) (high), TOV2978G (medium), and TOV1369 and OV866(2) (low). We found that there was a strong and significant positive correlation between LIV-1 levels and the invasive potential of these HGSC cells (R2 = 0.8666, p = 0.0216), but a weak and negative correlation (not significant) with their migration potential (R2 = 0.4514, p = 0.2142). RNAi experiments demonstrated that reduced LIV-1 expression inhibits invasive capacity; however, no significant differences were observed in regard to migration capacity. Our results suggest that LIV-1 has a positive role in favouring the tumour progression of HGSC. We have demonstrated that LIV-1 is involved in the in vitro invasion but not migration
of HGSC cells, and that its expression is associated with more aggressive ovarian cancers, suggesting LIV-1 as a potential marker for tumour aggressiveness.
Keywords : Cell invasion, LIV-1, cell migration, epithelial ovarian cancer, high-grade serous
Table of Contents
Résumé ... ii
Abstract ... iv
Table of Contents ... vi
List of Figures ... viii
List of Abbreviations ... x
Acknowledgments ... xii
1 Introduction ... 1
1.1 Ovarian cancer ... 1
1.1.1 Statistics and definition ... 1
1.1.2 Anatomy of the ovary and fallopian tubes ... 2
1.1.3 Types of ovarian cancer ... 5
1.2 Molecular aspects of HGSC ... 11
1.2.1 TP53 and BRCA mutations ... 11
1.2.2 Markers of ovarian cancer with potential for evaluating the aggressiveness of the disease ... 14
1.3 LIV-1 structure and function ... 15
1.3.1 Role of LIV-1 in different types of cancer ... 17
2 Hypothesis and Objective ... 19
3 Materials and Methods ... 21
3.1 Cell lines and cell culture ... 21
3.2 Western blot ... 21 3.3 siRNA knockdown ... 22 3.4 Invasion assays ... 23 3.5 Migration assays ... 23 3.6 Microarray analysis ... 24 3.7 Statistical analysis ... 25 4 Results ... 26
4.1 Expression levels of LIV-1 gene and protein in different HGSC cell lines ... 26
4.2 LIV-1 and the invasion capacity of HGSC cells ... 30
4.3 LIV-1 and the migration potential of HGSC cells ... 32
4.4 Effect of LIV-1 knockdown by siRNA on HGSC cell invasion ... 34
4.5 Effect of LIV-1 knockdown by siRNA on HGSC cell migration ... 35
5 Discussion ... 40
6 Perspectives and Conclusion ... 43
List of Figures
Figure 1. Proportion of deaths due to cancer and other causes in Canada in 2012. ... 2
Figure 2. Anatomy of the ovaries showing the attachment and interdependency between the fimbrial end of the fallopian tubes and the ovaries. ... 3
Figure 3. Circulation of peritoneal fluid. ... 5
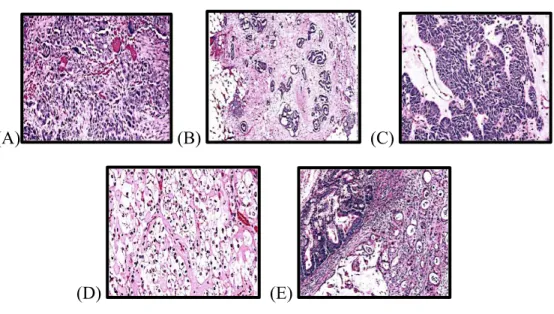
Figure 4. Hematoxilin & eosin staining of different histological types of epithelial ovarian cancer. ... 8
Figure 5. Stress signals that activate p53 and its role in cellular biology. ... 12
Figure 6. A schematic of BRCA proteins repairing damaged DNA. ... 13
Figure 7. Schematic representation of LIV-1 protein structure. ... 16
Figure 8. Schematic illustrating the relationship between the zinc transporter LIV-1 and the transcription factor Snail, linking E-cadherin to both metastasis and development. ... 17
Figure 9. The metastatic steps that require proliferation of the primary tumour then invasion to adjacent tissues or detachment to travel to a distant organ for proliferation at secondary sites. ... 20
Figure 10. Microarray data for the mRNA expression of SC39A6 (encoding LIV-1) in 14 HGSC cell lines. ... 27
Figure 11. Protein expression of LIV-1 in 14 HGSC cell lines. ... 28
Figure 12. Correlation between LIV-1 protein and gene expression in 14 HGSC cell lines. ………... 29
Figure 13. Schematic representation showing the name of the cell lines and their LIV-1 protein expression levels. ... 30
Figure 14. Invasion experiments using selected HGSC cell lines. . ... 31
Figure 15. Pearson correlation between LIV-1 protein expression levels and the average number of invading cells. ... 32
Figure 16. Migration experiments using selected HGSC cell lines. ... 34
Figure 17. Pearson correlation between LIV-1 protein expression levels and the cell migration speed of the 5 HGSC cell lines. ... 34
Figure 18. LIV-1 in TOV3133G after transfection with LIV-1 siRNA & scrambled siRNA. ………... 35
Figure 19. Effect of LIV-1 knockdown on the invasion capacity of TOV3133G cells. ... 36 Figure 20. Effect of LIV-1 knockdown on the invasion capacity of TOV2295(R) cells. .... 37 Figure 21. Effect of LIV-1 knockdown on the migration capacity of TOV3133G cells. ... 38 Figure 22. Effect of LIV-1 knockdown on the migration capacity of TOV2295(R) cells. ... 39
List of Abbreviations
Bax : Bcl-2-Associated X (a pro-apoptotic protein family) Bcl-2 : B-cell lymphoma 2
BRAF35 : BRCA2-Associated Factor 35
FIGO : International Federation of Gynecology and Obstetrics BRCA1 : Breast Cancer susceptibility gene1
BRCA2 : Breast Cancer susceptibility gene 2 CHK2 kinase : Checkpoint Kinase2 Human Gene DNA : Deoxyribonucleic Acid
DRAM : Damage-Regulated Autophagy Modulator DSBs : Double Strand Breaks
EGFR : Epidermal Growth Factor Receptor EMT : Epithelial-Mesenchymal Transition EOC : Epithelial Ovarian Cancer
ERK : Extracellular Signal-Regulated Kinase
GADD45 : Growth Arrest and DNA-Damage-Inducible Protein 45 GSK-3β : Glycogen Synthase Kinase 3 Beta
HGSC : High-Grade Serous Carcinoma
HPF : High-Power Field
HR : Homologous Recombination HRT : Hormonal Replacement Therapy IGF-1 : Insulin-Like Growth Factor-1 MAPK : Mitogen-Activated Protein Kinase
MMPs : Metalloproteinases
MMR : Mismatch Repair
mTOR : Mammalian Target of Rapamycin NOSE : Normal Ovarian Surface Epithelial p21 : Cyclin-Dependent Kinase Inhibitor 1
PUMA : p53 Upregulated Modulator of Apoptosis
RNA : Ribonucleic acid
SEM : Standard Error of the Mean
STAT3 : Signal Transducer and Activator of Transcription 3
Acknowledgments
I would like to thank all the members of the Institut du cancer de Montréal who have contributed directly or indirectly to my professional development.
I want to sincerely thank Dr. Anne-Marie Mes-Masson for welcoming me to her laboratory and giving me the opportunity to do my master’s degree at the CHUM.
I would also like to thank Dr. Diane Provencher for her help and support.
I would also like to thank Dr. Euridice Carmona for her supervision, her skills, her patience, and her constant willingness to make herself available to help. It was an honour for me to work alongside with her, and I would like to express my gratitude to her for assisting in my lab work and thesis writing.
A big thank you also goes out to Hubert Fleury for helping me, providing recommendations whenever I needed, and also for his kindness. I deeply enjoyed working with him.
Finally, thanks to Doris Jiofack who helped me so much in finishing my experiments. This work could not have been completed without her help.
1 Introduction
1.1 Ovarian cancer
1.1.1 Statistics and definition
According to the Canadian Cancer Statistics 2017 report, about 1 in 2 Canadians will develop cancer in their lifetime, and about 1 in 4 Canadians will die of cancer. Figure 1 shows that cancer was responsible for over 30% of all deaths in Canada in 2012, which is more than the mortality contributed by cardiovascular diseases or other causes.1 In 2017, the incidence rate of ovarian cancer was 14.4/100,000 women1 with the mortality rate at 8.2 deaths per 100,000, a significant decrease of almost 25% since 1988. This decline is attributed to the use of the oral contraceptive pill, treatment modalities such as neoadjuvant chemotherapy, and improvement in surgical techniques.1
Ovarian cancer is the most lethal of gynecological cancers, characterized by an uncontrolled growth of ovarian cells that can invade other tissues. During the cell cycle, normal cells have the ability to detect and repair DNA defects. Damaged cells usually undergo a process of programmed cell death, known as apoptosis; however, cancer occurs when cells lose their ability to detect damage due to a mutation in certain genes, such as BRCA or TP53 which are tumour suppressor genes. Unable to repair themselves, cancer cells continue to grow instead of undergoing apoptosis.2 For ovarian cancer, the etiology includes the accumulation of defects or mutations in DNA, particularly inherited genetic defects such as BRCA1 and BRCA2 mutations, are known to increase risk.3 In addition, fertility treatments may increase the risk of ovarian cancer due to repeated disruption of the ovarian epithelial surface and recurrent exposure to estrogen-rich follicular fluid, which is thought to enhance
mitotic activity and could augment the risk of unrepaired DNA damage.4 Yet another factor in the etiology of ovarian cancer is hormonal replacement therapy (HRT), which has been proven by many meta-analyses to increase the risk of ovarian cancer, especially when used for more than five years.3,4
Figure 1. Proportion of deaths due to cancer and other causes in Canada in 2012. Canadian
Cancer Statistics 2017. Canadian Cancer Society. http://www.cancer.ca/~/media/cancer.ca/CW/cancer information/cancer 20101/Canadian cancer statistics/Canadian-Cancer-Statistics-2017
1.1.2 Anatomy of the ovary and fallopian tubes
The ovary is a female organ located in the pelvis and is suspended lateral and/or posterior to the uterus (Figure 2) with the support of many ligaments: 1) the utero-ovarian ligament, which attaches the ovary to the uterus; 2) the infundibulopelvic ligament, which attaches the ovary to the pelvic sidewall, which contains several ovarian vessels; and 3) the mesovarium, which connects the ovary to the posterior surface of the broad ligament.2 Fallopian tubes originate from the fundus of the uterus and are posterior and
superior to the round ligaments (Figure 2). The broad ligaments support the fallopian tubes with a thick layer of a connective tissue called the mesosalpinx.2 The ovaries consist of an outer cortex, where the ova and follicles are located, and the medulla, where the blood vessels and connective tissue compose a fibromuscular tissue layer.5 The fallopian tubes are composed of two main muscular layers: an outer layer containing longitudinal smooth muscle fibres and an inner layer of circular, smooth muscle fibres. The inner lining of the fallopian tube is a mucosal layer consisting of three cell types (peg, ciliated and intercalated cells), the most important of which is the ciliated columnar cells.
Figure 2. Anatomy of the ovaries showing the attachment and interdependency between the fimbrial end of the fallopian tubes and the ovaries. 2010 Encyclopedia Britannica. NC.
Understanding the blood supply and lymphatic systems of the ovaries, as well as that of the peritoneum is very important to comprehend ovarian cancer metastasis (detailed in item
1.1.3.2). The main blood supply to the ovary originates from the abdominal aorta directly, unlike all other pelvic organs, which are served by the iliac artery,2 while the veins drain into the inferior vena cava. The ovary has three main lymphatic drainage pathways. The first is known as the abdominal pathway, in which drainage follows the ovarian arteries and veins to the retroperitoneal space. The second is known as the pelvic pathway, which drains from the caudal part of the ovaries, following the anastomosis between the ovarian vessels and the blood supply to the uterus. The third is a minor pathway called the inguinal pathway, which is composed of small lymphatic vessels running through the round ligaments.6
The peritoneum consists of two layers. The first is the parietal peritoneum, a serous, semi-permeable membrane that lines the abdominal wall and takes its blood supply from the abdominal wall (lumbar, intercostal, and epigastric regions) and drains into the inferior vena cava. The second layer is the visceral peritoneum, which covers the abdominal organs and takes its blood supply from the superior mesenteric artery, draining into the portal vein. The peritoneal cavity, located between the parietal and visceral peritoneum, contains approximately 100 mL of serous fluid. The movement of this fluid is produced by the movement of the diaphragm as well as bowel peristalsis, which is directed by the low sub-diaphragmatic pressures commonly to the right of the para-colic gutter and by gravity towards the pelvic cul-de-sac. About 90% of peritoneal fluid is cleared at the subphrenic space by the submesothelial lymphatics. These lymphatics are connected with lymphatics at the other side of the diaphragm.7 Figure 3 demonstrates the circulation of peritoneal fluid.
Figure 3. Circulation of peritoneal fluid. 2012 Universities Education of Ukraine.
1.1.3 Types of ovarian cancer
Ovarian cancer has two major types. The first is epithelial ovarian cancer (EOC), which has several subtypes and consists of almost 95% of all ovarian cancers. The second type is non-epithelial ovarian cancer, which includes germ cell tumours and sex cord tumours. According to their level of differentiation, EOCs are classified as high or low grade. In high-grade carcinoma, epithelial cells have high-high-grade nuclear atypia, frequent necrosis and high mitotic index, where greater than 12 mitotic figures are present per 10 high-power fields (HPF), under the magnification of a microscope.8 At times psammoma bodies (round collection of microscopic calcification) can be found in variable numbers. These bodies are thought to arise from the infarction and calcification of the tumor papillae tips or calcification of tumor intralymphatic thrombi.
On the other hand, low-grade carcinoma has a nucleus with low-grade malignant cytological atypia. In addition, the mitotic activity is low (fewer than 12 mitotic figures per 10
HPF), necrosis is almost never detected, and psammoma bodies are frequent. Based on molecular analyses, low-grade carcinomas appear to develop from borderline tumours. 8,9
1.1.3.1 Epithelial ovarian cancer subtypes
A) High-grade serous carcinoma (HGSC) (Figure 4A) accounts for 70-80% of
all EOCs. The mean age of diagnosis is 57 years old, and the majority of cases are diagnosed late at an advanced stage of the disease with metastases. In these cases, the prognosis is very poor, with 5-year survival rates of 39% and 17% for stages III and IV, respectively.10 Only 10% are diagnosed early, in stages I and II, and for those the 5-year survival rate is much higher, at approximately 80%.10
Recent studies have revealed the role of the distal fallopian tube in the origin of HGSC.11 The postulated hypothesis is that the tumour cells from the tubes relocate in the direction of the ovarian surface. Among women with BRCA mutations who underwent risk reduction surgery, 4-17% are found to have ovarian serous pre-invasive or invasive neoplasm, and approximately 80% of these neoplasms are in the fallopian tube.12
B) Low-grade serous carcinoma (Figure 4B) is a rare tumour that represents
approximately 5% of all serous tumours. It is usually detected early in comparison to HGSC and is relatively indolent; however, the long-term prognosis is poor because patients usually do not respond to standard chemotherapy regimens.8
C) Endometrioid carcinoma (Figure 4C) accounts for about 10% of all EOCs and
is the second most common type of EOC. Around 42% of cases are associated with pelvic endometriosis. Patients with a history of endometriosis are usually diagnosed with
endometrioid carcinoma at an earlier age than the mean age for this subtype, which is 56 years old. 15-20 % of endometrioid ovarian cancers are associated with endometrial cancer.8 Endometrioid ovarian cancer is also the most common histological subtype presenting mutations in DNA mismatch repair (MMR) genes, and associated with the hereditary Lynch syndrome.13-15 Patients with Lynch syndrome have also increased risk of developing endometrial and colorectal cancers.14
Primary ovarian endometrioid adenocarcinoma is typically of low grade, but the high-grade type shares many molecular and morphological features with HGSC and was once assumed to be a subtype of HGSC.9 However, a study from our laboratory demonstrated the presence of Wilms’ tumour-1 (WT-1) protein by immunohistochemistry in high-grade endometrioid cancers. Since WT-1 is specifically expressed in HGSC, this study reported a portion of high-grade endometrioid ovarian cancers as misclassified that are actually HGSC. 16
D) Clear cell carcinoma (Figure 4D) represents about 5-10% of all EOCs.
Patients are usually young (around 40 to 50 years old) and are commonly among those of East Asian descent for unexplained reasons.17 The majority of cases diagnosed in early stages have a good prognosis. At advanced stages, the cancer is often very aggressive and associated with a poor prognosis, worse than other types of EOC.17 Nearly 40% of clear cell carcinoma patients have a history of endometriosis. One of the characteristics of the disease is that it has a high incidence of paraneoplastic syndromes such as hypercalcemia and deep vein thrombosis.8,18
E) Mucinous carcinoma (Figure 4E) comprises about 3-4% of all primary ovarian
typically in the gastrointestinal system. Mucinous carcinomas occur in young people around the age of 40 years old, and many patients present with the early stages of disease. One of the main characteristics of this type of tumour is the formation of a very large ovarian mass of approximately 20 cm in diameter, which is the primary reason why patients become symptomatic.8
(A) (B) (C)
(D) (E)
Figure 4. Hematoxilin & eosin staining of different histological types of epithelial ovarian cancer. (A) High-grade serous carcinoma. (B) Low-grade serous carcinoma. (C) Endometrioid carcinoma.
(D) Clear cell carcinoma. (E) Mucinous carcinoma. In Kurman et al. WHO Classification of Tumours of Female Reproductive Organs. Chapter 1. France: International Agency for Research on Cancer (IARC) 2014.
1.1.3.2 Stages and routes of metastasis
Ovarian cancer is mainly staged during surgery, allowing the surgeon to perform a comprehensive assessment before further treatment recommendations are discussed. The staging of ovarian cancer follows the system recommended by the International Federation of
Obstetrics and Gynecology (FIGO). These stages are defined by the presence of cancer cells in the ovaries, the extension to other pelvic tissues and the peritoneal cavity, the presence of cancer cells on the lymphatic ganglions, and the development of distant metastases.19
Stage I: Cancer is contained within the ovary (or ovaries). It has not spread to organs
and tissues in the abdomen or pelvis, lymph nodes, or to distant sites. Stages IA, IB, and IC are different according to the presence of a tumour in one ovary or both ovaries, or a rupture of the mass of the tumour in the abdomen before or during the surgery. The 5-year survival rates for stages IA, IB, and IC are 95%, 92%, and 85%, respectively.19
Stage II: Cancer is in one or both ovaries and presents pelvic extension (below pelvic
brim) or primary peritoneal cancer. Cancer spread to the uterus or fallopian tubes is classified as stage IIA. Cancer spread to other organs in the pelvis such as the bladder, the sigmoid colon, or the rectum, is classified as stage IIB. The 5-year survival rates for stages IIA and IIB are 78% and 73%, respectively.19
Stage III: Cancer is in one or both ovaries, but cancer cells have spread to the
peritoneum outside the pelvis and/or have metastasized to the retroperitoneal lymph nodes. For stage IIIA, in which only retroperitoneal lymph nodes are involved, the 5-year survival rate is 59%.19 In stage IIIB, macroscopic extra-pelvic peritoneal metastatic lesions are 2 cm in diameter or less, and the 5-year survival rate is 52%.19 However, in stage IIIC, cancer nodules in the abdomen are larger than 2 cm in diameter and extensions to the liver/spleen capsules may occur, resulting in a 5-year survival rate of 39%.19
Stage IV: Stage IV cancer has a very poor prognosis. The 5-year survival rate is 17%.
In this most advanced stage, tumour cells have invaded the parenchyma of the abdominal organ or have spread beyond the peritoneal cavity. In stage IVA, there is malignant pleural effusion. In stage IVB, the disease has spread into the parenchyma of the liver or/and spleen, and inguinal lymph nodes.19 In the case of HGSC, around 7% of patients present lung metastasis, 4% skin and 1.6% bone metastasis; their overall survival is 9, 12 and 4 months respectively.19
EOCs spread primarily by shedding cells into the peritoneal cavity and spreading through lymphatic and hematogenous routes.19,20 Transcoelomic is the most common route of metastasis where the cancer cell exfoliates and becomes free in the peritoneal cavity and spreads through the route of peritoneal circulation. That is why most metastases are found in the paracolic gutters, especially to the right and along the intestinal mesenteries as well as to the right hemidiaphragm, liver capsule, the peritoneal surfaces of the intestines and their mesenteries, and the omentum.19 Lymphatic dissemination to the pelvic and para-aortic lymph nodes is common, particularly in advanced-stage disease.21 The rate of metastatic para-aortic lymph nodes was 18% in stage I, 20% in stage II, 42% in stage III, and 67% in stage IV.19 Although hematogenous metastasis is not common, occurring in only 2-3% of cases, it is associated with poor survival. The median survival for patients with bone metastases is 4 months, whereas the survival rate in patients with central nervous system metastases is 1.3 months.19
1.2 Molecular aspects of HGSC
1.2.1 TP53 and BRCA mutations
HGSC is a very aggressive disease with patients presenting in the advanced stages and carry a recurrence rate of up to 75%. Understanding the molecular features of HGSC will contribute to understanding the pathophysiology of this disease and to developing an appropriate treatment plan.
According to The Cancer Genome Atlas (TCGA) study published in 2011, the tumour suppressor gene TP53 is mutated in about 96% of all HGSCs. In addition, somatic and germline mutations of BRCA1 and BRCA2, which disable DNA repair mechanisms, occurs in 22% of cases. TP53 and BRCA mutations are not mutually exclusive. Although other types of mutations were noted, their frequency was no more than 2%.22 Overall, HGSC is considered to be highly heterogeneous, having widespread inter- and intra-tumoural mutation profiles.23
TP53: This tumour suppressor gene encodes the p53 protein, integral to several
biological functions (Figure 5). When DNA damage is detected, p53 regulates cell cycle checkpoints to arrest cells at the G1/S phase as well as the G2/M phase through the formation and activation of many enzymatic complexes, enabling cells to repair themselves.24 Another important function of p53 is the ability to induce and activate many transcription factors such as Bax and PUMA, resulting in apoptosis.24 However, p53 also has a role in inducing cellular senescence in damaged cells, independent of its mechanism as a checkpoint regulator.24 Furthermore, p53 has been shown to activate the damage-regulated autophagy modulator (DRAM) gene to induce autophagy.24
Figure 5. Stress signals that activate p53 and its role in cellular biology. In Cell Biology, 2016.
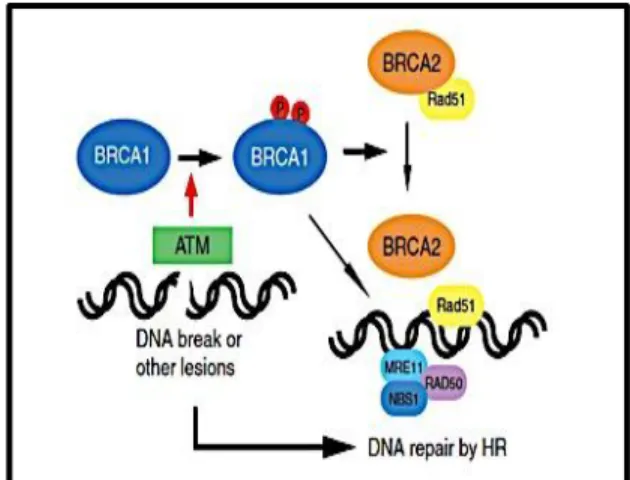
BRCA1 and BRCA2: These tumor suppressor genes encode proteins that have
essential roles in DNA damage repair. Figure 6 illustrates the role of BRCA1/2 in double-strand breaks (DSBs) and the initiation of the homologous recombination (HR) repair mechanism. After DNA damage, BRCA1 is phosphorylated and binds to many molecules and enzymes to initiate the DNA repair of DSBs by HR.25 BRCA1 has been shown to arrest the cell cycle in the S-phase and G2-/M-phase after DNA damage through the activation of checkpoints such as CHK2 kinase, p53 and p21.25 Moreover, stress response factors such as GADD45 (Growth Arrest and DNA-Damage-Inducible Protein 45) are also stimulated by BRCA1.25
Figure 6. A schematic of BRCA proteins repairing damaged DNA. BRCA1 is phosphorylated by
ATM in response to double strand breaks. Phosphorylated BRCA1 activates DNA repair through homologous recombination, in cooperation with BRCA2 and Rad51. In Yoshida and Miki. Role of BRCA1 and BRCA2 as regulators of DNA repair, transcription, and cell cycle in response to DNA damage. Cancer Sci. 2004, 95:866-871.
On the other hand BRCA2 is necessary for the transport of Rad51, which play a role in HR repair mechanism to damaged DNA (Figure 6).25 Yet, the role of BRCA2 as a transcription regulator is not clear, but one study has shown that it downregulates the EMSY protein (BRCA2-interacting transcriptional repressor), which is overexpressed in patients with breast cancer.25 BRCA2 might have some role as a checkpoint regulator, and available evidence suggests that BRCA2 mediates G2-/M-phase control by interacting with the DNA-binding protein BRAF35.25
1.2.2 Biomarkers and biological predictive markers of response
Several studies have identified many biomedical markers of EOC that are associated with patient survival and the aggressiveness of the disease. Considering that mutations in p53 and BRCAs are significant in HGSCs, many studies are focused on finding the correlation between these mutations and patient survival. A meta-analysis 26 found that p53 mutation was associated with a poor prognosis in HGSC and was influenced by the FIGO stage; however, there is no consistent data addressing the pattern of chemotherapy responses in the presence of a p53 mutation.27 In contrast, BRCA is a good predictive marker in many retrospective studies using platinum-based chemotherapies that have shown increased progression-free survival in patients with BRCA mutations in comparison to those without mutations.28 This outcome could be explained by an HR repair deficiency resulting from the absence of functional BRCA1 and BRCA2 proteins, and impairing the ability of tumour cells to repair platinum-induced DSBs.28 Alternatively, the cell cycle regulator cyclin E is described as a promising candidate biomarker of HGSC outcome 27, being an independent variable associated with poor prognosis.
Disruption of the E-cadherin/β-catenin complex is known to lead to the development of malignancy and invasion of cancer cells.29 The E-cadherin/β-catenin complex is a protein complex that maintains the cell’s adhesive properties and integrates intra- and inter-cellular signaling, including the regulation of nuclear functions and transcription pathways. In patients with HGSC, low levels of E-cadherin/β-catenin are associated with a decrease in survival rates.27
Metalloproteinases (MMPs) also play a significant role in tumour invasion 27,30 and are directly involved in the metastasis of cancer cells.31,32 MMPs are a group of zinc-requiring proteolytic enzymes, which degrade extracellular matrix proteins. Studies conducted on ovarian cancer cell lines derived from patients with advanced disease have shown that MMP-2 and -9 are secreted and activated in ovarian cancer cells and are closely correlated with invasion and metastasis as well as with poor survival.33 According to a large-scale meta-analysis conducted in China, increased MMP-9 expression is significantly associated with a poor prognosis for ovarian cancer patients and the authors suggest MMP-9 as a marker for ovarian cancer.34
In addition to MMPs, zinc transporters have been implicated in the development of cancer. Zinc is vital for the functioning of numerous cellular processes. It is an essential element for DNA, RNA, and more than 300 enzymes and 3000 transcription factors.31 Importantly, zinc transporters regulate intracellular zinc levels and modulation of their expression levels have been involved in cancer progression.35 Specifically, LIV-1 is as a zinc transporter that has been associated with the etiology of breast cancer and has emerged as a promising candidate for targeted therapies.36,37
1.3 LIV-1 structure and function
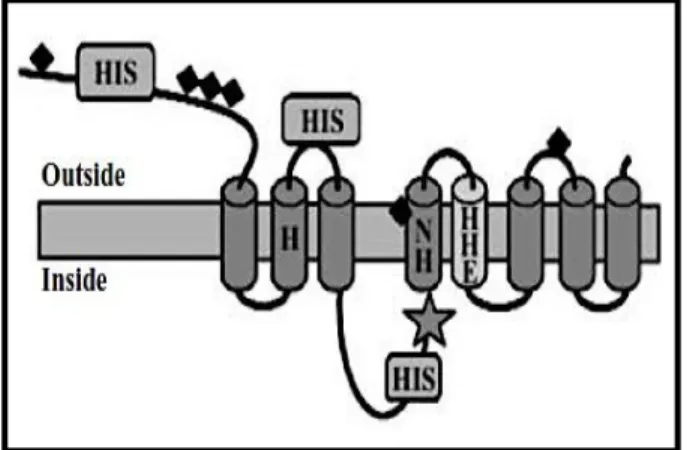
LIV-1 is a zinc transporter that plays a significant role in cancer development through controlling intracellular zinc levels. The protein, encoded by the gene SLC39A6 on chromosome number 18, is localized in the plasma membrane and in the endoplasmic reticulum.32. LIV-1 has five to eight transmembrane-spanning domains (Figure 7), with
regions of concentrated cysteine and histidine residues, which may permit zinc-specific binding.31 As well, LIV-1 contains a HEXPHEXGD motif (Figure 7), which is a zinc-binding site motif important for the catalytic activity of some metalloproteases (MMPs).
It has been proven that zinc deficiency is associated with chronic disease and further studies have proven that there is an association between the zinc level of a cell and cancer. However, the intracellular zinc level has been found to be tissue-dependent. For example, in breast cancer, tissue levels of zinc are very high, while in prostate cancer, tissue levels of zinc are about 75% of the level in normal cells.31 One explanation for the association between zinc and cancer is that high levels of zinc can induce the mammalian target of rapamycin (mTOR), which is responsible for protein synthesis, and zinc can also increase insulin-like growth factor -1 (IGF-1) expression. Both of these are known to play a significant role in cancer development.31
Figure 7. Schematic representation of LIV-1 protein structure. The fifth transmembrane domain
has a conserved metalloprotease (HEXPHE) motif. Histidine (His) residues involved in zinc-specific binding are shown. In Taylor et al. Structure-function analysis of LIV-1, the breast cancer-associated protein that belongs to a new subfamily of zinc transporters. Biochem J. 2003, 375:51-59.
1.3.1 Role of LIV-1 in different types of cancer
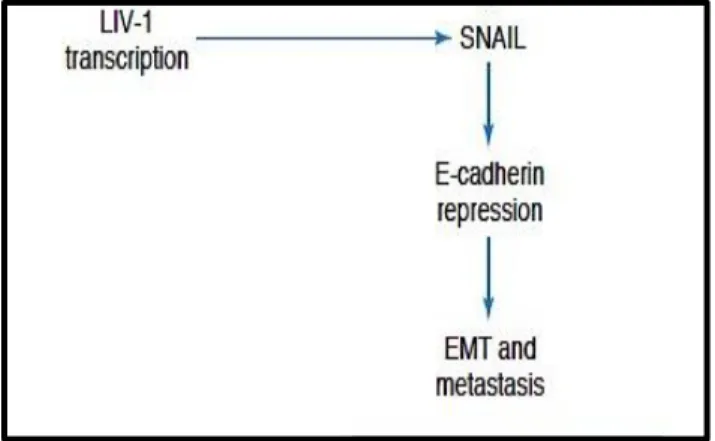
Estrogen receptor-positive breast cancer cell lines are reported to have high levels of LIV-1. When estrogen binds to its receptor, it activates the signal transducer and activator of transcription-3 (STAT3) pathway, which has the downstream effect of inducing LIV-1 expression. In addition, having high levels of LIV-1 has been documented to inhibit glycogen synthase kinase 3 beta (GSK-3β), which leads to increased expression of the transcription factor named Snail.38 Snail works by inhibiting E-cadherin and activating epithelial-mesenchymal transition (EMT) (Figure 8). In EMT, cellular adhesion is lost, the cytoskeleton is remodelled, and mesenchymal indicative genes are expressed, allowing cells to migrate.38 In addition, the inhibition of E-cadherin is an important element in tumour metastasis.38
Figure 8. Schematic illustrating the relationship between the zinc transporter LIV-1 and the transcription factor Snail, linking E-cadherin to both metastasis and development. In Hogstrand et
al. A mechanism for epithelial-mesenchymal transition and anoikis resistance in breast cancer triggered by zinc channel ZIP6 and STAT3 (signal transducer and activator of transcription 3). Biochem J. 2013, 455:229-237.
STAT3 as an inducer of cell proliferation and the LIV-1 effects on Snail provide an understanding of how high levels of LIV-1 expression in breast cancer can be associated with
metastasis. However, contradictory data exists about the role of LIV-1 in breast cancer. Some data has shown that in small tumours, 92% of lymph node-positive patients expressed LIV-1, whereas 77% of lymph node-negative patients did not express LIV-1.38 In contrast, other data have shown that LIV-1 is associated with a good prognosis in breast cancer.39
In cervical cancer, LIV-1 was reported as overexpressed in situ in comparison to normal cervical tissue and invasive cervical cancer. However, LIV-1 suppression in HeLa cells (derived from an adenocarcinoma of the cervix) limits cell growth but does not induce apoptosis. In addition, LIV-1 suppression has the ability to prevent migration and invasion in vitro, probably through the inactivation of the p44/42 MAPK-Snail/Slug signaling pathway, which is known to play a significant role in EMT.40
Similarly, an experiment conducted on pancreatic cell lines and tissue demonstrated that LIV-1 expression was significantly higher in human pancreatic cancer tissue compared to normal tissue. LIV-1 expression was significantly associated with lymphatic infiltration and increased tumour size.41 The downregulation of LIV-1 led to suppression of cell proliferation and cell migration in pancreatic cancer cells in vitro. In addition, a knockdown of LIV-1 inhibited tumour growth, metastasis, and peritoneal dissemination in vivo. Similar to cervical cancer cell lines, downregulation of LIV-1 in pancreatic cancer cells reduced Snail expression, thus affecting EMT. Although the proliferation effect is not clearly explained, there is evidence of STAT3, which induces proliferation, as being upregulated in pancreatic cancer, and STAT3 has been proven to induce the expression of LIV-1 in pancreatic cancer.41 Similar effects have been described for esophageal squamous-cell carcinoma and hepatocellular carcinoma cells. In these cancer cell lines, expression of LIV-1 was significantly increased and a knockdown of LIV-1 with siRNA had a significant effect on growth, proliferation, and
metastasis as well as invasion.42,43 In one study, the survival rates were significantly decreased for patients with esophageal squamous-cell carcinoma who had high expression of LIV-1. The results suggested that LIV-1 may be a good prognostic indicator for these patients.43
Furthermore, high levels of LIV-1 in prostate cancer cell lines were significantly associated with bone metastasis in vivo.44 LIV-1 was found to upregulate MMP-2 and MMP-9, which are known to induce metastasis, which induced shedding of epidermal growth factor and activation of its receptor (EGFR). EGFR and downstream extracellular signal-regulated kinase (ERK) activation had a major stimulatory effect on the migratory and invasive behavior of LIV-1 overexpressing cells.44
To our knowledge, only one report has investigated the role of LIV-1 in ovarian cancer, showing an increase in LIV-1 mRNA and protein levels by trichostatin A (a histone deacetylase inhibitor), and demonstrating that LIV-1 overexpression increased cell death, and that LIV-1 knockdown inhibited apoptosis by enhancing the levels of Bax and caspase 3 cleavage.45
2 Hypothesis and Objective
Several pieces of evidence indicate that LIV-1 has a major role in cancer by inducing EMT. LIV-1 also has a potential metalloprotease motif (HEXPHEXGD) similar to that present in the MMPs, which supports its role in invasion. In metastasis, the tumour cells either detach from their origin or invade the basement membrane of the adjacent organ where cells settle on the secondary site and proliferate.46,47 Metastasis follows specific steps (Figure 9) and the failure or absence of one step decreases the chance of metastasis. The exact mechanism of
cancer metastasis is not fully understood, though many hypotheses are postulated to understand the pathways involved in this phenomenon.46 So far, the most accepted is the acquisition of specific gene mutations/alterations by a subpopulation of the primary tumor cells favouring the metastasis process.46 Conversely, non-metastatic subpopulations could express metastasis suppression genes (such as NM23) that prevent metastasis without interfering with primary tumor growth.46,48
Based on the evidence presented in the literature, we hypothesize that LIV-1 plays an important role in the metastatic spread of ovarian cancer. To address this question, the specific objectives are (1) to analyze the mRNA and protein expression of LIV-1 in HGSC cells compared to normal ovarian surface epithelial cells; (2) to correlate LIV-1 expression with the invasion and migration capacities of HGSC cells; and (3) to investigate the function of LIV-1 in HGSC cellular migration and invasion by RNA interference.
Figure 9. The metastatic steps that require proliferation of the primary tumour then invasion to adjacent tissues or detachment to travel to a distant organ for proliferation at secondary sites.
3 Materials and Methods
3.1 Cell lines and cell culture
The 14 HGSC cell lines used in this project [OV1369(R2), OV2295, OV2295(R2), OV3133(R), OV4453, OV4485, OV866(2), TOV1396, TOV2295(R), TOV2978G, TOV3041G, TOV3133D, TOV3133G, and TOV3291G] were developed in our laboratory and have been well characterized.49 They were derived from solid ovarian tumours (TOV) or established from the cellular fraction of ascites collected by centrifugation (OV). Cells were maintained in OSE medium (Wisent Inc., St-Bruno, QC, Canada) supplemented with 10% fetal bovine serum (FBS, Wisent), 0.5µg/mL amphotericin B (Wisent) and 50 µg/mL gentamicin (Life Technologies Inc., Burlington, ON). Cells were cultured at 37°C in 5% CO2 until they reached 70-80% confluency two to three days later. Primary normal ovarian surface epithelial (NOSE) cell lines (NOV3202G, NOV2309G and NOV3198G) were obtained as previously described.50
3.2 Western blot
Cell pellets were resuspended in lysis buffer [25 mM Tris HCl pH 7.5, 0.15 M NaCl, 1 mM EDTA, 0.1% SDS, 1% Triton X100, and 1x protein inhibitor cocktail (PIC, Sigma-Aldrich, St. Louis, MO)], incubated for 30 minutes on ice, and then centrifuged for 5 minutes at 4°C. The supernatant was recovered for measuring protein concentration with the Bradford protein assay (BioRad Protein Reagent, Bio-Rad Laboratories, Hercules, CA, USA) and 30 µg was loaded onto a 12% SDS-PAGE gel under denaturing conditions. Samples were transferred
to a nitrocellulose membrane at 250 mA for 70 minutes at 4°C. To block nonspecific binding sites, the membrane was incubated in 5% milk in TBS at 4°C. The next day, the membrane was incubated with LIV-1 polyclonal antibody (1:5000, rabbit antibody, Proteintech Group, Inc, Rosemont, IL,) at 4 ° C. The membrane was incubated for 1 hour at room temperature with a secondary anti-rabbit antibody coupled to peroxidase (1:3000, goat antibody, Bio-Rad). Proteins were detected using the Western Lightning Chemiluminescence Reagent Plus kit (PerkinElmer, Boston, MA) and the Fuji LAS-3000 Imaging System.
3.3 siRNA knockdown
A collection of four different LIV-1 siRNAs (Dharmacon ON-TARGET plus siRNA, set of 4; Thermo Fisher Scientific Inc., Waltham, MA) were tested and the most effective were selected for further analysis (#8 and #9). Scramble siRNA (Dharmacon) was used as control in all the experiments. TOV3133G and TOV2295(R) cells were seeded at 3-5 × 10⁵ cells per well in 6-well plates for 24 hours. The cells were transfected with 20 nM LIV-1 or Scr siRNA, using 7.5 µL added to 200 µL of Opti-MEM (Thermo Fisher Scientific Inc.). Afterward, 4 µL of DharmaFECT #3 Transfection Reagent in 200 µL of the Opti-MEM medium was added and incubated for 20 minutes. Finally, 1700 µL of OSE medium supplemented with FBS only (no antibiotics) was added, totaling to a final volume of 2 ml per well. Cells were harvested and assayed 48 hours after transfection.
3.4 Invasion assays
The invasive capacity of five HGSC cell lines [TOV3133G, TOV2295(R), TOV2978G, TOV1369, OV866(2)] was evaluated by the modified Boyden chamber method.51 TOV3133G and TOV2295(R) cells transfected with LIV-1 siRNA or control Scr siRNA were also analyzed. A 50 µL volume of Matrigel (BD Biosciences; Thermo Fisher Scientific Inc.) diluted to a concentration of 1 mg/ml in OSE medium was deposited onto the polycarbonate inserts (8 µm pore; Costar; Thermo Fisher Scientific Inc.), which were then incubated for 3 hours at 37°C. Cells at 80% confluency were rinsed with phosphate buffered saline (PBS), trypsinized, and then resuspended in OSE medium containing 1% FBS. Cell counts were obtained by hemacytometer; 2,0000-4,0000 cells were diluted in a total of 350 µL OSE containing 1% FBS and were deposited on the solidified Matrigel. An FBS gradient was created by adding OSE medium containing 5% FBS to the bottom chamber. Cells were incubated for 24 hours at 37°C and 5% CO2. Cells on the insert were then fixed for 20 minutes with formalin and stained using 0.1% crystal violet solution (20% MeOH, diluted in water). The cells found under the insert were counted. The experiment was performed three times in duplicate.51
3.5 Scratch/wound migration assays
To evaluate the migration capacity of HGSC cell lines, we used a scratch/wound assay following procedures described in our previous publications.23,49 Five HGSC cell lines [TOV3133G, TOV2295(R), TOV2978G, TOV1369, OV866(2)] were plated in 12-well dishes and were grown at 37°C until confluent. TOV3133G and TOV2295(R) cells transfected with
LIV-1 siRNA or control Scr siRNA were also analyzed. Cell monolayers were scraped using sterile 200-µl yellow plastic tips to produce small wounds of similar size. Wounded monolayers were then washed with PBS to remove cell debris, and OSE medium with 5% FBS was added. Cells were incubated at 37°C under 5% CO2 for different lengths of time (0, 6, or 24 hours after scratch formation) to evaluate their migration. Digital images were obtained at each time point of the experiment. Images were analyzed, and wound closures were quantified, using Image Pro Plus software (Version 5.1; Media Cybernetics, Bethesda, MD) and Microsoft Excel. All experiments were performed three times using triplicate samples.49
3.6 Microarray analysis
We conducted the analysis using our available microarray data 52 for the 14 HGSC cell lines used in this project. The data is from HG-U133 Plus 2.0 GeneChip arrays (Affymetrix®, Santa Clara, CA) and normalized to house keeping genes contained within the chip. Four Affymetrix hybridization probes recognizing the SLC39A6 mRNA, which encodes the LIV-1 protein, were found in this dataset. Full-length SLC39A6 mRNA sequence (NM_012319) is 3637 nucleotides long, with coding region at nucleotides 291 to 2558. The microarray probe 1556551_S_AT recognizes nucleotides 1097-1463 (coding region within exons 3-5), the probe 1555460_A_AT nucleotides 1913-2306 (coding region within exons 7-10), the probe 202089_S_AT nucleotides 2360-2785 (coding and 3’UTR non-coding regions in the beginning of exon 10) and 202088_AT nucleotides 3273-3592 (3’UTR non-coding region at the end of exon 10). We conducted our experiments using the expression levels obtained by each individual probe as well as the average of all four.
3.7 Statistical analysis
Comparative statistical analyses were performed using the two-sample Student t-test with equal variance using Microsoft Excel. Pearson correlation coefficient (two-tailed) was
4 Results
4.1 Expression levels of LIV-1 gene and protein in different HGSC
cell lines
Gene expression microarray analysis of 14 HGSC cell lines showed different levels of SLC39A6 mRNA (which encodes the LIV-1 protein) expression by each of the probes available on the chip (Figure 10A). Sequence analysis of each probe revealed that they recognize coding and 3’UTR non-coding regions within exons 3 to 10 (see Materials and Methods for details). The higher relative expression values for probes 202088_AT and 202089_S_AT (Figure 10A) are explained by their hybridization to the 3’UTR non-coding region of the mRNA, which is usually more stable. Due to the differences in expression of each probe, we also calculated their average expression level (Figure 10B) to use as reference. However, due to their 10-fold difference in expression levels, calculation of the standard deviation of the average is not appropriate or relevant.
Thereafter, the protein expression of LIV-1 was determined using Western blot analysis on the above cell lines and compared to the normal ovarian surface epithelial cells, as illustrated in Figure 11A. We first observed that the 14 HGSC cell lines expressed different levels of LIV-1 protein and that normal cells express this protein in very little quantity. After quantification, we were able to show significant differences between LIV-1 protein levels in normal cells compared to HGSC cells expressing either low or high levels of this protein, and between HGSC cells expressing low and high LIV-1 protein (Figure 11B).
Figure 10. Microarray data for the mRNA expression of SC39A6 (encoding LIV-1) in 14 HGSC cell lines. A) Bar graphs display the relative expression levels (normalized to the expression of house
keeping genes present in the microarray chip) obtained by each of the four probes found on the HG-U133 Plus 2.0 Affymetrix chip. B) Average levels were calculated.
A)#
Figure 11. Protein expression of LIV-1 in 14 HGSC cell lines. A) Representative images of Western
blot showing LIV-1 and GAPDH protein bands. The experiment was repeated three times. B) Quantification of the western blot bands was expressed as the ratio of band intensity of LIV-1 relative to that of GAPDH. Bars represent the relative expression level of LIV-1 in HGSC cell lines and compared to normal ovarian surface epithelial primary cells (NOSE) (*p<0.05).
We next wanted to verify whether protein and mRNA levels were correlated, and we found positive but weak Pearson correlations when using each of the mRNA probes or the average, and significance was not achieved (Figure 12).
Figure 12. Correlation between LIV-1 protein and gene expression in 14 HGSC cell lines. A)
Correlation curves for the expression of LIV-1 protein and mRNA using each of the four probes found on the HG-U133 Plus 2.0 Affymetrix microarray chip. Significance was calculated by the Pearson coefficient. B) Average levels for mRNA expression were used for the correlation analysis.
0.5 1.0 1.5 0 200 400 600 800 Protein ratio Re la tiv e mRNA e x p re s s io n R2#=#0.1036# p#=#0.2618# 0.5 1.0 1.5 0 50 100 150 200 250 Protein Pr o b e 1 5 5 5 4 6 0 _ a _ a t 0.5 1.0 1.5 0 50 100 150 200 Protein Pr o b e 1 5 5 5 6 5 5 1 _ s _ a t 0.5 1.0 1.5 0 500 1000 1500 2000 Protein Pr o b e 2 0 2 0 8 8 _ a t 0.5 1.0 1.5 0 200 400 600 800 Protein Pr o b e 2 0 2 0 8 9 _ s _ a t R2#=#0.1242# p#=#0.2166# R2#=#0.1512# p#=#0.1694# R2#=#0.0938# p#=#0.2868# R2#=#0.0883# p#=#0.3021#
A)#
B)#
Low level of protein Intermediate High level of protein
TOV1396, OV866(2) TOV2978G TOV3133G, TOV2295(R)
In order to better understand the role of LIV-1 in HGSC cells, we selected five of our cell lines having different LIV-1 protein levels (rather than mRNA) to further conduct molecular and biological characterization experiments: TOV1369 and OV866(2) have low LIV-1 expression, TOV2978G has intermediate expression, and TOV3133G and TOV2295(R) have high LIV-1 expression levels (Figures 11 and 13). These cell lines have similar doubling times, raging from 2 to 2.8 days 23,49, which should not interfere with our invasion and migration assays.
Figure 13. Schematic representation showing the name of the cell lines and their LIV-1 protein expression levels.
4.2 LIV-1 and the invasion capacity of HGSC cells
We then performed invasion assays in modified Boyden chambers, that is, containing a layer of Matrigel, thus mimicking the extracellular matrix. This allowed us to determine the invasiveness potential of each of the 5 cell lines selected, as illustrated in Figure 14. Our results show that the two cell lines having high LIV-1 protein levels have significantly higher invasion capacity than those expressing either intermediate or low LIV-1 protein (Figure 14B). No significant difference was found between the two cell lines having high levels of LIV-1 or among the three cell lines having intermediate and low LIV-1 levels.
Figure 14. Invasion experiments using selected HGSC cell lines. A) Representative images of
invasive cells (1) TOV3133G, (2) TOV2295(R), (3) TOV2978G, (4) TOV1369, and (5) OV866(2). B) Quantification of the invading cells present on the Matrigel layer after 24 h incubation. Bars represent mean ± SEM. *p<0.05. NS = not significant. C) Table showing the quantification values.
A)#
C)#
B)#
(1)$ (2)$ (3)$ (4)$ (5)$ *$ NS$ NS$Invasion$Assay$
Cell$lines$ Number$of$invading$cells$(mean$±$SEM)$
TOV3133G'(LIV+1'high)' 395'±'25'
TOV2295(R)'(LIV+1'high)' 413'±'29'
TOV2978G'(LIV+1'interm)' 296'±'26'
TOV1369'(LIV+1'low)' 209'±'74'
Furthermore, we observed a significant positive Pearson correlation between LIV-1 expression levels and the invasion capacity (Figure 15, significant p = 0.0216).
Figure 15. Pearson correlation between LIV-1 protein expression levels and the average number of invading cells. The correlation is positive, significant and strong: R2=0.8666, p = 0.0216.
4.3 LIV-1 and the migration potential of HGSC cells
The same five HGSC cell lines were also used to determine the migration potential in an in vitro scratch assay as illustrated in Figure 16A. We measured the difference between the migration capacities according to the level of protein expression and observed that the two cell lines having high LIV-1 protein levels [TOV3133G and TOV2295(R)] showed significantly low cell migration speeds (Figures 16B-C) when compared to those of the TOV2978G (intermediate LIV-1 level) and the OV866(2) (low LIV-1 level) cell lines. However, no significant difference was observed with the TOV1369 cell line (also presenting low LIV-1 level) (Figures 16B-C). Therefore, our results indicate that the role of LIV-1 on HGSC cell migration is probably less important than that on cell invasion.
0.5 1.0 1.5 200 300 400 500 Protein Inv a s ion R2#=#0.8666# p#=#0.0216#
A)#
C)#
B)#
TOV3133G TOV2295(R) TOV2978G TOV1369 OV866(2)Cell$lines$ μm/h$(mean$±$SEM)$Migra,on$speed$
TOV3133G'(LIV+1'high)' 3.89'±'0.76' TOV2295(R)'(LIV+1'high)' 5.26'±'0.88' TOV2978G'(LIV+1'interm)' 17.49'±'1.05' TOV1369'(LIV+1'low)' 7.17'±'1.10' OV866(2)'(LIV+1'low)' 29.23'±'2.99'
Migra&on)Assay)
(0h) (6h) (24h)Figure 16. Migration experiments using selected HGSC cell lines. Migration was assessed by
determining the ability of cells to migrate in a culture plate using a wound-healing assay in 5% FBS at 0h, 6h, 24h of incubation. A) Representative images of migrating cells. B) The migration speed was calculated after 24h incubation and expressed as micrometers per hour. Bars represent mean ± SEM. *p<0.05. NS = not significant. C) Table showing the quantification values.
Furthermore, we observed a negative Pearson correlation between LIV-1 expression levels and cell migration speeds, which did not reach significance (Figure 17, p = 0.2142).
Figure 17. Pearson correlation between LIV-1 protein expression levels and the cell migration speed of the 5 HGSC cell lines. The correlation is negative but not significant: R2=0.4514, p = 0.2142.
4.4 Effect of LIV-1 knockdown by siRNA on HGSC cell invasion
In order to better understand the role of LIV-1 in HGSC cell invasion, we performed knockdown experiments in the two cell lines that express high levels of this protein [TOV3133G and TOV2295(R)] using two different small interference RNAs (siRNA #8 and #9) against LIV-1. Western blot analysis shows that both siRNAs efficiently decreased LIV-1 expression in the TOV3133G cell line (Figure 18). Scramble siRNA was used as control.
0.5 1.0 1.5 0 10 20 30 40 Protein Mi g ra tio n R2#=#0.4514# p#=#0.2142#
1 2 3 4
Figure 18. LIV-1 in TOV3133G after transfection with LIV-1 siRNA & scrambled siRNA. At 48
hours post-transfection, 1: untreated; 2: scrambled siRNA; 3 & 4: LIV-1 siRNA (#8 and #9).
We subsequently performed invasion assays using the modified Boyden chamber assays on TOV3133G and TOV2295(R) cells after siRNA transfection. Our results show that TOV3133G cells with LIV-1 knocked-down (by both siRNAs tested) had significantly lower invasion capacity than that of control or siScr-treated cells (Figure 19). However, no significant difference was observed for the TOV2295(R) cells, although a tendency of less invading cells can be seen (Figure 20). It is possible that the LIV-1 protein was less efficiently knocked-down in this cell line. Western blot analysis was not performed for this cell line. Our results suggest that LIV-1 plays a role in cell invasion of HGSC cells.
4.5 Effect of LIV-1 knockdown by siRNA on HGSC cell migration
We further evaluated the effect of LIV-1 knockdown on the migration capacity of the TOV3133G and TOV2295(R) cells using the scratch assay. No significant difference in migration speed was observed for any of the two cell lines after transfection with either of the LIV-1 siRNAs (Figures 21 and 22). These results indicate that LIV-1 does not play a role in cell migration.
Figure 19. Effect of LIV-1 knockdown on the invasion capacity of TOV3133G cells. A)
Representative images of invasive TOV3133G cells (1) control non-treated, (2) control siScr-treated, (3) siLVI-1 #8, (4) siLVI-1 #9. B) Quantification of the invading cells at 48h post-transfection. Bars represent mean ± SEM. *p<0.05. NS = not significant. C) Table showing the quantification values.
(1)$
(2)$
(3)$
(4)$
*$
NS$
NS$
TOV3133G' Number'of'invading'cells'(mean'±'SEM)'
Untreated(cells( 386(±(42( Scramble(siRNA( 344(±(16( LIV=1(siRNA(#8( 208(±(29( LIV=1(siRNA(#9( 282(±(4(
A)#
C)#
B)#
Figure 20. Effect of LIV-1 knockdown on the invasion capacity of TOV2295(R) cells. A)
Representative images of invasive TOV2295(R) cells (1) control non-treated, (2) control siScr-treated, (3) siLVI-1 #8, (4) siLVI-1 #9. B) Quantification of the invading cells at 48h post-transfection. Bars represent mean ± SEM. *p<0.05. NS = not significant. C) Table showing the quantification values.
Figure 21. Effect of LIV-1 knockdown on the Migration capacity of TOV3133G cells. A)
Representative images of TOV3133G cell migration 48h transfection and at 0h, 6h and 24h post-scratch. (1) control non-treated, (2) control siScr-treated, (3) siLVI-1 #8, (4) siLVI-1 #9. B) Quantification of the migration speed expressed as micrometers per hour. Bars represent mean ± SEM. NS = not significant. C) Table showing the quantification values.
(0h) (6h) (24h) (1)$ (2)$ (3)$ (4)$
A)#
C)#
B)#
NS$ TOV3133G' μm/h'(mean'±'SEM)'Migra-on'speed'
Untreated(cells( 4.26(±(0.48(
Scramble(siRNA( 3.63(±(1.99(
LIV@1(siRNA(#8( 4.58(±(0.80(
Figure 22. Effect of LIV-1 knockdown on the Migration capacity of TOV2295(R) cells. A)
Representative images of TOV2295(R) cell migration 48h transfection and at 0h, 6h and 24h post-scratch. (1) control non-treated, (2) control siScr-treated, (3) siLVI-1 #8, (4) siLVI-1 #9. B) Quantification of the migration speed expressed as micrometers per hour. Bars represent mean ± SEM. NS = not significant. C) Table showing the quantification values.
A)#
C)#
B)#
NS# TOV2295(R)* Migra0on*speed* μm/h*(mean*±*SEM)* Untreated(cells( 6.63(±(0.86( Scramble(siRNA( 8.89(±(3.33( LIV=1(siRNA(#8( 6.84(±(1.13( LIV=1(siRNA(#9( 4.85(±(1.01( (0h) (6h) (24h) (1)# (2)# (3)# (4)#
5 Discussion
Epithelial ovarian cancer (EOC) is a very aggressive disease, and usually patients are diagnosed at an advanced stage.53 A large number of EOC markers have been investigated to date, and some of them could explain the aggressiveness of the disease, such as the tumour suppressor gene TP53 and the cell cycle regulator cyclin E.27 LIV-1 belongs to the family of zinc transporters. LIV-1 might influence tumour progression by altering zinc homeostasis 39, but it has attracted more attention for its involvement in the migration and invasion processes in various types of cancer.41,44 These two functions are indicators of disease aggressiveness. The mechanism proposed is that LIV-1 is a downstream target of STAT3, and that LIV-1 is essential for the nuclear localization of Snail, which has a known role in EMT.38,40 In addition, LIV-1 contains a potential metalloprotease motif similar to that present in the matrix metalloproteases (MMPs) that could play a role in cancer metastasis.32 In ovarian cancer cells, LIV-1 has been shown to confer resistance to trichostatin A by inhibiting apoptosis.45
Here we showed that LIV-1 play a significant role in HGSC cell invasion but not migration. Interestingly, we consistently detected a 48kD protein band in our Western blot analyses of HGSC cell lines, in contrast to the literature where a band of 84-100kD was observed.32,42,43,45 This result cannot be attributed to antibody specificity since both bands were detected in control breast (MCF7) and prostate (LNCaP) cell lines (data not shown). Therefore, we think that this difference could be explained by post-translational changes.39 The LIV-1 protein is cleaved on the N-terminus before locating to the plasma membrane 39 and this N-terminal proteolytic cleavage of LIV-1 explains the different bands obtained by Western blot. Another possibility is that the 48kD band is originated from a splice variant of
the SLC39A6 gene. There are two human transcript variants available at the GeneBank: NM_012319, variant 1, longer, 3637 bp; and NM_001099406, variant 2, shorter, 1681 bp. The main difference between these transcripts is the lack of exon 2 in variant 2. Reverse transcription polymerase chain reaction (RT-PCR) experiments using primers flanking this exon could be performed to verify whether this is the case. High molecular weight LIV-1 was also described for other ovarian cancer cell lines, i.e. A2780 and SKOV3.45 The discrepancy with our results could be explained by differences in EOC subtypes. The cell lines A2780 and SKOV3, although widely used, cannot be classified as HGSC 54,55; they do not harbour TP53 mutations but carry ARID1A mutations (mostly found in clear cell and endometrioid ovarian cancers 54,56). It will be interesting to perform Western blot analysis using cell lines from our laboratory that were derived from other EOC subtypes, using our conditions and antibody. Furthermore, we observed a weak positive correlation (Figure 12) between LIV-1 mRNA levels, assessed by microarray data, and protein levels evaluated by Western blot. This weak correlation might be explained by the posttranscriptional regulatory mechanisms of LIV-1, resulting in altered protein degradation, or by the presence of un-transcribed mRNA.39 To address this discrepancy, it will be important to perform quantitative RT-PCR (qRT-PCR) using different primers (recognizing several regions of the SLC39A6 mRNA) in order to evaluate with more precision the correlation between mRNA and protein levels. Moreover, we showed that primary cultures of NOSE cells express very small quantities of the LIV-1 protein, suggesting that this protein is overexpressed in HGSC cells and might play a role in tumor progression. The LIV-1 overexpression in cancer cells could be a result from altered expression of metabolic genes occurring during a neoplastic transformation in order to