spectroscopy of the
cis-1,2-dichloroethylene (1,2-ClHC=CHCl) in the
5-20 eV range. An experimental and
theoretical investigation
Cite as: AIP Advances 9, 015305 (2019); https://doi.org/10.1063/1.5066368
Submitted: 15 October 2018 . Accepted: 21 December 2018 . Published Online: 11 January 2019 R. Locht , D. Dehareng, and B. Leyh
The vacuum UV photoabsorption spectroscopy
of the cis-1,2-dichloroethylene (1,2-ClHC=CHCl)
in the 5-20 eV range. An experimental
and theoretical investigation
Cite as: AIP Advances 9, 015305 (2019);doi: 10.1063/1.5066368
Submitted: 15 October 2018 • Accepted: 21 December 2018 • Published Online: 11 January 2019
R. Locht,1,a) D. Dehareng,2and B. Leyh1 AFFILIATIONS
1UR MolSys, Molecular Dynamics Laboratory, Department of Chemistry, Building B6c, University of Li`ege, Sart-Tilman,
B-4000 Li`ege 1, Belgium
2Center for Protein Engineering, Department of Life Sciences, Building 6a, University of Li`ege, Sart-Tilman,
B-4000 Li`ege 1, Belgium
a)Corresponding author: Tel. +32 4 366 3520: Fax: +32 4 366 3413; E-mail address:robert.locht@ulg.ac.be(R. Locht)
ABSTRACT
The photoabsorption spectrum of cis-1,2-C2H2Cl2has been examined in detail in the vacuum UV range between 5 eV and 20 eV
photon energy by using synchrotron radiation. Quantum chemical calculations are proposed and applied to the electronic transitions and to the vibrational structures belonging to these transitions. The broad band observed at 6.568 eV includes the ˜X1A
1→11B1, 31B2 and 21B1 transitions. The two latter excitations correspond to the valence 2b1(π)→π∗ and to the Rydberg
2b1(π)→3s transitions. The former excitation is described by a more complex 2b1(π)→nCl +σ∗CH/Rpσ transition where valence
and Rydberg characters are strongly mixed. For these transitions short vibrational progressions are observed, analyzed and tentatively assigned. The abundant structure observed between 7.0 eV and 10.0 eV has been analyzed in terms of vibronic transitions to one ns- ( ¯δ = 0.960), two np- ( ¯δ = 0.525 and 0.337), and two nd-type ( ¯δ = 0.080 and 0.002) Rydberg series, all converging to the ˜X2B
1ionic ground state. The vibrational structure analysis of the Rydberg states leads to the following
aver-age wave numbers: ω2 ≈1420 cm-1(C=C stretching), ω3≈1190 cm-1(symmetric C-H bending), ω4≈800 cm-1(symmetric C-Cl
stretching) and ω5 ≈190 cm-1 (symmetric C-Cl bending). These numbers are compared to previously reported values. Many
other transitions are observed between 10 eV and 20 eV and are assigned to transitions to Rydberg states converging to the successive excited states of cis-1,2-C2H2Cl2+. For several of these Rydberg states, a vibrational structure is also observed and
interpreted.
©2019 Author(s). All article content, except where otherwise noted, is licensed under a Creative Commons Attribution (CC BY) license (http://creativecommons.org/licenses/by/4.0/).https://doi.org/10.1063/1.5066368
I. INTRODUCTION
The chlorinated derivatives of ethylene are important reactants in several industrial applications. They are also used to replace long-living ozone-depleting agents.1 As a
consequence, these compounds became widely spread but were found to be abundant atmospheric air pollutants.2Their
toxicity and potential carcinogenicity have been investi-gated.3 Several groups studied the release of the highly
ozone-depleting Cl atom and HCl molecule by UV pho-tons4–6 or atmospheric OH attack7,8 in the three isomers
of dichloroethylene. Gas-phase ion chemistry of these com-pounds has also been reported.9These aspects were almost
the studies on the photoabsorption spectrum of both com-pounds remain scarce and mainly restricted to the 160-135 nm (or 7.75-9.18 eV) wavelength region.
The first vacuum UV photoabsorption spectrum (PAS) of the two 1,2-C2H2Cl2isomers has been reported by Mahncke
and Noyes10in 1935. They recorded the spectra between the
visible region and 75 nm (16.53 eV). They roughly divided them into three parts: (i) a broad continuum starting at 240 nm (5.17 eV) with a maximum at 190 nm (6.52 eV), (ii) a dis-crete absorption spectrum extending from 157 nm (7.90 eV) to 135 nm (9.18 eV) and (iii) a continuous absorption below 128 nm (9.69 eV) in the cis-isomer and a series of diffuse bands in the trans-isomer. A Rydberg series classification and a vibrational analysis were attempted. Ionization energies were obtained by Rydberg series extrapolation.
Walsh11 recorded the vacuum UV PAS of all
chloroethylenes, except the 1,1-C2H2Cl2 species. Beside the
broad continuum peaking at 185-195 nm (6.70-6.36 eV), vibra-tional progressions of different Rydberg series were observed and analyzed in all spectra.
Walsh and Warsop12 reported a detailed analysis of the
vacuum UV PAS of the cis-1,2-C2H2Cl2. They mention the
continuum peaking at 190 nm (6.52 eV) but their attention was focused on the analysis and discussion of the discrete spectrum measured between 167 and 143 nm (7.42-8.67 eV).
In a paper on the photochemical HCl-loss from chloroethylenes, Berry4 measured the vacuum UV
absorp-tion spectrum of all chlorinated derivatives of ethylene in the 260-140 nm range (4.77-8.86 eV) and analyzed in more detail the broad band located between 240 and 180 nm (5.17-6.88 eV). The discrete part of the spectrum has not been analyzed.
Closely related to photoabsorption spectroscopy, the low electron energy-loss spectroscopy of all chloro-substituted ethylenes C2HxCl4-x has been reported by Koerting et al.13
This work was essentially focused on the singlet-triplet valence transitions. Excitations to singlet valence and Rydberg states below 7.0 eV were also observed.
On the quantum chemical level, Arulmoziraja et al.14
pre-sented an extended high-level theoretical study on the elec-tronic transitions in the cis- and trans-dichloroethylenes, and in tetrachloroethylene using the SAC-CI theory. The main pur-pose was to obtain the electronic spectra and to assign excita-tions to valence and Rydberg states of both singlet and triplet multiplicity. More recently, Khvostenko15 reported DFT
cal-culations at the B3LYP/6-311-G(d,p) level of the transitions to excited valence singlet and triplet states of chloroethylene molecules.
We recently reported on the vacuum UV PAS study of 1,1-C2H2Cl216 observed and analyzed between 5 eV and 20 eV
photon energy. In the frame of our work on this series of molecular systems, the aim of the present paper is to propose a detailed analysis of the vacuum UV photoabsorption spec-trum of the cis-1,2-C2H2Cl2isomer (i) at medium resolution
but for the first time in the 10-20 eV photon energy range and (ii) at higher resolution between 5.0 and 13.0 eV, with vibra-tional structure analysis. Quantum chemical calculations will be used to support the assignments. In a near future a similar work on the trans-1,2-C2H2Cl2isomer will be reported.17
II. EXPERIMENTAL
The experimental setup used in this work at the BESSY I and II synchrotron radiation facilities (Berlin, Germany) has been described previously.18 Briefly, two
monochro-mators have been used. For medium resolution spectra (resolving power of 1200 at hν = 10 eV), a modified 1.5 m-NIM 225 McPherson monochromator equipped with a 1200 lines/mm gold-coated laminar Zeiss grating was used. High resolution measurements (resolving power of about 15000 at 10 eV) have been reached with a 3m-NIM monochro-mator equipped with an Al/MgF2 spherical grating of
600 lines/mm.
The synchrotron radiation intensity and the pressure inside the cell were monitored, ensuring reliable absorption data. The sample pressure was kept in the 30-40 µbar to pre-vent saturation. The cis-1,2-C2H2Cl2sample purchased from
Aldrich (99% stated purity) was used without further purifica-tion.
As described and discussed in detail in previous works, a continuum subtraction procedure has been applied to bet-ter identify and characbet-terize weak and/or diffuse structures superimposed on an intense continuum.19,20 The resulting
spectrum is denoted as ∆-plot. This data handling procedure has been validated by Marmet21and Carbonneau.22
The wavelength scales calibration is based on the Ar absorption spectrum between the 2P
3/2 and the 2P1/2 ionic
states, with an accuracy better than 2 meV. Between 6 eV and 20 eV photon energy, the photoabsorption spectrum has been recorded with energy increments of 15 meV, so that the energy
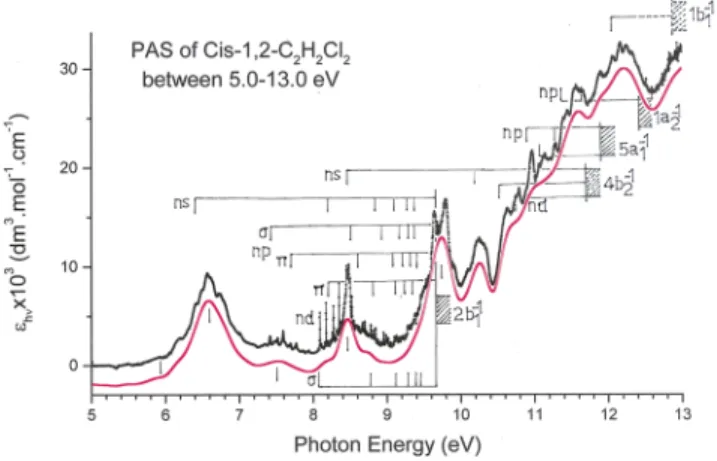
FIG. 1. Vacuum UV photoabsorption spectrum of cis-1,2-C2H2Cl2between 5 eV
and 13 eV photon energy. The continuous red curve corresponds to the strongly smoothed PAS curve by fast Fourier transform. Vertical bars locate valence and Rydberg transitions and shaded areas show their convergence limit. Dotted areas correspond to vertical ionization energies.
positions have an uncertainty of about 8 meV. The 5-15 eV range has also been investigated with energy increments of 2 meV. Several parts of the spectrum, e.g., 7.0-10.0 eV and 11.6-12.2 eV, have also been recorded with 500 µeV energy steps. The energy positions are here known within ±2 meV. Repro-ducibility of energy positions has been checked with spectra recorded over several years.
III. EXPERIMENTAL RESULTS
Fig. 1 displays the vacuum UV PAS of cis-1,2-C2H2Cl2
between 5 eV and 13 eV photon energy, with 2 meV energy increments.
The whole 5-20 eV range may be split in four distinct regions: (i) the 5.0-7.2 eV region consists of a number of weak broad bands superimposed on a continuum; (ii) the 7.2-9.6 eV range contains a large number of weak to very weak sharp features and bands superimposed on a relatively weak con-tinuum with steeply increasing intensity starting at 9.2 eV;
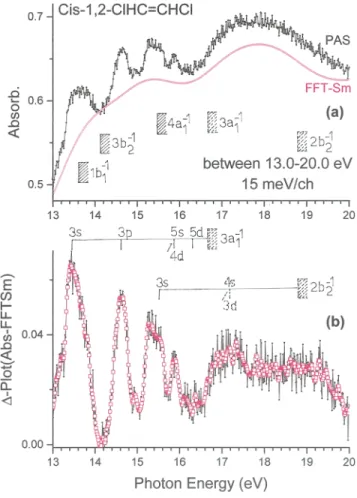
FIG. 2. Vacuum UV photoabsorption spectrum of cis-1,2-C2H2Cl2in the 13 - 20 eV
range: (a) direct absorbance spectrum as recorded with the 1.5 m NIM monochro-mator, (b) ∆-plot. The red curve (FFTsm) corresponds to slightly smoothed data. Vertical bars indicate the band maxima and shaded areas correspond to the ion-ization energies of cis-1,2-C2H2Cl2. Dotted areas correspond to vertical ionization
energies.
(iii) the region above 9.2 eV and up to 13 eV consists of a series of weak, fairly narrow structures superimposed on a strong continuum; (iv) the spectral range above 13 eV is displayed in Fig. 2aand consists of several successive broad bands up to 20 eV; the corresponding ∆-plot is displayed in Fig. 2b. The positions of the Rydberg transitions and the convergence limits23are identified.
Tables IandIIlist the energies of the vibrationless transi-tions to Rydberg states converging respectively to the ground
TABLE I. Rydberg series observed in the vacuum UV photoabsorption spectrum of cis-1,2-C2H2Cl2converging to the ˜X2B1 (cis-1,2-C2H2Cl2+) ionic ground state at
9.666 eV. Energy positions (eV), wavenumbers (cm-1), effective quantum numbers (n∗), average quantum defects ( ¯δ) and assignments as proposed in this work (1 eV=
8 065.545 cm-124). Comparison is made with the literature data of Refs.10–12.
This Work 10 11 12 eV cm-1 n∗ cm-1 2b1→ns ( ¯δ=0.96±0.01) 6.398 51603 2.040 - - -8.192 66077 3.039 66020 65840 [65870] 8.836 71267 4.049 71220 71652 [70736] 9.130 73642 5.041 73652 73652 [73357] 9.295 74969 6.056 74954 74941 [74810] 9.390 75711 7.021 [75648] 2b1→npσ ( ¯δ=0.53±0.01) 7.414 59798 2.458 59734 8.547 68936 3.487 69060 8.985 72469 4.470 72408 9.214 74316 5.486 74240 9.340 75332 6.460 9.424 76010 7.498 2b1→npπ ( ¯δ=0.34±0.02) 7.740 62427 2.658 62605 8.643 69710 3.647 69796 69847 9.045 72953 4.681 72957 9.245 74566 5.685 74590 9.357 75469 6.636 75437 9.435 76048 7.674 2b1→ndσ ( ¯δ=0.08±0.03) 8.089 65242 2.918 65260 65182 8.777 70791 3.912 70717 70725 70736 9.097 73396 4.903 73328 73331 9.274 74816 5.907 74843 74749 9.383 75655 6.897 75575 9.449 76211 7.992 9.495 76582 8.920 2b1→ndπ ( ¯δ=0.002±0.008) 8.170 65895 3.015 [65870] 8.806 71025 3.978 [70736] 9.123 73582 5.006 [73357] 9.284 74880 5.999 [74810] 9.380 75655 6.996 [75648]
TABLE II. Rydberg series converging to the ionic excited states observed in the vacuum UV photoabsorption spectrum of cis-1,2-C2H2Cl2. Energy position (eV),
wavenumber (cm-1), effective quantum numbers (n∗) and assignments proposed in
this work. The IE’s used as convergence limit23are IE
vertfor 4b2-1, 3a1-1and 2b2-1
are 11.690 eV, 16.732 eV and 18.8 eV and IEadfor 5a1-1, 1a2-1and 1b1-1are 11.965
eV, 12.375 eV and 13.592 eV successively. Conversion factor: 1 eV = 8 065.545 cm-1.24 eV cm-1 n∗ Assign. 4b2→a 8.446 67791 2.050 3s 10.252 82010 3.075 4s 10.584 84430 3.507 4p(π) 10.792 86527 3.892 4d 5a1→ 10.880 87753 3.541 4p 11.120 89689 4.013 5s/4d 11.275 90939 4.441 5p(σ) 11.536 93044 5.631 6p(π) 1a2→ 11.342 91479 3.629 4p(π) 11.750 94770 4.666 5p(π) 1b1→ 12.054 97222 3.041 4s/3d 3a1→a 13.39 108000 2.02 3s 14.65 118160 2.56 3p 15.85 127840 3.93 4d/5s 16.15 130260 4.84 5d 2b2→a 15.55 125420 2.03 3s 17.30 139534 2.97 4s/3d
aThe vertical ionization energy is used as convergence limit for these series.
and to excited ionic states. Previous data from the literature are also mentioned.10–12
IV. AB INITIO CALCULATIONS: METHODS AND RESULTS
A. Computational tools
Quantum chemical calculations were performed with the Gaussian 09 program package.25 The aug-cc-pVDZ basis set
containing polarization as well as diffuse functions26was used
throughout. In specific cases, calculations with the basic cc-pVDZ set, which does not include diffuse functions, were also performed.
Geometry optimizations have been performed at the CCSD(FC),27,28DFT(M06-2X)29and TDDFT30levels.
The wavenumbers of the twelve vibrational normal modes were computed at the DFT(M06-2X) and TDDFT(M06-2X) levels.
B. Results of the calculations
The results of the geometry optimizations in the C2v, C2
and CSsymmetry point groups at different computational
lev-els are presented in Table S1 (see supplementary material). These results are compared and discussed below.
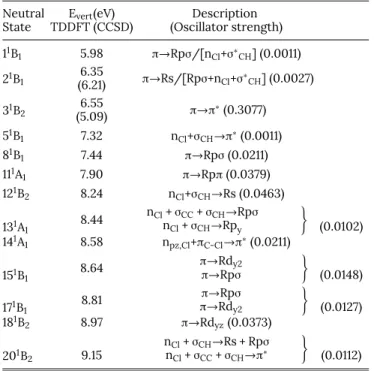
The calculated vertical transition energies to several neu-tral excited states are listed inTable IIIwith respect to the neutral ground state in the C2vsymmetry group. Only those
neutral states excited with non-zero oscillator strength are mentioned.
The two lowest1B
1excited states calculated at the TDDFT
level show a mixed character involving similar configura-tions but with different weights. For the 11B
1 at 5.98 eV,
the main character is R’p’σ (where R stands for “Rydberg state”) with an important [nCl+σ∗CH] component whereas for
the 21B
1 at 6.35 eV the R’s’ character is dominant with
a smaller [R’p’σ+nCl+σ∗CH] component. These states are
therefore expected to be strongly coupled but this cou-pling is probably overestimated at the TDDFT level, lead-ing to a very low energy for the first state. The first
1B
2 excited state, however, corresponds to a nearly pure
π→π∗ configuration and has by far the largest oscillator
strength.
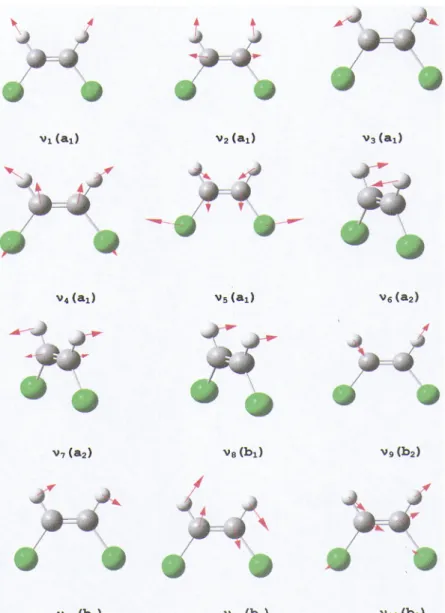
The vibrational wavenumbers associated with the twelve normal modes represented inFig. 3have been calculated for the first four excited states of the neutral molecule at the
TABLE III. Vertical excitation energies (eV) leading to neutral excited states of cis-1,2-C2H2Cl2as obtained at the TDDFT level and description of the transitions involved.
The corresponding calculated oscillator strengths are indicated in parentheses. The calculations were performed with the aug-cc-pVDZ basis set. The notation R stands for “Rydberg state”.
Neutral Evert(eV) Description
State TDDFT (CCSD) (Oscillator strength) 11B 1 5.98 π→Rpσ/[nCl+σ∗CH] (0.0011) 21B 1 (6.21)6.35 π→Rs/[Rpσ+nCl+σ∗CH] (0.0027) 31B 2 (5.09)6.55 π→π∗(0.3077) 51B 1 7.32 nCl+σCH→π∗(0.0011) 81B 1 7.44 π→Rpσ (0.0211) 111A 1 7.90 π→Rpπ (0.0379) 121B 2 8.24 nCl+σCH→Rs (0.0463) 131A 1 8.44 nCl+ σCC+ σCH→Rpσ nCl+ σCH→Rpy ) (0.0102) 141A 1 8.58 npz,Cl+πC-Cl→π∗(0.0211) 151B 1 8.64 π→Rdy2 π→Rpσ ) (0.0148) 171B 1 8.81 π→Rpσ π→Rdy2 ) (0.0127) 181B 2 8.97 π→Rdyz(0.0373) 201B 2 9.15 nCl+ σCH→Rs + Rpσ nCl+ σCC+ σCH→π∗ ) (0.0112)
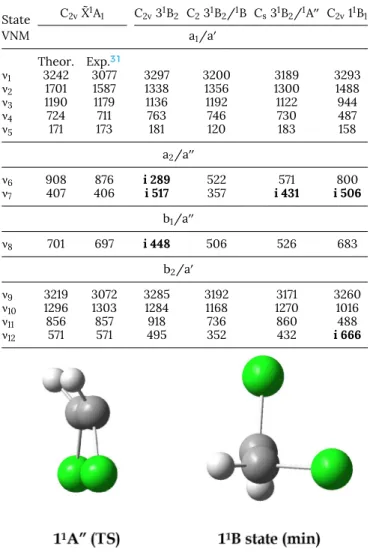
FIG. 3. Schematic representation of the twelve vibrational normal modes of the cis- 1,2-C2H2Cl2 molecule in the
C2vsymmetry point group (and their irreducible
represen-tations) for which the associated wavenumbers have been calculated.
TDDFT level in the C2v symmetry group and are listed in
Table IV. The presence of imaginary wave numbers indicates that these C2vgeometries do not correspond to equilibrium
situations.Table Vreports the vibrational wavenumbers of the neutral ground state in the C2vgroup31 and of the first1B2
excited state (π→π∗) in the C
2v,C2and CSgroups, computed at
the DFT (M06-2X) level.
These optimizations of the 31B
2 excited state lead to an
equilibrium geometry corresponding to a twisted situation of C2 symmetry (all real wavenumbers, seeTable V, column 5).
In this geometry, the π→π∗state belongs to the1B
representa-tion. The C=C bond is moderately lengthened compared to the ground state but the bond angles are substantially modified (see Table S1). A saddle point is obtained in Cs(one imaginary
wavenumber, seeTable V, column 6) and a third order critical
point in C2v(stationary point with three imaginary
wavenum-bers, seeTable IV, column 4 andTable V, column 4). Compared to the C2 minimum, the stationary points in Cs and C2v are
destabilized by 1.13 eV and 1.24 eV, respectively. They are char-acterized by a very large C=C bond lengthening (nearly 0.2 Å) and large bond angle modifications.
Furthermore, at the optimized twisted C2 geometry of
the 31B
2/1B state, the ˜X1A state is higher in energy. Internal
conversion from the 1B state to the ˜X1A state is expected to
take place upon relaxation. Anticipating the publication of the calculation results on trans-1,2-C2H2Cl2,17 it can be
empha-sized that the 31B
2 optimized geometry is also that obtained
from the optimization of the first excited state in the trans-isomer. It can therefore, be predicted that the isomerization is obviously photo-induced.
TABLE IV. Vibrational wavenumbers (cm-1) calculated for the twelve normal modes (VNM) (seeFig. 3) of the first four excited states in the C2v symmetry group at
the TDDFT(M06-2X) level. For the neutral ground state comparison is made with experimental data.31Imaginary wavenumbers are bold printed.
State 11B1 21B1 31B2 51B1 VNM a1/a0 ν1 3279 3048 3293 3320 ν2 1529 1427 1269 1470 ν3 933 1205 1112 1083 ν4 481 778 760 765 ν5 147 159 189 270 a2/a00 ν6 840 901 i 439 i 637 ν7 i 297 i 420 i 964 i 766 b1/a00 ν8 680 686 i 738 i 728 b2/a0 ν9 3251 3066 3281 3303 ν10 1029 1359 1266 1164 ν11 510 943 911 787 ν12 i 512 553 484 485
Geometry optimizations in other symmetry point groups (Cs, C2and C1) for the 11B1 and 21B1states have been
unsuc-cessful owing to the large variation of the electronic energies upon geometry change, leading to numerous crossings.
V. DISCUSSION OF THE EXPERIMENTAL DATA
In the C2vpoint group, the molecular orbital configuration
of cis-1,2-C2H2Cl2is given by
1s2(Cl1) 1s2(Cl2) 1s2(C1) 1s2(C2) 2s2(Cl1) 2s2(Cl2) 2p6x,y,z(Cl1) ×2p6x,y,z(Cl2) 1a21 1b222a21 2b223a21 4a21 3b221b21 1a22 ×5a21 4b222b21 : ˜χ1A1
where 1a1is the deepest outer-valence shell orbital.
We recently measured the HeI-PES and threshold photo-electron spectra (TPES) of cis-1,2-C2H2Cl2,which will be the
subject of a forthcoming paper.23 The lowest adiabatic
ion-ization energy leading to cis-1,2-C2H2Cl2+( ˜X2B1) is equal to
(9.666±0.006) eV. This value is in very good agreement with earlier32–34and with the most recent35,36determinations. The
vertical value is measured at 9.843 eV.23
Eight bands were observed by HeI-PES at higher energies and were characterized by their adiabatic ionization ener-gies at 11.426 eV, 11.965 eV, 12.375 eV, 13.592 eV, 14.083 eV, 15.531 eV and 16.638 eV and at about 18.40 eV.23 The
corre-sponding vertical values are 11.690 eV, 12.028 eV, 12.460 eV,
TABLE V. Vibrational wavenumbers (cm-1) calculated for the twelve normal modes (VNM) (seeFig. 3) of the neutral ground and first excited states in the C2v, C2and
CSsymmetry point groups at the DFT(M06-2X) level. For the neutral ground state
comparison is made with experimental data.31 Imaginary wavenumbers are bold
printed. State C2vX˜1A1 C2v31B2 C231B2/1B Cs31B2/1A00 C2v11B1 VNM a1/a0 Theor. Exp.31 ν1 3242 3077 3297 3200 3189 3293 ν2 1701 1587 1338 1356 1300 1488 ν3 1190 1179 1136 1192 1122 944 ν4 724 711 763 746 730 487 ν5 171 173 181 120 183 158 a2/a00 ν6 908 876 i 289 522 571 800 ν7 407 406 i 517 357 i 431 i 506 b1/a00 ν8 701 697 i 448 506 526 683 b2/a0 ν9 3219 3072 3285 3192 3171 3260 ν10 1296 1303 1284 1168 1270 1016 ν11 856 857 918 736 860 488 ν12 571 571 495 352 432 i 666
13.828 eV, 14.083 eV, 15.684 eV, 16.732 eV and about 18.8 eV successively.23,32–34
A. The valence transitions (Figs. 1,4and5)
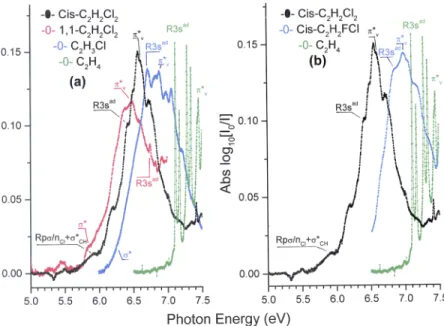
The characteristic low energy broad band observed in the vacuum UV PAS of the ethylene compounds displays a dou-blet maximum at 6.568 eV-6.620 eV in cis-1,2-C2H2Cl2(Fig. 4).
Compared to our observations in the chlorinated derivatives investigated up to now,16,37,38this band has a similar
inten-sity and extends between 5.3 eV and 7.3 eV. It results from the superposition of several contributions.
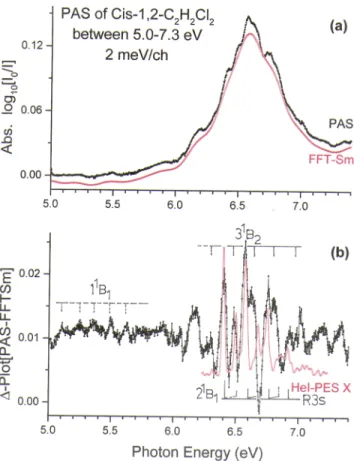
To enhance the weak structures superimposed on the continuum the subtraction method mentioned in SectionII
FIG. 4. Comparison of the 5.0-7.5 eV band in the vac-uum UV photoabsorption spectra of C2H4and the (a) three
chlorinated ethylenes C2H3Cl, 1,1-C2H2Cl2 and
cis-1,2-C2H2Cl2and (b) the doubly substituted ethylenes
cis-1,2-C2H2Cl2and cis-1,2-C2H2FCl. The valence (σ∗ and π∗)
and the Rydberg (R3s) transitions are indicated for each molecule.
has been applied. The red curve in Fig. 5a represents the continuum which is subtracted from the original signal. The result of this subtraction operation is displayed in Fig. 5b which clearly shows two different parts: (i) between 5.0 eV and 6.0 eV a very weak series of peaks with spacing sug-gesting a vibrational progression and (ii) between 6.0 eV and 7.0 eV a more intense series of alternating broad and narrow peaks.
The very weak signal between 5.0 eV and 6.0 eV may be interpreted as part of the transitions to a longer vibra-tional progression belonging to a singlet valence excited state. A π→σ∗ state is a reasonable candidate. By quantum
chemical calculations, Arulmozhiraja et al.14 calculated the
π→σ∗(11B
1) transition energy at 6.45 eV in cis-1,2-C2H2Cl2
whereas Khvostenko15 predicted this transition at 6.52 eV.
The present calculations indicate a more complex situation where the final 11B
1state has a strongly mixed Rydberg (R’p’σ)
and valence [nCl+σ∗CH] character (seeTable III). The predicted
oscillator strength is very weak. At both DFT and TDDFT (M06-2X) levels the optimized geometry of the 11B
1 state in the C2v
point group corresponds, however, to a transition state whose vibrational wavenumbers have been calculated (seeTable IV). As discussed in SectionIV B, optimization attempts in lower symmetry groups were unsuccessful. The identified peaks of the very weak signal are shown by dashed lines in Fig. 5b. An average separation of 0.12±0.01 eV (960±80 cm-1) could
be determined. This compares favorably with the values of 933 cm-1(TDDFT) or 944 cm-1(DFT) predicted for the in-plane
C-H bending mode excitation ν3 (seeFig. 3) and is
compat-ible with the large change in the optimized H-CC angle (see Table S1).
The 6.0-7.0 eV energy range consists of a complex series of fairly narrow peaks entangled in a sequence of broader structures. As far as the diffuse features starting at 6.16 eV
are concerned, a regularly distributed intensity is observed up to 7.0 eV at intervals of about 0.15±0.02 eV (1200±160 cm-1).
The maximum intensity for this progression is observed at 6.62 eV. The most probable transition at this energy is likely the π→π∗(31B
2) transition whose vertical energy is predicted
at 6.55 eV at the TDDFT level (seeTable III). As mentioned in SectionIV B, this state has to cross the ground state, lead-ing to an internal relaxation which may be responsible for the diffuseness of the detected structures. Arulmozhiraja et al.14
calculated this excitation at 6.93 eV. The vibrational structure with ω≈1200±160 cm-1, superimposed on the strong
contin-uum may likely be assigned to the ν2(C=C stretching) or ν3(C-H
bending) vibrations (seeFig. 3) calculated at 1269 cm-1and 1112
cm-1respectively (seeTable IV). The large change in the C=C
bond length of the optimized geometry of the 31B
2state (Table
S1) is expected to induce an excitation of the C=C stretching vibration.
Fig. 4compares the relative energy position of these two transitions in chlorinated compounds: C2H4is used as a
ref-erence.Fig. 4ashows that the presence of a second Cl-atom induces a shift to lower energy of the σ∗and π∗states. For the
latter a systematic energy lowering from 6.880 eV (C2H3Cl)37
to 6.620 eV (cis-1,2-C2H2Cl2) and 6.482 eV (1,1-C2H2Cl2)16 is
observed. The substitution in cis-position induces a shift to higher energy with respect to the 1,1-isomer. Fig. 4bclearly shows the expected shift to lower energy produced by the substitution of F by a Cl-atom in the cis-isomers: from 7.11 eV38
to 6.62 eV.
The short sequence of narrower peaks observed between 6.4 eV and 7.0 eV and assigned to the π(2b1)→3s Rydberg
transition will be discussed in the next sectionV B 1.
Above the photon energy of 7.0 eV, several valence transitions are predicted by quantum chemical calculations,
FIG. 5. (a) Vacuum UV photoabsorption spectrum of cis-1,2-C2H2Cl2 on an
expanded. photon energy scale between 5.0 eV and 7.5 eV. The continuous red curve labeled FFT-Sm corresponds to the strongly smoothed PAS curve by fast Fourier transform. (b) ∆-plot of the PAS. Vertical bars indicate the vibrational pro-gressions. The red curve corresponds to the HeI-PES band of the ˜X2B
1cationic
state of cis-1,2-C2H2Cl2.
i.e. at 7.32 eV, 8.58 eV and 9.15 eV successively (seeTable III). In agreement with these predictions, a short but fairly well defined progression consisting of three broad weak peaks starts at 7.322 eV (see Fig. 1) and is followed by structures at 7.477 eV and at 7.613 eV (seeFig. 6a). These structures are superimposed on a broad background with its maximum at 7.6 eV (see red curve inFig. 1). We suggest to assign this part of the spectrum to the nCl+σCH→π∗ transition predicted at
7.32 eV and leading to the 51B
1state (seeTable III). The average
interval of 0.146±0.009 eV (1180±70 cm-1) could be assigned
to the excitation of the C-H bending vibration (seeFig. 3and Table IV). This assignment is also supported by the predicted geometry changes in the optimized conformation (see Table S1). Mahncke and Noyes10 mentioned non-assigned “diffuse
bands” at 60562 cm-1(7.509 eV) and 61169 cm-1(7.583 eV) which
are probably related to the present observations.
Below and close to the first vertical ionization limit of cis-1,2-C2H2Cl2 at 9.843 eV,23 two additional broad
struc-ture are observed, with maxima at 8.5 eV and 9.8 eV (see
red curve in Fig. 1). They may correlate with the transition energies predicted at the TDDFT level for npz,Cl+πCCl→π∗ at
8.58 eV (141A
1) and nCl+σCC+σCH→π∗at 9.15 eV (201B2)
respec-tively (see Table III). For comparison, Arulmozhiraja et al.14
calculated seven valence as well as Rydberg transitions tak-ing place between 8.04 eV and 8.43 eV: the lowest n→π∗
excitation is at 8.04 eV whereas two n→σ∗ transitions were
predicted at 8.24 eV and 8.38 eV. It is thus likely that both valence and Rydberg states are implied in this region of the absorption spectrum and the fine structure superimposed on the broad background might be interpreted as resulting from transitions to Rydberg states as discussed in the next section.
B. The Rydberg transitions
InFig. 1the PAS of cis-1,2-C2H2Cl2measured in the
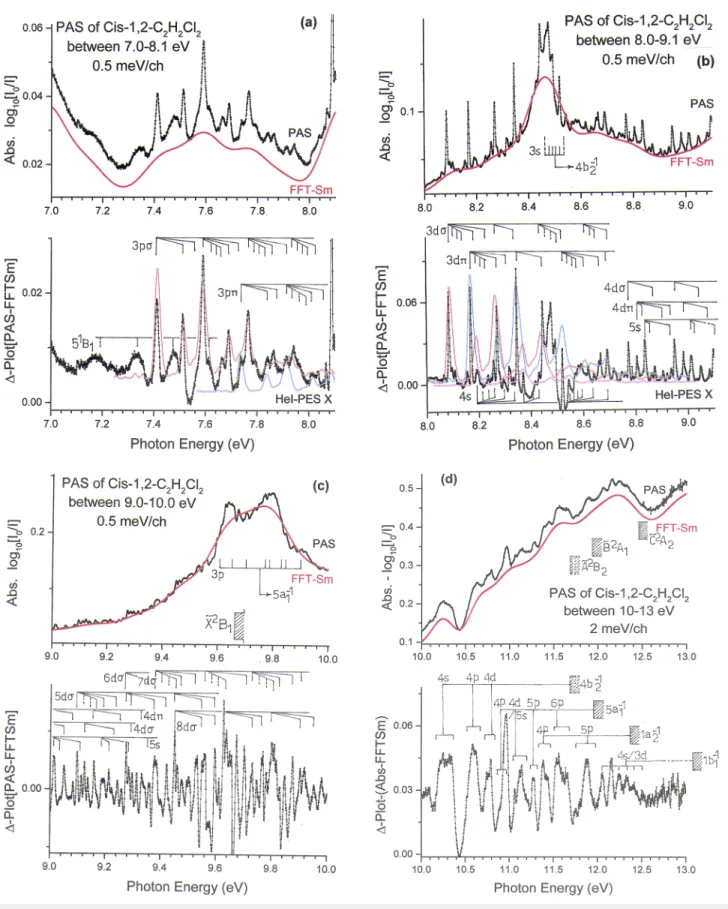
pho-ton energy range of 7.0 eV to about 13.0 eV displays numerous structures of variable intensity. Particularly from 7.4 eV up to about 9.0 eV, it exhibits a series of weak to very weak sharp features besides one stronger and broad transition. The origi-nal spectrum and the corresponding ∆-plot are displayed on an expanded energy scale in Fig. 6(a–d)for the 7.0-13.0 eV range. Between 7.0 and 10.0 eV, the spectrum has been recorded with 500 µeV energy increments.
As no prior information on the coupling among Rydberg states is available for this molecule, we used the Rydberg for-mula (1) as a zero-order assumption for the assignment of the spectral transitions:
ERyd= IE - R/(n − δ)2= IE - R/(n∗)2 (1)
In (1), R=13.6057 eV24 is the Rydberg constant, δ is the
quantum defect, and IE represents the ionization energy corresponding to the ionic state to which the Rydberg series converges. Any significant Rydberg-Rydberg coupling is then expected to affect the quality of the fits of the Rydberg formula to the experimental data. Furthermore, in the absence of coupling between Rydberg series, the quan-tum defect δ has typical values which are characteristic of the angular momentum of the Rydberg orbital. When cou-plings are involved, these values may be perturbed. Such per-turbations already allowed us to identify and quantitatively analyze transition between Hund’s coupling cases.39 The
quantum defect values are therefore important parameters to be determined.
The observed intensity distributions of the spectral fea-tures show Franck-Condon-like behaviors and do not follow the n-3 law, so that vibrational excitation of the successive
Rydberg states dominates the spectrum. If Rydberg-Rydberg couplings may be neglected, it is sensible to assume that very similar potential energy surfaces characterize the Rydberg states and the ionic state to which they converge, so that simi-lar vibrational structures are expected for a Rydberg state and the corresponding ionic state.38 The quality of the fits
indi-cates a posteriori whether this assumption holds. This proce-dure has already been successful to disentangle the vibrational structure in the vacuum UV spectra of C2H3F,401,1-C2H2F241
FIG. 6. Vacuum UV photoabsorption spectrum of cis-1,2-C2H2Cl2on an expanded. photon energy scale between 7.0 eV and 13.0 eV. The upper and lower parts show the
absorbance and the corresponding ∆-plot respectively for (a) 7.0-8.1 eV, (b) 8.0-9.1 eV, (c) 9.0-10.0 eV and (d) 10.0-13.0 eV. Vibrationless (0,0) transitions are indicated as long vertical bars, whereas the vibrational progressions are indicated as short bars. The ˜X2B
1-HeI-PES band is inserted by red, blue and magenta open dots. The 1b1-1
and 1,1-C2H2FCl.42 In the present case, to make the
compar-ison easier, the ∆-plot of the appropriate PAS energy range will be compared to the HeI-PES of the cis-1,2-C2H2Cl2+in its
ground or excited states as measured in our laboratory.23 1. Vibrationless Rydberg transitions between 6.4 eV and 10 eV (seeFig. 1)
The vibrationless Rydberg transitions observed for cis-1,2-C2H2Cl2 and converging to the first ionization limit lie
between 6.4 eV and 9.7 eV and are labeled in Fig. 1. Table I lists the energies and wavenumbers of these transitions with their associated effective quantum numbers and compares the results of the present work with previous investiga-tions by Mahncke and Noyes,10Walsh11and Walsh and
War-sop.12 The assignments are based on an adiabatic ionization
energy for the ionic ground state equal to 9.666±0.006 eV,23
in good agreement with the value provided by Walsh and Warsop (IE = 9.652 eV).12 As mentioned in section II, the
estimated uncertainty on the transition energies is 2 meV (16 cm-1). No error estimation is available for the literature
data.10–12
The observed π(2b1)→ns Rydberg series converging to the
first ionization energy limit are listed in Table I. The aver-age quantum defect over the n=3 to 8 range is equal to
¯
δ= 0.96±0.01. By quantum chemical calculation at the TDDFT level, the lowest π→R’s’(21B
1) vertical transition energy is equal
to 6.35 eV (seeTable III), in good agreement with the present experimental value at 6.398 eV.
Mahncke and Noyes10 identified a Rydberg series
con-verging to 78103 cm-1(9.683 eV) with δ=0.01 but the first
mem-ber of the series was missing, hidden in the 1850 Å (6.70 eV or 54 054 cm-1) continuum. So did Walsh11 who determined
the convergence limit at 77937 cm-1 (9.663 eV) with δ=0.05:
the first member also failed. Walsh and Warsop12reported a
Rydberg series starting at 65182 cm-1(8.082 eV) converging to
77850 cm-1(9.652 eV) with δ=0.93.
Transitions from the π(2b1) to np Rydberg orbitals lead
to two well-identified series (Table I), as was also observed in previous studies on 1,1-C2H2Cl2,161,1-C2H2F2,411,1-C2H2FCl,42
and CH3X (X=Cl, Br and I).39 The two series are observed
up to n=8. We assign the series starting at 7.414 eV to the π(2b1)→npσ transitions whereas the series starting at
7.740 eV is assigned to π(2b1)→npπ. These assignments are
based on the good agreement with the theoretical predictions of the present work listed inTable III: π→Rpσ (81B
1) and π→Rpπ
(111A
1) transitions were calculated at 7.44 eV and 7.90 eV
suc-cessively. Both transitions have noticeable oscillator strength. The splitting of 0.326 eV between the two 3pλ -type states is very close to the value of 0.356 eV observed in 1,1-C2H2Cl2.16
In 1,1-C2H2F2, however, the splitting is substantially smaller
(0.183 eV),41while it is again of the same order of magnitude
in 1,1-C2H2FCl (0.404 eV).38,42
Average quantum defects ¯δ=0.53±0.01 and 0.34±0.02 are determined for the npσ- and the npπ-type Rydberg series respectively. The small dispersion of the quantum defects
along the series is compatible with our assumed neglect of the Rydberg-Rydberg couplings. The difference between the quantum defects for the npσ- and the npπ series can be inter-preted as follows. The presence of more σ orbitals than π orbitals in the ionic core leads to a stronger core-Rydberg interaction for σ-type Rydberg orbitals, so that a larger quan-tum defect should be observed for npσ compared to npπ Rydberg orbitals. In the C2v point group, the npσ and npπ
orbitals should rigorously be denoted by npa2and npb1.
How-ever, assuming the molecular ion field to be nearly cylin-drical (diatomic-like), the σ, π, . . . nomenclature is usually used.
A first π(2b1)→ndλ series starts at 8.089 eV and its
members are characterized by an average quantum defect ¯
δ=0.08±0.03. The second series starting at 8.170 eV is char-acterized by an average quantum defect ¯δ= 0.002±0.008. These ¯δ values suggest ndσ and ndπ Rydberg states respec-tively. In the vacuum UV spectrum of 1,1-C2H2F241 and of
1,1-C2H2FCl,38,42a ndσ series is observed with ¯δ=0.13±0.0341
and 0.125±0.02541 respectively. For the corresponding ndπ
series ¯δ=0.04±0.0340 and ¯δ=-0.11±0.0241 were respectively
determined. Surprisingly, the splitting between 3dσ and 3dπ is found to be equal to 0.081 eV in cis-1,2-C2H2Cl2, although
it is much greater, 0.214 eV, in 1,1-C2H2FCl42 and 0.109 eV in
1,1-C2H2F2.41
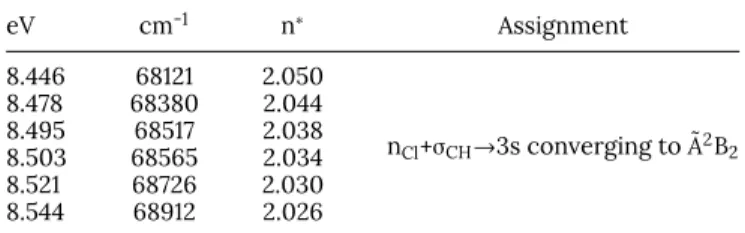
Finally, a fairly strong broad and complex structured band is observed at about 8.5 eV, as already mentioned in SectionV A, where the broad signal is interpreted as resulting from a valence-valence npz,Cl+πCCl→π∗ transition. Superimposed fine
structure is observed, however, whose energy positions are listed inTable VI. In the densitometer trace of the PAS pub-lished by Walsh and Warsop12 a strong broad and roughly
structured band is observed at 68 310 cm-1(8.469 eV) showing
several shoulders between 67 294 cm-1(8.343 eV) and 68697
cm-1 (8.517 eV) but these structures were not discussed or
assigned by the authors. The structures reported inTable VI, with an adiabatic excitation energy of 8.446 eV, do not fit into the possible Rydberg series converging to the ground ionic state and which have been detailed above. Based on our quantum chemical TDDFT computations (Table III), which predict the vertical (4b2:nCl+σCH)→3s transition at 8.24 eV, we
rather suggest to assign the structures starting at 8.446 eV to transitions to the vibrational levels of the lowest Rydberg state (3s) converging to the ˜A2B
2 ionic state, whose vertical
TABLE VI. Energy positions (eV), wavenumbers (cm-1) and effective quantum num-bers associated with the structures in the strong broad band observed at 8.5 eV in the vacuum UV-PAS of cis-1,2-C2H2Cl2. Conversion factor: 1 eV= 8065.545 cm-1.24
eV cm-1 n∗ Assignment 8.446 68121 2.050 nCl+σCH→3s converging to ˜A2B2 8.478 68380 2.044 8.495 68517 2.038 8.503 68565 2.034 8.521 68726 2.030 8.544 68912 2.026
ionization energy is equal to 11.690 eV.23 Based on the
information from the photoelectron spectrum,23 we infer
n∗=2.05±0.01 or ¯δ=0.95±0.01, which is perfectly compatible
with a 3s Rydberg state.
2. Vibrational analysis (Fig. 3,Fig. 5andFig. 6(a–c))
After having identified the vibrationless Rydberg tran-sitions, the vibrational structure of the identified electronic states has to be disentangled. To this purpose we will rely on the assumption stated above, i.e. the vibrational struc-ture of the Rydberg states should be close to that of the cationic states to which they converge.39 This
informa-tion will be inferred from the HeI-PES.23 A comparison
between the PAS and the HeI-PES of the ground state of the cation is illustrated in Fig. 5, Figs. 6a and 6b. Most of the Rydberg states observed between 6.4 eV and 9.9 eV converge to IEad( ˜X2B1) = (9.666±0.006) eV of
cis-1,2-C2H2Cl2.23 The electronic ground state of the cation mainly
shows three vibrational modes:23,32ω
2+=1460±30 cm-1 (181±4
meV), ω3+=1160±20 cm-1 (144±3 meV) and ω4+=860±60 cm-1
(107±8 meV). These values correspond to the C=C stretch-ing, C-H in-plane bending and C-Cl stretching vibrations respectively.
The first Rydberg transition 2b1(π)→R3s(21B1) with an
adi-abatic excitation energy of 6.398 eV (seeFig. 5) shows vibra-tional excitation at 6.568 eV (v=1), 6.752 eV (v=2) and 6.930 eV (v=3). The average wavenumber ¯ω= 1420±70 cm-1(176±9 meV)
corresponds to ν2 (C=C stretching) predicted at 1427 cm-1
(seeTable IV). Excitations corresponding to smaller wavenum-bers (short dashed vertical lines in Fig. 5) are likely hid-den in the signal corresponding to the 31B
2 valence excited
state.
The application of the same procedure is displayed in Fig. 6(a–c). Table S2(a-c) reports the transition energies and the proposed corresponding assignments.
The 7.4-8.1 eV photon energy range shows weak broad bands alternating with stronger sharp peaks. The broad weak features have already been assigned earlier in this work (see sectionV A). The sharper features are assigned to the 2b1→3pσ
and 2b1→3pπ Rydberg transitions with adiabatic excitation
energies at 7.414 eV and 7.740 eV respectively (see section V B 1andTable I). Both states show an extended vibrational structure as analyzed in Table S1a and illustrated in Fig. 6a. Energy positions in square brackets indicate that at least two different assignments are possible and that these should be considered with caution. Intensity fluctuations may result from the overlap of several contributions. At least two vibra-tional modes are excited in both states, i.e. ω=1420±20 cm-1
(176±2 meV) and ω0=795±15 cm-1(98±2 meV). In addition, two
weaker modes are detected with wavenumbers of 1220±20 cm-1(151±3 meV) and of 190±30 cm-1(24±4 meV).
Their assignment relies on the comparison with the ground state cation. The first two wavenumbers should cor-respond to ω2+(C=C stretch)= 1430±30 cm-1 and to ω4+(C-Cl
symmetric stretch)= 860±60 cm-1respectively.23,32The latter
value is significantly higher in the cation than in the Ryd-berg state. However, this result agrees with the quantum chemical calculations performed on the two systems23 and
in the present work: for the Rydberg excitation only the C=C stretching is significantly modified whereas the C-Cl stretch-ing remains only slightly affected in most of the excited neutral states (e.g. seeTable IV).
The wavenumber equal to 1220±20 cm-1can be correlated
with the value of 1160±20 cm-1inferred from the HeI-PES for
the ground state cation. This vibration corresponds to ν3(C-H
bending) predicted at 1215 cm-1by ab initio calculations.23The
wavenumber of 190±30 cm-1is not detected in the HeI-PES. An
assignment to ν5(C-Cl bending) is proposed based on
quan-tum chemical predictions (193 cm-1).23However, as mentioned
in Table S2a, ω3is close to ω4+2ω5which introduce ambiguities
in the assignments.
Table S2a also compares the present results to those reported by Walsh and Warsop12(see Table S2a, col. 6). These
authors proposed a classification of the bands and determined two wavenumbers, i.e. of about 1400 cm-1and 800 cm-1. The
comparison of Table VIIa with Table I in Ref.12shows a very good agreement and the present work brings a strong argu-ment supporting the assignargu-ments. These authors also men-tioned a wave number of 1224 cm-1 but rejected it because
“. . .no frequency of this magnitude is observed in any other electronic transition of cis-dichloro ethylene or in the transi-tions of the other chloroethylenes”. As mentioned above, this wavenumber is very probably involved in both the two 3pσ and 3pπ Rydberg states and very likely in combinations in the 3pσ Rydberg state.
Fig. 6b shows the PAS in the 8.0-9.1 eV range on an expanded energy scale. This part of the spectrum is much more crowded and the energy positions of the features are listed in Table S2b. The procedure described earlier in this section (HeI-PES inserted inFig. 6b) leads to the assignments presented in the same table.
At least seven Rydberg transitions are observed. Six of them converge to the ground state of the cation and corre-spond to 2b1→3dσ, 3dπ, 4s, 4dσ, 4dπ and 5s successively. The
strong broad peak around 8.5 eV has already been interpreted as a superposition of a valence-valence (npz,Cl+πCCl→π∗) and a
valence-Rydberg (4b2→3s) transition. (see sectionV B 1).
For the six Rydberg states, the vibrational analysis leads to four vibrational wavenumbers: ω2=1426±9 cm-1(177±1 meV),
ω3=1180±20 cm-1(146±2 meV), ω
4=806±7 cm-1(100±1 meV) and
ω5=191±8 cm-1 (24±1 meV). These values are close to those
already mentioned for the 3pσ and 3pπ states. We notice that ω3is slightly lower and closer to the value ω3+=1160±20 cm-1
of the cation ground state.23
In Table S2b the assignments proposed in the present work are compared to the classifications attempted by Walsh and Warsop.12 These authors proposed two possible
inter-pretations of the bands observed between 65000-69000 cm-1, assigned either to 2b
transitions. Three wavenumbers arose from their analysis at 1424 cm-1, 813 cm-1and 197 cm-1. These three values are in good
agreement with the present results. However, they did not detect the wavenumber at 1177 cm-1observed in the present
work.
Fig. 6c shows the 9.0-10.0 eV energy range on an expanded scale. A large number of weak to very weak struc-tures as well as broad intense peaks at about 9.6 eV and 9.8 eV are observed. The ∆-plot shown in the lower panel of Fig. 6cenhances these structures. Their energy positions and the proposed assignments in terms of transitions to vibra-tionally excited Rydberg states converging to the ionic ground state are listed in Table S2c. The majority of the observed transitions are interpreted as leading to ndσ (n=5-8) Rydberg states. As expected, the same vibrational normal modes are involved as for the previous series. The average wavenumbers are ω2=1411±8 cm-1(175±1 meV), ω3=1170±20 cm-1(145±3 meV),
ω4=807±20 cm-1(100±2 meV) and ω
5=190±20 cm-1(24±2 meV).
The present energy range being almost outside the prospected region of previous photoabsorption works,10–12 no
compar-ison can be made. Only Mahncke and Noyes10 mentioned a
few discrete bands which have been introduced in Table S2c. Most of them fit the present data and possible assignments are proposed.
We could not observe any significant breakdown of the Rydberg formula or of the assumption of similar vibra-tional structures for the Rydberg states and the correspond-ing cationic state. This suggests that Rydberg-Rydberg or Rydberg-continuum interactions are too small to affect the energy positions at the resolution and accuracy reached in our spectra.
Beside the long sequence of weak structures, the present region also shows a strong complex structured doublet peak spread between 9.6 eV and 9.9 eV (seeFig. 1andFig. 6c, upper panel). The steep absorbance increase is likely linked to the opening of the 2b1-1ionization continuum at 9.666 eV. Rydberg
states converging to higher lying ionization limits need to be considered. As shown inFig. 1, three ionization continua are open between 11.5 eV and 12.2 eV, i.e. 4b2-1at 11.426 eV, 5a1-1at
11.965 eV and 1a2-1at 12.375 eV.23,32–34
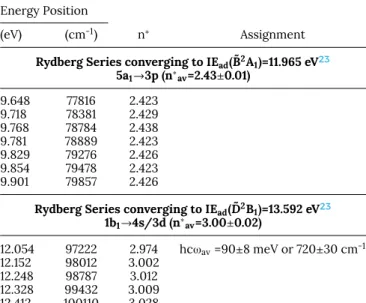
Based on the vibrational structure of the ˜B2A
1
photoelec-tron band,23the unassigned features observed in the 9.6-9.9
eV range could be interpreted (seeTable VIIand upper panel of Fig. 6c). The effective quantum number n∗=2.426±0.005,
averaged over eight vibronic transitions, suggests an assign-ment to a 5a1→3p Rydberg transition.
3. Rydberg transitions between 10 eV and 20.0 eV (seeFigs. 1,2,(6)d)
The PAS of cis-1,2-C2H2Cl2between 10 eV and 13 eV has
been recorded with 2 meV increments and is reproduced in Fig. 6d. The absorbance steadily increases over the whole range. It shows a sequence of weak broad bands. Several of these features are clearly consisting of very weak sub-structures. They become more apparent in the ∆-plot (lower
TABLE VII. Analysis of the high energy bands observed in the vacuum UV photoab- sorption spectrum of cis-1,2-C2H2Cl2. Energy positions (eV), corresponding
wavenumbers (cm-1), effective quantum numbers (n∗) and assignments as proposed in this work. Conversion factor: 1 eV= 8065.545 eV.24
Energy Position
(eV) (cm-1) n∗ Assignment Rydberg Series converging to IEad( ˜B2A1)=11.965 eV23
5a1→3p (n∗av=2.43±0.01) 9.648 77816 2.423 9.718 78381 2.429 9.768 78784 2.438 9.781 78889 2.423 9.829 79276 2.426 9.854 79478 2.423 9.901 79857 2.426
Rydberg Series converging to IEad( ˜D2B1)=13.592 eV23 1b1→4s/3d (n∗av=3.00±0.02) 12.054 97222 2.974 hcωav=90±8 meV or 720±30 cm-1 12.152 98012 3.002 12.248 98787 3.012 12.328 99432 3.009 12.412 100110 3.028
panel inFig. 6d) and show intervals of the order of 30 meV (240 cm-1). To try to disentangle this range of the PAS it
would be reasonable to use the same hypotheses and assump-tions applied earlier. Using the present data, term values and effective quantum numbers could be derived.
In this energy range three vertical ionization limits, lying close together, are involved, i.e. 11.690 eV (4b2-1), 12.028 eV
(5a1-1), and 12.460 eV (1a2-1)23,32–34 successively. They are
inserted in Fig. 6d (upper panel). The sum of the associ-ated continua contributes to the strong increase of the back-ground observed in the PAS in this energy range. All three cationic states are characterized by an extended vibrational progression.23
If we assume that the maxima at 10.252 eV, 10.584 eV and 10.792 eV (Table II) correspond to transitions to Rydberg states converging to the 4b2-1continuum at 11.69 eV, effective
quan-tum numbers of 3.08, 3.51 and 3.89 are respectively obtained. This is compatible with 4b2 → 4s, 4p and 4d assignments
(Figure 6d).
The next four well identified bands lye at 10.880 eV, 11.120 eV, 11.275 eV and 11.536 eV (Table II). Based on their effective quantum numbers n∗=3.44, 3.87, 4.25 and 5.25, they
may be assigned to 5a1→4p, 4d (or 5s), 5p and 6p transitions,
respectively. The last two bands at 11.342 eV and 11.75 eV will be assigned to 1a2→4p and 5p transitions for which effective
quantum numbers n∗=3.49 and 4.38 are obtained. The sub-structures detected in these bands could likely be assigned to vibrational excitations, e.g. of C-Cl bending for which a wave number of the order of 180 to 270 cm-1has been predicted for
several Rydberg and valence states (seeTable IV) and cationic states as well.23
The width of all these bands has likely to be related to the short lifetimes of these Rydberg states. In a forth-coming paper23 it will be shown that these Rydberg
states mainly undergo resonant autoionization to the ionic ground state of cis-1,2-C2H2Cl2+( ˜χ2B1) giving rise to threshold
photoelectrons.
A broad band spreads from 12.054 eV to 12.412 eV and consists of five narrower well resolved regularly spaced fea-tures with a regular intensity distribution. Assuming the ˜D2B
1
state of the cation at 13.592 eV as convergence limit23 (see
Table VII) an average effective quantum number n∗=3.00±0.02
is obtained. Therefore, this band is tentatively ascribed to a 1b1→4s/3d Rydberg transition. The vibrational analysis
leads to an averaged wavenumber ¯ω= 722±30 cm-1 which
could likely be assigned to ν4 (C-Cl stretch/C-H bending)
as predicted for other lower lying neutral excited states (seeTable IV).
The energy range between 13 eV and 20 eV has been recorded with the 1.5m-NIM monochromator and with 15 meV energy increments. This high energy range only shows a few very broad bands superimposed on a slower increasing con-tinuum as shown in Fig. 2a. The band maxima are listed in Table II. In the same energy range five ionic excited states are observed in the HeI PES, i.e. at 13.592 (1b1-1), 14.083 eV
(3b2-1), 15.531 eV (4a1-1), 16.638 eV (3a1-1) and at 18.84 eV (2b2-1)
successively.23,32–34
In Fig. 2bthe ∆-plot has been reproduced and slightly smoothed by FFT to increase the signal/noise ratio. At least six broad bands are characterized by a full width half-maximum (FWHM) ranging from 0.4 eV to 0.7 eV. A last very broad band extends from 16.8 eV to 19.5 eV. The energy posi-tion of the successive maxima is listed in Table II. A tenta-tive classification based on the vertical ionization energies and the inferred effective quantum numbers is also provided inTable II.
VI. CONCLUSIONS
The measurement of the VUV photoabsorption spectrum of cis-1,2-C2H2Cl2at higher resolution by using synchrotron
radiation enabled us to extend the data above the 10.5 eV pho-ton energy limit and, for the first time, up to 20 eV. In this energy range the absorbance drastically increases and numer-ous bands are identified. Interpretations and assignments have been proposed.
Quantum chemical calculations allowed us to describe and assign valence-valence (2b1(π)→σ∗/π∗) as well as
valence-Rydberg (2b1(π)→3s) transitions which are involved at the low
energy end of the spectrum, i.e. between 5 eV and 7.4 eV. Below 6.0 eV the 11B
1 state has a strongly mixed valence
(nCl+σ∗CH)/Rydberg (Rpσ) character. Above 6.0 eV the π→π∗
(31B
2) valence and the π→3s (21B1) Rydberg transitions are
entangled. For the vibrational structure of both states an assignment is proposed. Above 7.0 eV several valence transi-tions are predicted by the calculatransi-tions and compared to the observations.
In the intermediate photon energy range, i.e. between 6.4 eV and 10.0 eV, a large number of narrow vibronic Ryd-berg transitions, i.e., 2b1→ns (n=3-8), two types of np (up to
n=8) and two nd-type (up to n=9) series, have been identi-fied and interpreted. The involved Rydberg states converge to the cis-1,2-C2H2Cl2+( ˜X2B1) ground ionic state. By reference
to the first band of the cis-1,2-C2H2Cl2HeI-PES,23 the
vibra-tional structure has been assigned to four vibravibra-tional modes, including harmonics and combinations: ω2≈1420 cm-1 (C=C
stretching), ω3 ≈ 1190 cm -1 (C-H symmetric bending), ω4
≈ 800 cm -1 (C-Cl symmetric stretching) and ω
5≈ 190 cm-1
(C-Cl symmetric bending). These assignments are compared to those proposed on a more empirical basis in previous reports.11,12
At 8.5 eV, 9.6 eV and above 10.0 eV numerous Ryd-berg transitions are observed, all assigned to members of series converging to the successive excited states of cis-1,2-C2H2Cl2+. For a few of them vibrational progressions are
observed.
SUPPLEMENTARY MATERIAL
Seesupplementary materialfor the optimized geometry parameters of neutral ground and excited states of cis-1,2-C2H2Cl2 (Table S1) and the list of the vacuum UV spectral
features measured between 7.41 eV and 9.94 eV (Table S2).
ACKNOWLEDGMENTS
Financial supports by the European Commission, the Uni-versity of Li `ege and the Belgian program on InteruniUni-versity Attraction Poles of the Belgian Science Policy (IAP no. P6/19) are gratefully acknowledged.
REFERENCES
1L. J. Carpenter and S. Reimann (Coordinating Lead Authors),
Ozone-Depleting Substances (ODSs) and other Gases in the Montreal Protocol, Chapter 1, pp 1.50 in Scientific Assessment of Ozone Depletion: 2014, Global Ozone Research and Monitoring Project–Report No. 55, World Meteorolog-ical Organization, Geneva, Switzerland.
2K. Kirchner, D. Helf, P. Ott, and S. Vogt,Ber. Bunsen-Ges. Phys. Chem.94,
77 (1990).
3S. Ramamoorthy, Chlorinated Organic Compounds in the Environment.
Reg-ulatory and Monitoring Assesment(Lewis Publishers, Boca Raton, Fl (USA), 1998).
4M. J. Berry,J. Chem. Phys.61, 3114 (1974).
5M. Umemoto, K. Seki, H. Shinohara, U. Nagashima, N. Nishi, M. Kinoshita,
and R. Shimada,J. Chem. Phys.83, 1657 (1985).
6M. Chandra, D. Senapati, M. Tak, and P. K. Das,Chem. Phys. Letters430, 32
(2006).
7T. Yamada, A. El-Sinawi, M. Siraj, P. H. Taylor, J. Peng, X. Hu, and
P. Marshall,J. Phys. Chem A105, 7588 (2001).
8C. E. Canosa-Mas, T. J. Dillon, H. Sidebottom, K. C. Thompson, and
R. P. Wayne,Phys. Chem. Chem. Phys3, 542 (2001).
9V. A. Mikhailov, M. A. Parkes, R. P. Tuckett, and C. A. Mayhew,J. Phys. Chem. A110, 5760 (2006).
10H. E. Mahncke and W. A. Noyes, Jr.,J. Chem. Phys.3, 536 (1935). 11A. D. Walsh,Trans. Faraday Soc.41, 35 (1945).
13C. F. Koerting, K. N. Walzl, and A. Kuppermann,Chem. Phys. Letters109,
140 (1984).
14S. Arulmozhiraja, M. Ehara, and H. Nakatsuji,J. Chem. Phys.129, 174506
(2008).
15O. G. Khvostenko,J. Electr. Spectr. Rel. Phenomena195, 220 (2014). 16R. Locht, D. Dehareng, and B. Leyh, J. Phys. Commun. 1, 045013
(2017).
17R. Locht, D. Dehareng, and B. Leyh, unpublished results.
18A. Hoxha, R. Locht, B. Leyh, D. Dehareng, H.-W. Jochims, and
H. Baumg¨artel,Chem. Phys.256, 239 (2000).
19R. Locht, B. Leyh, A. Hoxha, D. Dehareng, H.-W. Jochims, and
H. Baumgˆartel,Chem. Phys.257, 283 (2000).
20R. Locht, D. Dehareng, and B. Leyh,J. Phys. B At. Mol. Opt. Phys.47, 085101
(2014).
21P. Marmet,Rev. Sci. Instrum.50, 79 (1979); R. Carbonneau, E. Bolduc, and
P. Marmet,Can. J. Phys.51, 505 (1973).
22R. Carbonneau and P. Marmet, Can. J. Phys. 51, 2203 (1973);Phys. Rev. A9,
1898 (1974).
23R. Locht, D. Dehareng, and B. Leyh, unpublished results.
24P. J. Mohr, B. N. Taylor, and D. B. Newell,J. Phys. Chem. Ref. Data45,
043102 (2016); P. J. Mohr, D. B. Newell, and N. B. Taylor,Rev. Mod. Phys.88, 035009 (2016).
25M. J. Frisch, G. W. Trucks, H. B. Schlegel, G. E. Scuseria, M. A. Robb,
J. R. Cheeseman, G. Scalmani, V. Barone, B. Mennucci, G. A. Petersson, H. Nakatsuji, M. Caricato, X. Li, H. P. Hratchian, A. F. Izmaylov, J. Bloino, G. Zheng, J. L. Sonnenberg, M. Hada, M. Ehara, K. Toyota, R. Fukuda, J. Hasegawa, M. Ishida, T. Nakajima, Y. Honda, O. Kitao, H. Nakai, T. Vreven, J. A. Montgomery, Jr., J. E. Peralta, F. Ogliaro, M. Bearpark, J. J. Heyd, E. Brothers, K. N. Kudin, V. N. Staroverov, R. Kobayashi, J. Normand, K. Raghavachari, A. Rendell, J. C. Burant, S. S. Iyengar, J. Tomasi, M. Cossi, N. Rega, J. M. Millam, M. Klene, J. E. Knox, J. B. Cross, V. Bakken, C. Adamo, J. Jaramillo, R. Gomperts, R. E. Stratmann, O. Yazyev, A. J. Austin, R. Cammi,
C. Pomelli, J. W. Ochterski, R. L. Martin, K. Morokuma, V. G. Zakrzewski, G. A. Voth, P. Salvador, J. J. Dannenberg, S. Dapprich, A. D. Daniels, O. Farkas, J. B. Foresman, J. V. Ortiz, J. Cioslowski, and D. J. Fox, Gaussian 09, Revision
A.02(Gaussian Inc., Wallingford CT, 2009).
26T. H. Dunning, Jr.,J. Chem. Phys.90, 1007 (1989). 27J. Cizek, Adv. Chem. Phys. 14, 35 (1969).
28G. E. Scuzeria and H. F. Schaefer III,J. Chem. Phys.90, 3700 (1989). 29Y. Zhao and D. G. Truhlar,Theor. Chem. Acc.120, 215 (2008).
30C. Van Caillie and R. D. Amos, Chem. Phys. Letters. 317, 159
(2000).
31T. Shimanoushi, Tables of Molecular Vibrational Frequencies. Consolidated
Volume I, NSRDS-NBS 39, 1972, U.S.Gov.Print.Off., Washington DC 20402.
32R. F. Lake and H. Thompson, Proc. Roy. Soc. London A 315, 323 (1970). 33K. Wittel and H. Bock,Chem. Ber.107, 317 (1974).
34W. Von Niessen, L.Åsbrink, and G. Bieri,J. Electr. Spectry. Rel. Phenom. 26, 173 (1982).
35K.-C. Lau, H. K. Woo, P. Wang, X. Xing, and C. Y. Ng,J. Chem. Phys.124,
224311 (2006).
36M. A. Parkes, S. Ali, C. R. Howle, R. P. Tuckett, and A. E. R. Malins,Mol. Phys.105, 907 (2007).
37R. Locht, B. Leyh, K. Hottmann, and H. Baumg¨artel,Chem. Phys.220, 207
(1997).
38G. Tornow, R. Locht, R. Kaufel, H. Baumg¨artel, and H.-W. Jochims,Chem. Phys.146, 115 (1990).
39R. Locht, B. Leyh, A. Hoxha, H.-W. Jochims, and H. Baumg¨artel, Chem.
Phys. 272, 259 (2001); R. Locht, B. Leyh, H.-W. Jochims, and H. Baumg¨artel, ibid.317, 73 (2005); 365,109(2009).
40R. Locht, B. Leyh, D. Dehareng, H.-W. Jochims, and H. Baumg¨artel,Chem. Phys.362, 97 (2009).
41R. Locht, H. W. Jochims, and B. Leyh,Chem. Phys.405, 124 (2012). 42R. Locht, D. Dehareng, and B. Leyh,Mol. Phys.112, 1520 (2014).