Full Terms & Conditions of access and use can be found at
http://www.tandfonline.com/action/journalInformation?journalCode=rajs20
Download by: [University of Liege] Date: 06 November 2017, At: 00:10
African Journal of Science, Technology, Innovation and
Development
ISSN: 2042-1338 (Print) 2042-1346 (Online) Journal homepage: http://www.tandfonline.com/loi/rajs20
Upgrading opportunities in agricultural value
chains: Lessons from the analysis of the
consumption of processed pineapple products in
southern Benin
Augustin K. N. Aoudji, Carolle Avocevou-Ayisso, Anselme Adégbidi, Cassien
Gbénou & Philippe Lebailly
To cite this article: Augustin K. N. Aoudji, Carolle Avocevou-Ayisso, Anselme Adégbidi, Cassien Gbénou & Philippe Lebailly (2017): Upgrading opportunities in agricultural value chains: Lessons from the analysis of the consumption of processed pineapple products in southern Benin, African Journal of Science, Technology, Innovation and Development, DOI: 10.1080/20421338.2016.1163472
To link to this article: http://dx.doi.org/10.1080/20421338.2016.1163472
Published online: 27 Oct 2017.
Submit your article to this journal
Article views: 7
View related articles
Upgrading opportunities in agricultural value chains: Lessons from the analysis of the
consumption of processed pineapple products in southern Benin
Augustin K. N. Aoudji1*, Carolle Avocevou-Ayisso2, Anselme Adégbidi1, Cassien Gbénou3and Philippe Lebailly4
1Département d’Economie, de Socio-Anthropologie et de Communication pour le développement rural, Faculté des Sciences Agronomiques, Université d’Abomey-Calavi, Cotonou, Bénin
2
Département d’Economie, de Sociologie Rurales, Ecole Nationale Supérieure des Sciences et Techniques Agronomiques de Kétou, Université d’Agriculture de Kétou, Kétou, Bénin
3
UFR des Sciences Agronomiques, Université Africaine de Technologie et de Management, Cotonou, Bénin 4Unité d’Economie et Développement rural, Université de Liège – Gembloux Agro-Bio Tech, Gembloux, Belgique *Corresponding author email: [email protected]; [email protected]
This study analyzed the consumption of processed pineapple products in southern Benin. The low processing of agricultural products does not enable sub-Saharan Africa to exploit the potential of agriculture for development. The objective of this paper was to identify upgrading opportunities in Benin’s pineapple value chain. A survey was carried out from December 2012 to February 2013 among 250 respondents randomly selected infive cities in southern Benin; and data were collected based on structured interviews. Dried pineapple, jam, syrup, juice, and cocktail were the processed pineapple products available on the market. Beverages, especially the juice, were the main processed pineapple products. The motivations driving the purchase of processed pineapple beverages by consumers were: competitive price and interest in local, natural and therapeutic beverages. The results indicate there is a margin for the value chain to upgrade products and services, and increase the price of pineapple-based products while staying competitive. A strong marketing and advertisement campaign is essential to support wider knowledge of processed pineapple products by consumers. Product traceability is a prerequisite for export in regional and international markets. This makes the certification of the value chain a critical issue. A joint action of value chain stakeholders is needed to exploit these opportunities.
Keywords: consumers, marketing, pineapple, processed products, upgrading, value chain
Introduction
Market-oriented agriculture has become a key develop-ment and poverty reduction strategy in developing countries (Dorward et al.2004; Jama and Pizarro2008). This has resulted in paying increasing attention to value chain development for agricultural commodities in recent decades (Stoian et al. 2012). The value chain refers to the full range of activities required to bring a product from conception, through the different phases of production (involving a combination of physical trans-formation and the input of various producer services), delivery to end consumers, and final disposal after use (Kaplinsky and Morris2002).
The domestic value chains of agricultural products in sub-Saharan Africa are often characterized by the pro-vision of raw material, i.e. the low processing of the end-products (Aoudji et al.2012; Bates 1981). This is a bottleneck to development since the countries do not take full advantage of the potential of agricultural product value chains (e.g. increased value added, job opportunities and improved livelihoods). Where proces-sing exists, sub-Saharan Africa’s agro-industries are often characterized by poor competitiveness (Bates
1981). As a consequence, they tend to maintain the price of agricultural commodities at a low level (Bates 1981), with a negative effect on farmers’ income. Against this background, support for the local processing of agricul-tural products becomes a key policy matter in sub-Saharan Africa.
Upgrading– i.e. the capacity for a value chain to inno-vate for increased value added of its products and processes (Humphrey and Schmitz2002)– offers opportunities for
improving the competitiveness in a value chain. Four types of upgrading are often differentiated in value chains: (i) process upgrading (increased efficiency in trans-forming inputs into outputs), (ii) product upgrading (changes in product lines to achieve higher unit values), (iii) functional upgrading (acquiring new, superior and more remunerative functions in the chain), and (iv) inter-sectoral upgrading (mobilizing the competence acquired in a particular function to shift into a new sector) (Giuliani, Pietrobelli, and Rabellotti 2005; Humphrey and Schmitz
2000).
Increased processing is an upgrading vision in agricul-tural value chains in sub-Saharan Africa. All value chain agents can take advantage of this upgrading through the systemic competitiveness of the chain (Kaplinsky and Morris2002). This paper analyzes the specific case of pro-cessed pineapple products in southern Benin.
Pineapple is quantitatively one of the leading agricul-tural products in Benin and in other West African countries (Danielou and Ravry 2005; Fold and Gough2008; Vag-neron, Faure, and Loeillet 2009). Many initiatives are being implemented to support Benin’s pineapple value chain. These include government initiatives as well as inter-national donors’support; and a huge emphasis is put on pro-cessing. So far, only 2% of Benin’s annual production of pineapple is processed (ABePEC 2010). However, the ability of the value chain to strengthen the processing sector will depend on how successfully it will comply with the nature of the demand. It has been highlighted that consumer preference is a key driver of changes in value chains (Fold and Gough2008); hence the importance for decision-makers to know the characteristics of the
https://doi.org/10.1080/20421338.2016.1163472
© 2017 African Journal of Science, Technology, Innovation and Development
African Journal of Science, Technology, Innovation and Development is co-published by Taylor & Francis and NISC (Pty) Ltd
targeted demand (van den Heuvel et al.2007). The objec-tive of this study was to identify upgrading opportunities in the pineapple value chain in southern Benin, based on an assessment of the local market. The focus on the dom-estic market stems from the fact that this could play a criti-cal role in the viability of Benin’s agro-industries before the consolidation of export outlets (both regional and inter-national markets).
This paper built on an integrated framework combin-ing the consumption patterns and the expectancy-discon-firmation paradigm. Consumption patterns refer to various components including consumers’ socio-demo-graphic profile (Kilchling, Hansmann, and Seeland2009; Ngapo, Martin, and Dransfield 2004), their behaviour (Santosa and Guinard2011; Verbeke and Vackier 2004), and their motivations (Cameron and Galloway 2005; Close and Kukar-Kinney 2010; Ragaert et al. 2004). These are useful to understand the overall condition in which the consumption of a good or service occurs. The interest of the expectancy-disconfirmation framework lies in the identification of areas where efforts are needed for increased customer satisfaction. In the model, expectations are understood as the attributes consumers are seeking while purchasing the product (Gupta and Stewart 1996; Taylor 1997), whereas perception derives from the consumer evaluation of the product (Kelley and Turley 2001; Ragaert et al. 2004). The attributes on which perceived performance falls short of expectations are dissatisfying (Oliver 1980; Taylor 1997) and corre-spond to areas where efforts are needed from value chain stakeholders (Aoudji et al. 2011). It was hypoth-esized that a viable upgrading strategy will require a joint effort of all value chain agents.
The practical value of this study is to generate market information that is useful in supporting the upgrading of Benin’s pineapple value chain, with a focus on processed products for improved value addition. Although the setting of this study is southern Benin, the subject treated is of interest to enlighten policymakers in most sub-Saharan African countries, regarding the issue of the poor proces-sing of agricultural products.
The next section elaborates on the research methods. Research findings are presented in section following that, and are further discussed in the penultimate section. In the last section, the main findings are summarized with related policy implications.
Methods Data collection
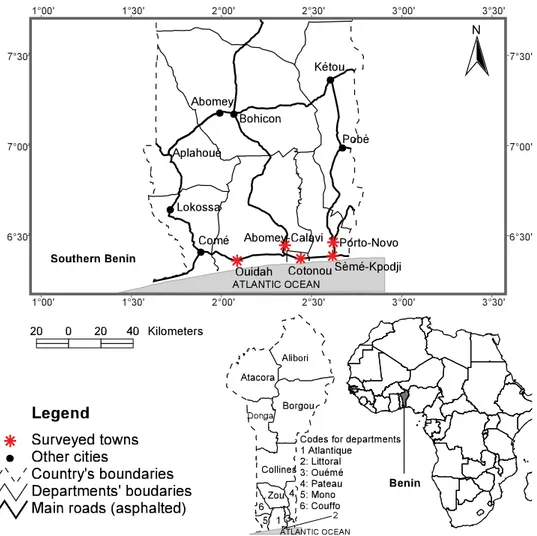
Afield work was carried out from December 2012 to Feb-ruary 2013 in the main cities of southern Benin, namely Cotonou, Abomey-Calavi, Sèmé-Podji, Porto-Novo and Ouidah (Figure 1). This encompassed two stages: the inventory of processed pineapple products available on the market and a consumer survey.
Processed pineapple products were inventoried by interviewing processing companies, traders, shops, and other distribution agents. Data were obtained through semi-structured interviews with managers.
The consumer survey was targeted at 250 household heads randomly selected. Data were collected based on
face-to-face interviews with standardized questionnaires. Besides their socio-demographic characteristics, respon-dents were to inform about their knowledge of various pineapple-based products inventoried during the previous stage, their interest in consuming these products, and whether or not they were currently buying these products. The other items on the questionnaire included their behav-iour patterns, their expectations and perceptions. These were focused on pineapple-based beverages because the consumption of other processed products was marginal.
The behaviour patterns were captured based on the purchasing motivations, the places and circumstances of consumption, frequencies and expenditures. Regarding expectations, respondents were to assess how important various attributes were to them when buying pineapple-based beverages. This was done by using a seven-point Likert scale ranging from one (not at all important) to seven (very important) (Kelley and Turley2001; Ragaert et al. 2004). A Likert scale is used to assess the degree to which people agree or disagree with a statement (e.g. Aoudji et al.2011; Kelley and Turley2001). The attributes involved in this evaluation were selected jointly with con-sumers during an exploratory study conducted at the beginning of the survey to identify potential consumers, their motivations, and the attributes of their expectations. To evaluate the perceptions, the same attributes were used in the form of statements. Respondents were to indi-cate their level of agreement with the statements, using the seven-point Likert scale ranging from one (strongly dis-agree) to seven (strongly dis-agree) (Bryhni et al.2002).
Data processing and analysis
Data processing and analysis began with the compilation of the processed pineapple products inventoried, and the characterization of the sample based on key socio-demo-graphic variables (gender, age, marital status, household size, education level, professional background and monthly income). These were followed by the assessment of consumers’ knowledge of and their interest in processed pineapple products, their consumption patterns, and the identification of unsatisfied expectations.
Consumers’ knowledge of and interest in processed pineapple products
The percentage of respondents who knew each pineapple-based product was calculated. The percentage of people interested in buying each product was also calculated.
Consumption patterns of processed pineapple products The percentage of consumers was determined on a product basis. A consumer is a respondent who actually purchases a given product. Besides purchase motivations, the factors influencing consumption and consumer behaviour patterns were analyzed.
The motivations driving the consumption of pineap-ple-based beverages were classified in decreasing order, based on the average rankings. Kendall’s test of concor-dance (Lewis and Johnson 1971) was performed to assess the level of agreement among respondents for motivation ranking.
2 Aoudji, Avocevou-Ayisso, Adégbidi, Gbénou and Lebailly
The behaviour patterns were analyzed based on the place and circumstances of consumption, the frequencies, and expenditures.
Identification of unsatisfied consumers’ expectations First, attributes important to consumers were identified. An attribute is important when its average score equals at least the middle of the Likert scale used (Kelley and Turley 2001) which in this study equalled four. These important attributes were identified by performing Stu-dent’s t tests of conformity, four being the reference value. The level of satisfaction was checked for each key attribute by performing Student’s t tests on paired samples. According to the expectancy disconfirmation fra-mework (Oliver 1980; Taylor 1997), consumers are not satisfied for a given attribute if the mean score of percep-tion is consistently inferior to that of their expectapercep-tions. Results
Processed pineapple products
Dried pineapple, jam, syrup, juice and cocktail were the processed pineapple products recorded. Dried pineapple was mainly targeted for export. Two types of jam packages were found on the market: 200 g and 500 g; and the retail price ranged between US$1.2 and US$3.1Pineapple syrup was packaged in one-litre bottles costing US$3−4.
Juice was by far the main processed pineapple product commercialized in southern Benin. Besides domestic
production, imported juice was also distributed on the market. The domestic product originated from two sources: modern and traditional production units. The offering of modern units consisted of 100% pure juice, with no addition of water, colorant, sugar or conservators. Various types of packages were available on the market: glass bottles (33 cen-tilitre (cl) and 25 cl), plastic bottles, and cans (25 cl and 42 cl). The retail prices ranged between US$0.4 and US$1.
Traditional production and marketing of pineapple juice was handled by women. The product is kept in recycled plastic bottles or transparent polyethylene bags costing US$0.1−0.2.
Cocktails consist of a mixture of juices of pineapple and other fruits (e.g. lemon, orange, mango, etc.). Packages were the same as for pineapple juice; and the retail price ranged between US$0.5 and US$1.2.
Main characteristics of the sample
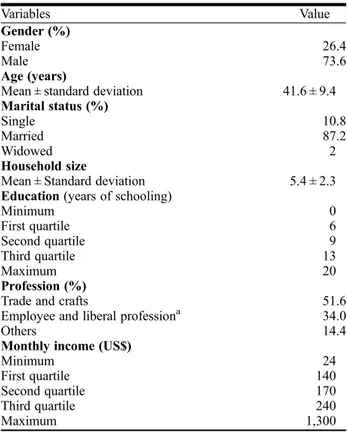
About three quarters of respondents were men (Table 1). The lower proportion of women stems from the fact that the questionnaire was targeted at household heads. Respon-dents’ ages ranged between 21 and 66 years, and averaged 41.6 years. The sample involved predominantly married people (Table 1). Household size ranged between one and 11, with aboutfive people on average (Table 1). Education level was diversified, from illiterate to university degree. About 75% of respondents had reached at least secondary school; and 25% of them had university degrees (Table 1).
Figure 1: Map of southern Benin.
Professional background was dominated by craftsmen and petty traders (about one half of respondents). These were followed by employees and liberal professionals whose pro-portion was about one third. The remainder of the sample encompassed other categories such as unemployed, stu-dents, drivers of motorbikes providing transportation service and retired people (Table 1). Respondents’ monthly income ranged between US$24 and US$1300, and averaged US$188.8. Fifty percent (50%) of people had an income lower than US$170 while 25% declared an income exceeding US$240 (Table 1).
Overview of the consumption of processed pineapple products
Processed pineapple products were known to consumers. Beverages (juice, cocktail and syrup) were more known
to consumers, compared to the other products (dried pine-apple and jam). Among beverages, the juice was the most popular product, known to all respondents. This was fol-lowed by the cocktail, which was unknown to only 4.4% of respondents (Figure 2). Lastly, the syrup was known to about two thirds of respondents (Figure 2). Regarding the two other products, about two fifths of respondents were aware of pineapple jam, while less than one tenth of them knew about dried pineapple (Figure 2).
Respondents’ interest, i.e. their willingness to consume, varied across pineapple-based products. They showed more interest in beverages (juice, cocktail and syrup) compared to the two other products. The proportion of people interested in dried pineapple and jam was about 3% and onefifth, respectively (Figure 2). Among pineap-ple-based beverages, the juice was the most popular product, with more than fourfifths of respondents inter-ested. This was followed by the cocktail (two thirds) and the syrup (one third of respondents) (Figure 2).
The consumption of processed pineapple products varied according to the type of product (Figure 3). No con-sumers were found during the survey who consumed dried pineapple. Pineapple juice had the highest proportion of consumers, with about three quarters of respondents buying it (Figure 3). Cocktail ranked second with about one half of respondents (Figure 3).
From this point onwards, the paper focuses on the con-sumption of pineapple-based beverages.
Consumption of pineapple-based beverages Motivations
Four key motivations underlay the consumption of pineap-ple-based beverages (Table 2). Competitive price seeking was the leading motivation, followed by the willingness to buy a local beverage, the desire for a natural beverage and the interest in a therapeutic beverage (Table 2).
Kendall’s test of concordance revealed poor agreement among consumers about motivation rankings. Despite the significance of the test (p < 0.001), the value of Kendall’s coefficient of concordance was very low (Table 3), showing divergence in ranking.
Behaviour patterns
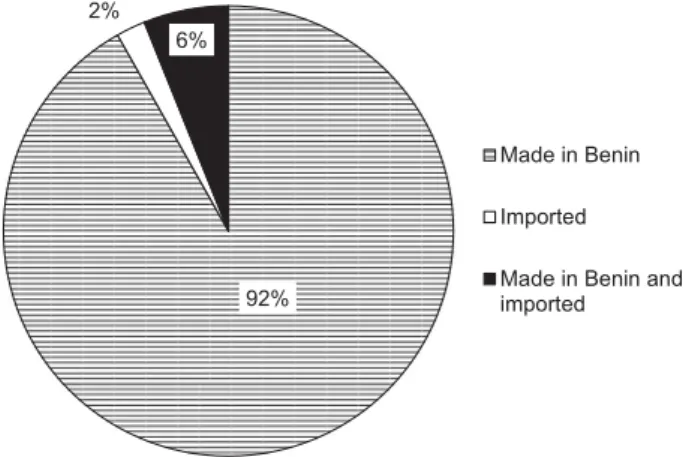
The market for pineapple-based beverages was dominated by the domestic production of Benin. More than nine tenths of respondents purchased locally produced bev-erages; only 2.1% of them bought imported beverages.
Table 1: Socio-demographic characteristics of respondents.
Variables Value
Gender (%)
Female 26.4
Male 73.6
Age (years)
Mean ± standard deviation 41.6 ± 9.4 Marital status (%)
Single 10.8
Married 87.2
Widowed 2
Household size
Mean ± Standard deviation 5.4 ± 2.3 Education (years of schooling)
Minimum 0 First quartile 6 Second quartile 9 Third quartile 13 Maximum 20 Profession (%)
Trade and crafts 51.6
Employee and liberal professiona 34.0
Others 14.4
Monthly income (US$)
Minimum 24
First quartile 140
Second quartile 170
Third quartile 240
Maximum 1,300
a’The liberal professions include lawyers, notaries, engineers, architects,
doctors, dentists and accountants, amongst others.’ (http://ec.europa.eu/ growth/smes/promoting-entrepreneurship/we-work-for/liberal-professions/index_en.htmaccessed 8 January 8 2016).
Figure 2: Knowledge and interest of consumers for processed
pineapple products. Figure 3: Consumption of processed pineapple products. 4 Aoudji, Avocevou-Ayisso, Adégbidi, Gbénou and Lebailly
The remainder was accustomed to both local and imported beverages (Figure 4).
The majority of consumers purchased pineapple-based beverages year-round (56.9% of respondents). The remainder (43.1%) occasionally bought pineapple-based beverages, for example during feast periods and for other particular occasions.
Respondents often consumed pineapple-based bev-erages alone (57% of cases) at home or in a bar (Figure 5). The consumption in family groups represented 43%, and occurred at home or in a bar. When place is con-sidered, in-house consumption widely predominated (77%), while in-bar consumption represented about one quarter (Figure 5).
The frequency of consumption of pineapple-based beverages is somewhat irregular. About 44% of respon-dents consumed them alone once or twice a month; 26.2% consumed these products with their family once or twice a month (Figure 6); 28.2% of respondents con-sumed pineapple beverage alone, at least three times per month; while 16.9% did it with their family at least three times per month (Figure 6).
The total expenditure on pineapple beverage consump-tion alone averaged US$0.76 per month. In this amount, expenditure on juice had the highest share (Table 4). Regarding in-family consumption, the total monthly expen-diture averaged US$1.29. Juice contributed to the largest share of this amount, followed by cocktail while syrup ranked last. The same trends were observed for the total expenditure on processed pineapple products (Table 4).
Consumers’ expectations
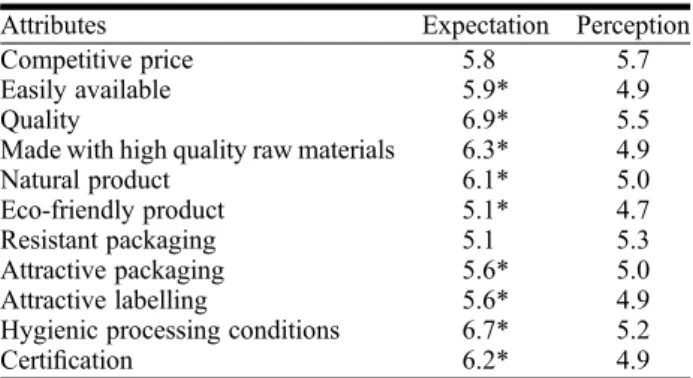
Eleven attributes were selected by consumers when buying processed pineapple beverages, i.e. competitive price, easily available, quality, use of high quality raw material, natural product (non-use of inorganic additive (sweetener and colorants)), eco-friendly product, resistant packaging, attractive packaging, attractive labelling, hygienic processing conditions and certification (Table 5). Student’s t tests of conformity showed that the average score was significantly higher than four (4), for all attributes (all p < 0.05); hence these were important to consumers.
The comparison between perception and expectations showed that consumers were satisfied with the attributes for ‘competitive price’ and ‘resistant packaging’, with the score of perception statistically similar or higher than that of expectations (Table 5). The attributes showing the highest gaps between expectations and perception were: easily available, quality, made with high quality raw materials, natural product and hygienic processing conditions.
Discussion
Processed pineapple products
Pure juice was by far the main product in Benin’s pineap-ple processing sector. Other promising products such as pineapple wine (Chanprasartsuk et al. 2010; Panjai, Ongthip, and Chomsri2009), canned pineapple, powdered pineapple juice (DAFF2011) and pineapple alcohol (Ban-Koffi and Han1990; Nigam1999) were unexploited while others such as jam were underexploited. This suggests a potential for outlet diversification, through the develop-ment of new processed products. Taking advantage of these opportunities will require adequate research support in the field of food technology. Proper market appraisal (both domestic and international markets) is also a prerequisite to successful introduction of new products.
Figure 5: Places and circumstances of consumption of pineap-ple-based beverages.
Table 2: Motivations of the consumers of processed pineapple beverages. Motivation Ranking Competitive price 1 Local beverage 2 Natural beverage 3 Therapeutic beverage 4
Figure 4: Sources of pineapple-based beverages purchased by consumers.
Table 3: Results of Kendall’s test of concordance on the ranking of motivations by consumers.
Parameters Value
N 195
Kendall’s coefficient of concordance (W) 0.069
Chi-square 40.206
df 3
Asymp. Sig. 0.000
Consumers’ knowledge of and interest in processed pineapple products
Consumers’ knowledge of and their willingness to buy depended on the product. Apart from the juice, processed pineapple products were poorly known to consumers. This highlights the shortage of effective marketing actions by value chain stakeholders, especially the processing com-panies. This shows the need for advertisements and mar-keting communication since these have the potential to influence consumers’ food choices and dietary behaviour (Pickett-Baker and Ozaki 2008; Smith and Foxcroft
2009; Verbeke2008).
There was a gap between the level of consumers’ knowledge and their willingness to buy pineapple-based products. This means that not all consumers who know a given product were willing to buy it. Poor knowledge of and weak consumer interest in dried pine-apple stemmed from the availability of fresh pinepine-apple year-round in southern Benin. For the other products, consumers raised concerns about the negative impact of sweet foods on human health. Consumers’ reluctance is supported by the fact that the consumption of sugar-sweetened beverages is often associated with risks of obesity, diabetes and heart disease (Fung et al. 2009; Gibson 2008; Ludwig, Peterson, and Gortmaker 2001). In fact, consumers believed that too much sugar is incor-porated into processed pineapple beverages. In contrast, processing companies claimed that most products, especially the juice, are natural with no addition of sweeteners. This suggests the need for certification to reassure consumers. The utility of certification is that it is a reliable means to promote particular products, and ensure marketing claims for unobservable quality attri-butes (Jahn, Schramm, and Spiller 2005; Vertinsky and Zhou 2000). Other advantages of certification for the value chain include strengthened reputation (Owari et al.2006).
Consumption of processed pineapple products
There was a gap between respondents’ willingness to buy and their current rate of consumption of pineapple pro-ducts, because of restricted purchasing power. Regarding consumers’ motivations, competitive price is often such a strong motivation for consumers’ purchase behaviour (e.g. Aoudji et al. 2011; Cameron and Galloway 2005; Close and Kukar-Kinney 2010; Ragaert et al.2004) that it is not a distinctive pattern of consumers of pineapple-based beverages in southern Benin. The three other motiv-ations – local beverage, therapeutic beverage and natural beverage– present marketing potential for product label-ling. Regarding the seeking of therapeutic beverage, pine-apple fruit and stem contain bromelain, an enzyme complex with several therapeutic properties (Hale et al.
2005; Maurer 2001). Consumers’ motive for natural pro-ducts lies in the perception that other sweet drinks avail-able on the market contain inorganic products such as saccharine, aromas, colorants, etc. The local beverage could be a slogan in marketing campaigns.
In the behaviour patterns, the consumption of pineap-ple beverage by the household heads alone, even at home, is supported by social habits in the region. Household heads are often treated differently from other family members (special drinks, special dishes, etc.). A signi fi-cant proportion of consumers bought pineapple-based beverages for particular events, especially ceremonies, because they are cheaper than other sweet drinks. However, this study does not capture the full extent of market data, especially the consumption by other family members outside the home.
There are opportunities for increased consumption of pineapple-based beverages in southern Benin. First, fewer than three fifths of respondents bought pineapple drinks regularly year-round. Second, in-bar consumption represented a low share of consumption venue. This low percentage of consumption in bars might hide the poor availability of the product in these places, and is consistent with the dissatisfaction of consumers about the availability of pineapple-based beverages.
Diverse social classes bought pineapple-based bev-erages. For example, there was a wide variation in monthly income of consumers (Table 1). This diversity might hide the existence of various consumer groups with specific needs.
Figure 6: Monthly consumption frequency of pineapple-based beverages.
Table 4: Monthly expenditure for the purchase of processed pineapple beverages.
Types of products
Average monthly expenditure (US$) Alone In family Total
Juice 0.62 0.85 1.47
Syrup 0 0.04 0.04
Cocktail 0.14 0.4 0.54
Total 0.76 1.29 2.05
Table 5: Gap analysis of the satisfaction level of consumers of pineapple-based beverages.
Attributes Expectation Perception
Competitive price 5.8 5.7
Easily available 5.9* 4.9
Quality 6.9* 5.5
Made with high quality raw materials 6.3* 4.9
Natural product 6.1* 5.0
Eco-friendly product 5.1* 4.7
Resistant packaging 5.1 5.3
Attractive packaging 5.6* 5.0
Attractive labelling 5.6* 4.9
Hygienic processing conditions 6.7* 5.2
Certification 6.2* 4.9
*Attributes with perception consistently inferior to expectations (Student’s t test on paired sample; p < 0.05).
6 Aoudji, Avocevou-Ayisso, Adégbidi, Gbénou and Lebailly
Satisfaction of consumers’ expectations
Consumers’ expectations were not met for 80% of attributes that matter to them. Competitive price and resistant packa-ging were the attributes with which consumers were satis-fied. Consumer satisfaction about price means a perception that the price was fair (Xia, Monroe, and Cox
2004). The affordable price might highlight competition in Benin’s pineapple processing industry. Consumers’ satis-faction might also lie in the fact that the price of pineapple-based beverages is lower compared to other sweet drinks on the market, e.g. Coca Cola®, Sprite® and Fanta®. Consu-mers’satisfaction with price means there is a margin for pro-cessing companies to upgrade products and service, and increase the price while staying competitive.
The attributes for which efforts are needed to increase customer satisfaction include both technical quality attri-butes and functional quality attriattri-butes. Regarding techni-cal aspects, consumers did not trust the overall quality of the product and the current conditions of production (dis-satisfaction with the attributes ‘quality’, ‘use of high quality raw materials’, ‘natural product’ (non-use of sweeteners and colorants) and‘hygienic condition of pro-duction’. This result suggests the need for certification. Besides modern production units where distrust might be addressed through certification, the traditional pro-duction of pineapple juice by women remains problematic. This issue could be addressed to some extent by training women to comply with hygienic norms at all stages (from production through distribution).
Regarding the attractiveness of the packaging, consu-mers complained about the greenness of the bottles used by most companies. According to them, this does not highlight the attractive colour of the juice itself, as would do white bottles. Interviews with processing com-panies revealed that packaging was a critical bottleneck to them. Most pineapple processing companies had to collect bottles for the conditioning of pineapple juice because no package production facility is available in the country. In addition, consumers found the label on the packaging unattractive. This result suggests the need for capacity building in marketing for processing compa-nies, to raise their awareness about the importance of product labels.
The importance of product packaging and labelling in the satisfaction of consumers of pineapple-based bev-erages in southern Benin diverged from the case study of urban consumers of non-timber forest products in Swit-zerland who claimed that these attributes did not matter to them (Kilchling, Hansmann, and Seeland2009). However, the latter result was supported by the fact that consumers sought to appear more rational than they are in reality (Kilchling, Hansmann, and Seeland2009).
The dissatisfaction of consumers with the availability of pineapple-based drinks raises the issue of the effective-ness of the distribution channel. A quick survey in bars showed that processed pineapple drinks were seldom available to consumers in these places. Contractual arrangements with bar holders could make the product more visible, and increase market opportunities for value chain stakeholders (farmers, transporters, middlemen and beverage makers (processing)).
Consumers raised concerns about environmental aspects of the production, hence the necessity to document the traceability of products, and the production conditions as well. This aspect is of critical importance, especially for targeting export outlets.
Implications for upgrading
Three types of upgrading paths (Giuliani, Pietrobelli, and Rabellotti 2005; Humphrey and Schmitz 2000) emerged from the discussion, namely process upgrading, product upgrading and functional upgrading.
Certification, labelling and effective marketing (including advertising) are essential to the value chain. These will require a synergic effort between value chain stakeholders, i.e. farmers, transporters, middlemen and beverage makers (processing). For example, the linkage between processing companies, bar holders and other dis-tribution agents is useful for improved availability of pro-cessed pineapple products to consumers. The above actions relate to process upgrading, and should result in improved efficiency in the value chain.
The study showed the need to acquire new functions in the value chain. The sealing of partnerships with potential entrepreneurs willing to invest in the production of packa-ging would be useful. This falls within the scope of func-tional upgrading, i.e. the insertion of new functions in the value chain (Giuliani, Pietrobelli, and Rabellotti 2005; Humphrey and Schmitz2000).
Certification and labelling should contribute to the differentiation of the product, especially the beverages. Proper packaging will increase the final value of the product (higher value added). There are also opportunities to diversify the range of processed pineapple products. These actions fall within the scope of product upgrading, i.e. the increase of thefinal value of the product (Giuliani, Pietrobelli, and Rabellotti 2005; Humphrey and Schmitz
2000).
The critical question is: who will take the lead in this action? There is a platform for stakeholders in the pineap-ple business (farmers, transporters, middlemen and bever-age makers (processing)). This must be strengthened for value chain development (improved coordination). As hypothesized, capturing the potential of processed pineap-ple products will require coordinated efforts from all value chain stakeholders.
Conclusions
The focal target of this paper was to identify upgrading paths in Benin’s pineapple value chain based on a market assessment for processed products. Dried pineap-ple, jam, syrup, juice and cocktail were the processed pine-apple products available on the market. The potential for production of processed pineapple products was under-exploited.
Beverages (juice, syrup and cocktails) were the most popular and most consumed pineapple-based products. Among the beverages, the juice was by far the most popular product. The purchase of pineapple-based bev-erages by consumers was driven by the following motiv-ations: competitive price, willingness to buy a local beverage, natural beverage and therapeutic beverage.
Consumers’ socio-demographic profile was diversi-fied. A relatively high proportion of respondents was reluctant to purchase processed pineapple products because of the perception that too much sugar is incorpor-ated in them.
The study revealed the existence of a margin for the value chain to upgrade products and services, and increase the price while staying competitive. Adequate research-development support in processing technologies, as well as complementary market appraisals are essential to the development of new products. A strong marketing and advertisement campaign is needed to support wider knowledge of processed pineapple products by consu-mers. Two consumer motivations (local beverage and natural beverage) offer opportunities for product labelling and advertisement. Certification at all the stages of the value chain is a critical issue. Product traceability is a pre-requisite for export in regional and international markets. A complementary survey among women would be useful to get a better picture of the consumption of pineap-ple beverages in southern Benin. Future research should explore the institutional framework, e.g. the laws govern-ing the settlement and operation of processgovern-ing companies. It would also be useful to explore market segmentation to check whether various consumer groups are seeking specific processed pineapple products.
Note
1. Average exchange rate from 1 December 2012 to 28 Febru-ary 2013 was XOF 1 = USD 0.002; Source:http://www. exchangerates.org.uk/XOF-USD-exchange-rate-history. html(Accessed June 13, 2013).
Disclosure statement
No potential conflict of interest was reported by the authors.
References
ABePEC.2010.“Analyse de l’offre et de la demande de l’ananas au Bénin.” Cotonou, Bénin.
Aoudji, A. K. N., A. Adégbidi, S. Akoha, V. Agbo, and P. Lebailly. 2012. “Value Added and Equity in the Smallholder-Produced Teak (Tectona grandis L.f.) Poles Value Chain in Southern Benin.” Tropicultura 30 (1): 55–60. Aoudji, A. K. N., A. Adégbidi, J. C. Ganglo, V. Agbo, A. S. I. Yêvidé, C. De Cannière, and P. Lebailly. 2011. “Satisfaction Across Urban Consumers of Smallholder-Produced Teak (Tectona grandis L.f.) Poles in South Benin.” Forest Policy and Economics 13 (8): 642–651. Ban-Koffi, L., and Y. W. Han.1990.“Alcohol Production From
Pineapple Waste.” World Journal of Microbiology and Biotechnology 6 (3): 281–284.
Bates, R. H.1981. Markets and States in Tropical Africa: The Political Basis of Agricultural Policies. Berkeley: University of California Press.
Bryhni, E. A., D. V. Byrne, C. Rodbotten, C. Claudi-Magnussen, H. Agerhem, M. Johanson, P. Lea, and M. Martens.2002. “Consumer Perception of Pork in Denmark, Norway and Sweden.” Food Quality and Preference 13 (5): 257–266. Cameron, D. D., and A. Galloway. 2005. “Consumer
Motivations and Concerns in Online Auctions: An Exploratory Study.” International Journal of Consumer Studies 29 (3): 181–192.
Chanprasartsuk, O., C. Prakitchaiwattana, R. Sanguandeekul, and G. H. Fleet.2010.“Autochthonous Yeasts Associated with
Mature Pineapple Fruits, Freshly Crushed Juice and Their Ferments; and the Chemical Changes During Natural Fermentation.” Bioresource Technology 101 (19): 7500–7509. Close, A. G., and M. Kukar-Kinney.2010. “Beyond Buying: Motivations Behind Consumers’ Online Shopping Cart use.” Journal of Business Research 63 (9-10): 986–992. DAFF (Department of Agriculture, Fisheries and Forestry, South
Africa). 2011. “A Profile of the South African Pineapple Market Value Chain.” Pretoria, South Africa. Accessed January 2, 2016. http://www.daff.gov.za/docs/AMCP/ Pineapplemvcp2011-12.pdf
Danielou, M., and C. Ravry. 2005. “The Rise of Ghana’s Pineapple Industry: From Successful Takeoff to Sustainable Expansion.” Africa Region Working Paper Series No. 93. World Bank. Accessed January 2, 2016.
http://www.worldbank.org/afr/wps/wp93.pdf
Dorward, A., J. Kydd, J. Morrison, and I. Urey.2004.“A Policy Agenda for Pro-Poor Agricultural Growth.” World Development 32 (1): 73–89.
Fold, N., and K. V. Gough. 2008. “From Smallholders to Transnationals: The Impact of Changing Consumer Preferences in the EU on Ghana’s Pineapple Sector.” Geoforum; Journal of Physical, Human, and Regional Geosciences 39 (5): 1687–1697.
Fung, T. T., V. Malik, K. M. Rexrode, J. E. Manson, W. C. Willett, and F. B. Hu. 2009. “Sweetened Beverage Consumption and Risk of Coronary Heart Disease in Women.” American Journal of Clinical Nutrition 89 (4): 1037–1042.
Gibson, S.2008.“Sugar-sweetened Soft Drinks and Obesity: A Systematic Review of the Evidence From Observational Studies and Interventions.” Nutrition Research Reviews 21 (2): 134–147.
Giuliani, E., C. Pietrobelli, and R. Rabellotti.2005.“Upgrading in Global Value Chains: Lessons From Latin American Clusters.” World Development 33 (4): 549–573.
Gupta, K., and D. W. Stewart.1996.“Customer Satisfaction and Customer Behavior: The Differential Role of Brand and Category Expectations.” Marketing Letters 7 (3): 249–263. Hale, L. P., P. K. Greer, C. T. Trinh, and C. L. James. 2005.
“Proteinase Activity and Stability of Natural Bromelain Preparations.” International Immunopharmacology 5 (4): 783–793.
van den Heuvel, T., H. van Trijp, C. van Woerkum, R. J. Renes, and B. Gremmen. 2007. “Linking Product Offering to Consumer Needs; Inclusion of Credence Attributes and the Influences of Product Features.” Food Quality and Preference 18 (2): 296–304.
Humphrey, J., and H. Schmitz. 2000. “Governance and Upgrading: Linking Industrial Cluster and Global Value Chain Research.” IDS Working Paper, No. 120, Institute of Development Studies, University of Sussex, Brighton. Humphrey, J., and H. Schmitz. 2002.“How Does Insertion in
Global Value Chains Affect Upgrading in Industrial Clusters?” Regional Studies 36 (9): 1017–1027.
Jahn, G., M. Schramm, and A. Spiller.2005.“The Reliability of Certification: Quality Labels as a Consumer Policy Tool.” Journal of Consumer Policy 28 (1): 53–73.
Jama, B., and G. Pizarro.2008.“Agriculture in Africa: Strategies to Improve and Sustain Smallholder Production Systems.” Annals of the New York Academy of Sciences 1136 (1): 218–232.
Kaplinsky, R., and M. Morris. 2002. “A Handbook for Value Chain Research.” IDRC. Accessed January 2, 2016.http:// www.fao.org/fileadmin/user_upload/fisheries/docs/Value_ Chain_Handbool.pdf
Kelley, S. W., and L. W. Turley.2001.“Consumer Perceptions of Service Quality Attributes at Sporting Events.” Journal of Business Research 54 (2): 161–166.
Kilchling, P., R. Hansmann, and K. Seeland.2009.“Demand for Non-Timber Forest Products: Surveys of Urban Consumers and Sellers in Switzerland.” Forest Policy and Economics 11 (4): 294–300.
8 Aoudji, Avocevou-Ayisso, Adégbidi, Gbénou and Lebailly
Lewis, G. H., and R. G. Johnson.1971.“Kendall’s Coefficient of Concordance for Sociometric Rankings with Self Excluded.” Sociometry 34 (4): 496–503.
Ludwig, D. S., K. E. Peterson, and S. L. Gortmaker. 2001. “Relation Between Consumption of Sugar-Sweetened Drinks and Childhood Obesity: A Prospective, Observational Analysis.” The Lancet 357 (9255): 505–508. Maurer, H. R.2001. “Bromelain: Biochemistry, Pharmacology and Medical use.” Cellular and Molecular Life Sciences 58 (9): 1234–1245.
Ngapo, T. M., J.-F. Martin, and E. Dransfield.2004.“Consumer Choices of Pork Chops: Results From Three Panels in France.” Food Quality and Preference 15 (4): 349–359. Nigam, J. N. 1999. “Continuous Ethanol Production From
Pineapple Cannery Waste.” Journal of Biotechnology 72 (3): 197–202.
Oliver, R. L.1980.“A Cognitive Model of the Antecedents and Consequences of Satisfaction Decisions.” Journal of Marketing Research 17: 460–469.
Owari, T., H. Juslin, A. Rummukainen, and T. Yoshimura.2006. “Strategies, Functions and Benefits of Forest Certification in Wood Products Marketing: Perspectives of Finnish Suppliers.” Forest Policy and Economics 9 (4): 380–391. Panjai, L., K. Ongthip, and N. Chomsri.2009.“Complex Fruit
Wine Produced From Dual Culture Fermentation of Pineapple Juice with Torulaspora delbrueckii and Saccharomyces cerevisiae.” Asian Journal of Food and Agro-Industry 2 (2): 135–139.
Pickett-Baker, J., and R. Ozaki. 2008. “Pro-Environmental Products: Marketing Influence on Consumer Purchase Decision.” Journal of Consumer Marketing 25 (5): 281–293. Ragaert, P., W. Verbeke, F. Devlieghere, and J. Debevere.2004. “Consumer Perception and Choice of Minimally Processed
Vegetables and Packaged Fruits.” Food Quality and Preference 15 (3): 259–270.
Santosa, M., and J. X. Guinard. 2011. “Means-end Chains Analysis of Extra Virgin Olive Oil Purchase and Consumption Behavior.” Food Quality and Preference 22 (3): 304–316.
Smith, L. A., and D. R. Foxcroft.2009.“The Effect of Alcohol Advertising, Marketing and Portrayal on Drinking Behaviour in Young People: Systematic Review of Prospective Cohort Studies.” BMC Public Health 9 (51): 1–11.doi:10.1186/1471-2458-9-51.
Stoian, D., J. Donovan, J. Fisk, and M. F. Muldoon.2012.“Value Chain Development for Rural Poverty Reduction: A Reality Check and a Warning.” Enterprise Development and Microfinance 23 (1): 54–60.
Taylor, K. A.1997. “A Regret Theory Approach to Assessing Consumer Satisfaction.” Marketing Letters 8 (2): 229–238. Vagneron, I., G. Faure, and D. Loeillet.2009.“Is There a Pilot in
the Chain? Identifying the Key Drivers of Change in the Fresh Pineapple Sector.” Food Policy 34 (5): 437–446. Verbeke, W.2008.“Impact of Communication on Consumers’
Food Choices.” Proceedings of the Nutrition Society 67 (3): 281–288.
Verbeke, W., and I. Vackier. 2004. “Profile and Effects of Consumer Involvement in Fresh Meat.” Meat Science 67: 159–168.
Vertinsky, I., and D. Zhou. 2000. “Product and Process Certification – Systems, Regulations and International Marketing Strategies.” International Marketing Review 17 (3): 231–253.
Xia, L., K. B. Monroe, and J. L. Cox.2004.“The Price Is Unfair! A Conceptual Framework of Price Fairness Perceptions.” Journal of Marketing 68 (4): 1–15.