© Joël Jean, 2018
Characterisation of different biofuel blends for cold start
and altitude relight in aeroengines
Mémoire
Joël Jean
Maîtrise en génie mécanique - avec mémoire
Maître ès sciences (M. Sc.)
iii
RÉSUMÉ
L'objectif du projet de recherche est d'identifier les biocarburants les plus prometteurs pour une utilisation dans les turbines à gaz actuelles réduisant ainsi les émissions de gaz à effet de serre. Cette étude examinera le fonctionnement d’une chambre de combustion tubulaire lors de tests d’opérabilités (démarrage à froid et rallumage en haute altitude) en déterminant les ratios carburant-air minimum et maximum. Pour évaluer leur rendement de combustion par rapport à ces conditions d’opérabilités, les enveloppes d’allumages sont obtenues pour sept nouveaux mélanges de biocarburants obtenus à partir de la caméline ou du jatropha mélangé avec du Jet A-1 et diverses teneurs en aromatiques comparées au carburant de référence soit le Jet A-1. Ces nouveaux mélanges de biocarburants ont été sélectionnés en fonction de la durabilité de l’approvisionnement et du potentiel de réduction des émissions.
En général, le projet a démontré que les mélanges de biocarburants de deuxième génération sont des carburants alternatifs viables au pétrole actuel apportant également des avantages environnementaux et pouvant être produits en grandes quantités sans impact majeur sur la chaîne d'approvisionnement alimentaire.
v
ABSTRACT
The objective of the proposed research is to identify the most promising drop-in biofuels for use in aircraft gas turbines and their potential to reduce greenhouse gases. This investigation reviews proper engine operability (cold start and altitude relight) and allows determining the minimum and maximum fuel-air ratios for these conditions. To evaluate their relative combustion performance, cold start and altitude relight maps are obtained for seven new biofuel blends obtained from camelina or jatropha mixed with Jet A-1 fuel with various aromatic contents and compared to Jet A-1 as the baseline fuel. These new biofuel blends were selected based on sustainability of supply and potential for reduction of emissions.
In general, the project demonstrated that at least second generation biofuel blends are viable alternative fuels to the current petroleum based that can also bring environmental benefits and can be producible in large quantities without impacting the food supply chain.
vii
TABLE OF CONTENTS
RÉSUMÉ ... iii
ABSTRACT ... v
TABLE OF CONTENTS ... vii
LIST OF FIGURES ... xi LIST OF TABLES ... xv ABBREVIATIONS ... xvii NOMENCLATURE ... xix ACKNOWLEDGEMENTS ... xxvii CHAPTER 1- INTRODUCTION... 1 1.1. BIOFUEL PRODUCTION ... 2
1.2. SUITABLE FUELS FOR AVIATION ... 4
1.3. RANGE PAYLOAD ... 7
1.4. OPERABILITY TESTS OF NEW BIOFUELS ... 10
1.5. TEST PLAN ... 11
CHAPTER 2- LITERATURE & THEORY REVIEW ... 15
2.1. COMBUSTION PERFORMANCE ... 15 2.1.1. COMBUSTION EFFICIENCY ... 15 2.1.2. COMBUSTION STABILITY ... 21 2.1.3. IGNITION ... 27 2.2. FUEL INJECTION ... 35 2.2.1. MECHANISM OF ATOMIZATION ... 36
2.2.2. BREAKUP INTO DROPS ... 37
2.2.3. ATOMIZERS ... 38
2.2.4. MEAN DROP SIZE ... 39
2.3. SUMMARY ... 39
CHAPTER 3- DESCRIPTION OF CAN COMBUSTOR ... 41
3.1. THEORY OF AIR DISTRIBUTION ... 41
3.1.1. AERODYNAMICS ... 41
3.1.2. PRESSURE-LOSS PARAMETERS ... 41
3.1.3. FLOW THROUGH LINER HOLES ... 43
viii
3.2.1. SIMPLEX GEOMETRY ... 45
3.2.2. DUPLEX GEOMETRY ... 47
3.3. THEORETICAL PERFORMANCE ... 49
3.3.1. COLD START TESTS ... 49
3.3.2. ALTITUDE RELIGHT TESTS ... 50
3.4. EXPERIMENTAL PERFORMANCE ... 52
3.4.1. COLD START CONDITIONS ... 52
3.4.2. ALTITUDE RELIGHT CONDITIONS ... 55
3.5. COMPARISON COLD FLOW (THEORETICAL, EXPERIMENTAL) & HOT FLOW ... 59
3.5.1. COLD START CONDITIONS ... 59
3.5.2. ALTITUDE RELIGHT CONDITIONS ... 62
CHAPTER 4- TEST FUELS & PROPERTIES ... 67
4.1. TEST FUELS ... 67
4.2. FUEL PROPERTIES ... 69
4.3. SUMMARY ... 78
CHAPTER 5- EXPERIMENTAL SETUP ... 80
5.1. MAIN COMPONENTS FOR THE TEST RIG ... 82
5.1.1. STEAM EJECTOR ... 82
5.1.2. COOLING UNIT ... 84
5.1.3. HEAT EXCHANGER ... 85
5.1.4. HOT EXHAUST & COLD DUCT SPECIFICATION ... 86
5.1.5. VALVES ... 87
CHAPTER 6- RESULTS AND DISCUSSIONS ... 91
6.1. COLD START TESTS ... 92
6.1.1. SIMPLEX ATOMIZER ... 92
6.1.2. DUPLEX ATOMIZER ... 99
6.2. ALTITUDE RELIGHT TESTS ... 106
6.2.1. SIMPLEX ATOMIZER ... 106
6.2.2. DUPLEX ATOMIZER ... 114
CHAPTER 7- INFRARED IMAGERY ... 121
CHAPTER 8- CONCLUSIONS ... 123
REFERENCES ... 125
ix
APPENDIX B. ACCURACY OF THE EXPERIMENTAL MEASUREMENTS ... 133
APPENDIX C. DATA REDUCTION PROCEDURE ... 135
C1: PROCESSING FOR SUCCESSFUL IGNITION ... 135
C2: PROCESSING FOR UNSUCCESSFUL IGNITION (NO IGNITION) ... 136
C3: PROCESSING FOR UNSUCCESSFUL IGNITION (NO FLAME STABILIZATION)... 137
xi
LIST OF FIGURES
Figure 1-1: Feed stocks from a) Camelina and b) Jatropha ... 2
Figure 1-2 : UOP’s Hydrotreated Renewable Jet Process and Life Cycle Assessment (LCA) result from Michigan Technological University with UOP and Targeted Growth (Figure from reference [4]) ... 3
Figure 1-3: Chemical processing technique converting bio-derived oils to Bio-SPKs (Figure from reference [4]) ... 4
Figure 1-4 : Relationship between LCV and density for range of liquid fuels showing limits of Jet A-1 specification (Figure from reference [1]) ... 6
Figure 1-5 : Changes to the range performance of Boeing 747-200B due to alterations to the hydrocarbons fuel used for flight (Figure from reference [1]) ... 8
Figure 1-6 : Changes to the range performance of a Boeing 747-200B due to the use of alternative fuels (Figure from reference [1]) ... 9
Figure 2-1 : Controlling Parameters in a Gas Turbine Combustor (Figure from reference [20]) ... 16
Figure 2-2 : Reaction Rate Controlling Parameters... 16
Figure 2-3 : Mixing Rate Controlling Parameters ... 19
Figure 2-4 : Evaporation Rate Controlling Parameters ... 20
Figure 2-5 : Reaction and Evaporation Rate Controlling Parameters ... 21
Figure 2-6: Blow-off limits for the tubular combustor with the two atomizers (simplex and duplex)... 26
Figure 2-7: Spark Visualization ... 28
Figure 2-8 : Igniter location ... 29
Figure 2-9 : Evolution of the igniter between the beginning and the end of the test schedule ... 30
Figure 3-1: Can Combustor Geometry with Simplex Atomizer from Ref. [14] ... 45
Figure 3-2: (a) Percentage of flow for each station with simplex nozzle configuration; (b) Total percentage of flow after each station with simplex nozzle configuration ... 46
Figure 3-3: Can Combustor Geometry with Duplex Atomizer from Ref. [14] ... 47
Figure 3-4: (a) Percentage of flow for each station with duplex nozzle configuration; (b) Total percentage of flow after each station with duplex nozzle configuration ... 48
Figure 3-5: Theoretical overall pressure loss through the combustion chamber versus air flow at ambient pressure and various temperatures with the simplex nozzle configuration ... 49
Figure 3-6: Theoretical overall pressure loss through the combustion chamber versus air flow at ambient pressure and various temperatures with the duplex nozzle configuration ... 50
Figure 3-7: Theoretical overall pressure loss through the combustion chamber versus flow at various altitudes with the simplex nozzle configuration ... 51
Figure 3-8: Theoretical overall pressure loss through the combustion chamber versus air flow at various altitudes with the duplex nozzle configuration ... 51
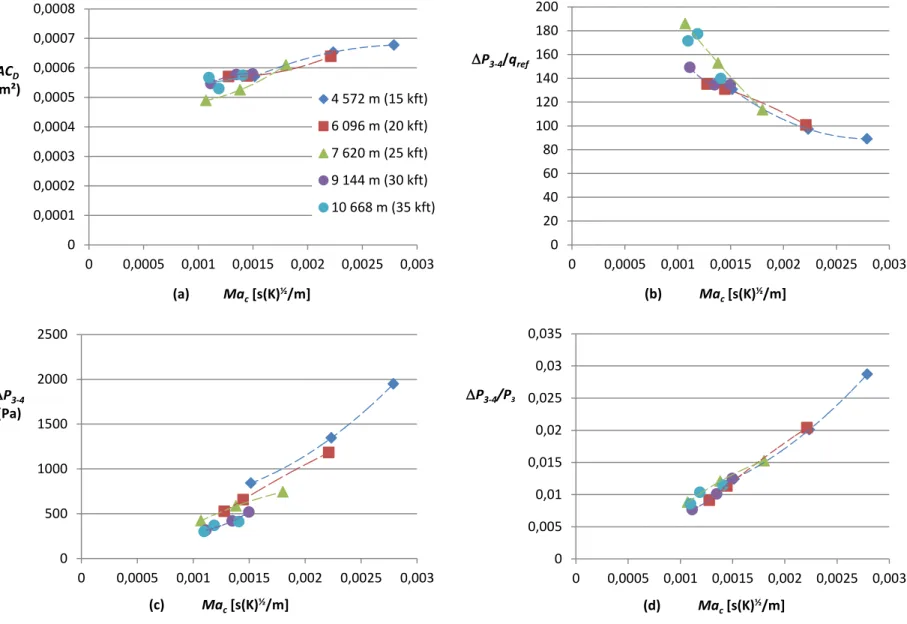
Figure 3-9: Experimental data (cold flow) (a) ACD vs Mac, (b) P3-4/qref vs Mac, (c) P3-4 vs Mac and (d) P3-4/P3 vs Mac with the simplex atomizer during cold start tests ... 53
Figure 3-10: Experimental data (cold flow) (a) ACD vs Mac, (b) P3-4/qref vs Mac, (c) P3-4 vs Mac and (d) P 3-4/P3 vs Mac with the duplex atomizer during cold start tests ... 54
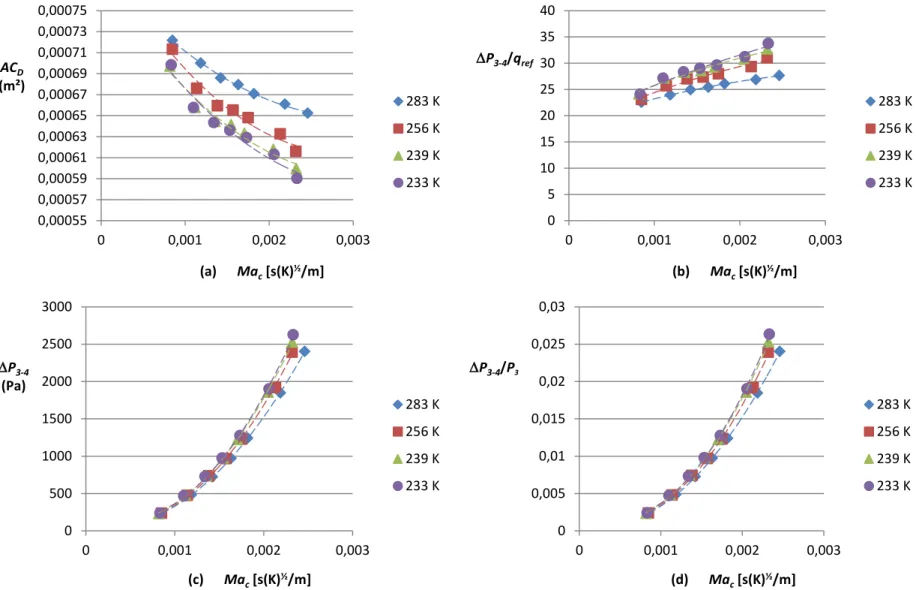
Figure 3-11: Experimental data (cold flow) (a) ACD vs Mac, (b) P3-4/qref vs Mac, (c) P3-4 vs Mac and (d) P 3-4/P3 vs Mac with the simplex atomizer during altitude relight tests ... 57
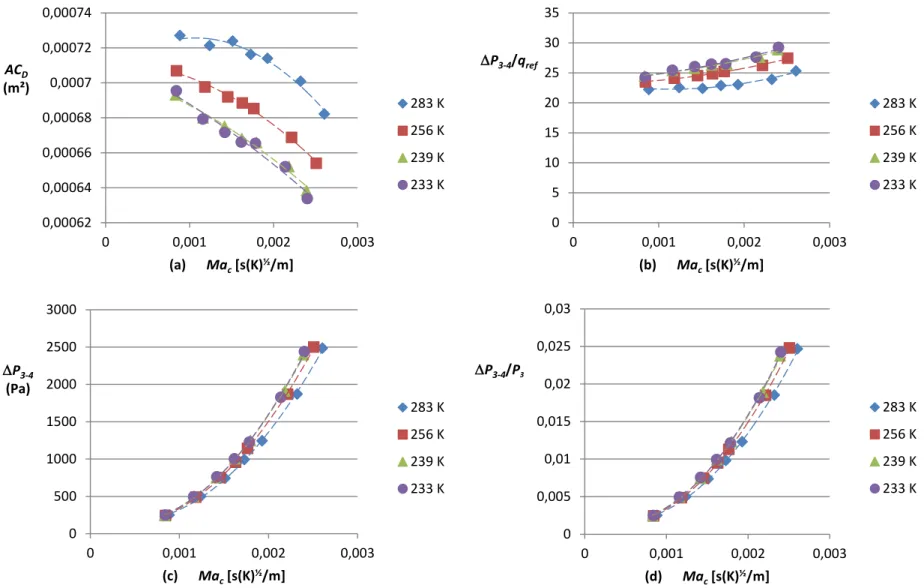
Figure 3-12: Experimental data (cold flow) (a) ACD vs Mac, (b) P3-4/qref vs Mac, (c) P3-4 vs Mac and (d) P 3-4/P3 vs Mac with the duplex atomizer during altitude relight tests ... 58
xii
Figure 3-13: Comparison of P3-4/P3 across the combustor for cold (experimental, theoretical) and hot flows
with the simplex nozzle at (a) 283 K, (b) 256 K, (c) 239 K and (d) 233 K ... 60
Figure 3-14: Comparison of P3-4/P3 across the combustor for cold (experimental, theoretical) and hot flows with the duplex nozzle at (a) 283 K, (b) 256 K, (c) 239 K and (d) 233 K... 61
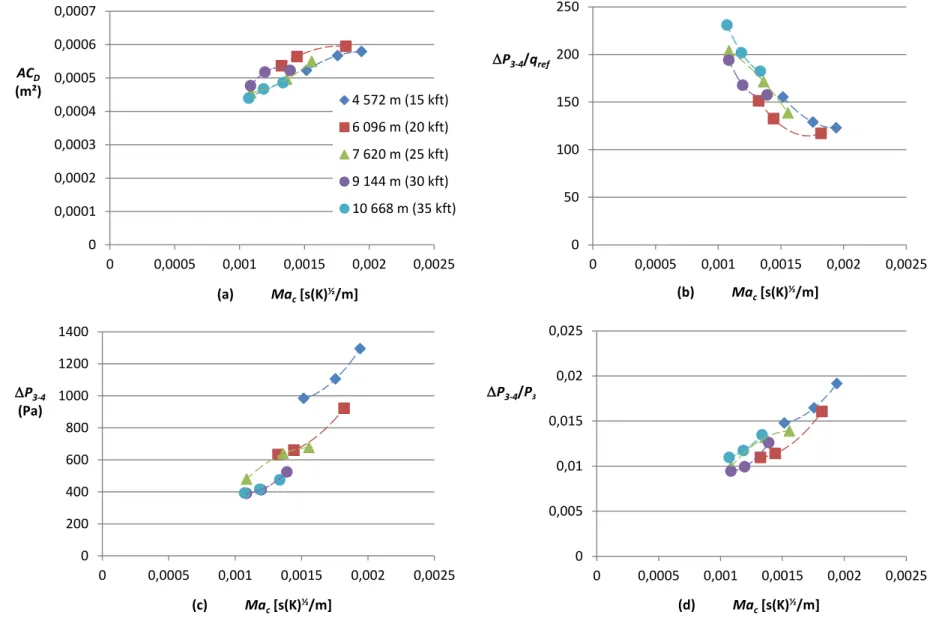
Figure 3-15: Comparison between experimental (cold flow, hot flow) and theoretical flow at (a) 4 572 m (15 kft), (b) 6 096 m (20 kft), (c) 7 620 m (25 kft), (d) 9 144 m (30 kft) and (e) 10 668 m (35 kft) with the simplex nozzle configuration... 63
Figure 3-16: Comparison between experimental (cold flow, hot flow) and theoretical flow at (a) 4 572 m (15 kft), (b) 6 096 m (20 kft), (c) 7 620 m (25 kft), (d) 9 144 m (30 kft) and (e) 10 668 m (35 kft) with the duplex nozzle configuration... 65
Figure 4-1: Fuel Distillation Ranges ... 72
Figure 5-1: Schematic of Cold Start and Altitude Relight Test Facility ... 80
Figure 5-2: Design of Cold Start and Altitude Relight Test Facility ... 81
Figure 5-3: Actual Cold Start and Altitude Relight Test Facility ... 81
Figure 5-4: Steam ejector Graham 110C... 83
Figure 5-5: Performance curve of Graham 110C ... 83
Figure 5-6: Bleed Valve to control absolute pressure in the combustor ... 84
Figure 5-7: Air Cooling Unit ... 84
Figure 5-8: Air-Fuel Heat Exchanger and Combustor Valve ... 85
Figure 5-9: Schematic of Fuel Network Control System ... 85
Figure 5-10: Hot Exhaust, and Cold Duct with Insulation ... 86
Figure 5-11: Materials & Specifications of Combustor Valve – 5,08 cm (2 in) Diameter (Red & White Gate Valve) from Ref. [59] ... 88
Figure 5-12: Dimensions, Weights & Valve Data of Combustor Valve – 5,08 cm (2 in) Diameter (Red & White Gate Valve) from Ref. [59] ... 89
Figure 5-13: Materials & Specifications of Bleed Valve – 6,35 cm (2-½ in) Diameter (Red & White Butterflies Valve) from Ref. [60] ... 89
Figure 5-14: Cv Values of Bleed Valve – 6,35 cm (2-½ in) Diameter (Red & White Butterflies Valve) from Ref. [60] ... 90
Figure 6-1: Cold Start (283 K) with simplex nozzle - (a) FAR vs P3-4, (b) W3, (c) Theta ... 95
Figure 6-2: Cold Start (256 K) with simplex nozzle - (a) FAR vs P3-4, (b) W3, (c) Theta ... 96
Figure 6-3: Cold Start (239 K) with simplex nozzle – (a) FAR vs P3-4, (b) W3, (c) Theta ... 97
Figure 6-4: Cold Start (233 K) with simplex nozzle – (a) FAR vs P3-4, (b) W3, (c) Theta ... 98
Figure 6-5: Cold Start (283 K) with duplex nozzle - (a) FAR vs P3-4, (b) W3, (c) Theta ... 102
Figure 6-6: Cold Start (256 K) with duplex nozzle – (a) FAR vs P3-4, (b) W3, (c) Theta ... 103
Figure 6-7: Cold Start (239 K) with duplex nozzle – (a) FAR vs P3-4, (b) W3, (c) Theta ... 104
Figure 6-8: Cold Start (233 K) with duplex nozzle – (a) FAR vs P3-4, (b) W3, (c) Theta ... 105
Figure 6-9: Altitude Relight (4 572 m (15 kft)) with simplex nozzle – (a) FAR vs P3-4, (b) W3, (c) Theta ... 109
Figure 6-10: Altitude Relight (6 096 m (20 kft)) with simplex nozzle – (a) FAR vs P3-4, (b) W3, (c) Theta ... 110
Figure 6-11: Altitude Relight (7 620 m (25 kft)) with simplex nozzle – (a) FAR vs P3-4, (b) W3, (c) Theta ... 111
Figure 6-12: Altitude Relight (9 144 m (30 kft)) with simplex nozzle – (a) FAR vs P3-4, (b) W3, (c) Theta ... 112
Figure 6-13: Altitude Relight (10 668 m (35 kft)) with simplex nozzle – (a) FAR vs P3-4, (b) W3, (c) Theta ... 113
xiii
Figure 6-15: Altitude Relight (6 096 m (20 kft)) with duplex nozzle – (a) FAR vs P3-4, (b) W3, (c) Theta ... 117
Figure 6-16: Altitude Relight (7 620 m (25 kft)) with duplex nozzle – (a) FAR vs P3-4, (b) W3, (c) Theta ... 118
Figure 6-17: Altitude Relight (9 144 m (30 kft)) with duplex nozzle – (a) FAR vs P3-4, (b) W3, (c) Theta ... 119
Figure 6-18: Altitude Relight (10 668 m (35 kft)) with duplex nozzle – (a) FAR vs P3-4, (b) W3, (c) Theta .... 120
Figure 7-1: Combustion velocity vector field and real flow field with the duplex atomizer ... 122
Figure B-1: Regression curve of the air mass flow rate versus voltage ... 133
Figure D-1: Low fuel flow limit for each atomizer at 283 K ... 140
Figure D-2: Low fuel flow limit for each atomizer at 256 K ... 140
Figure D-3: Low fuel flow limit for each atomizer at 239 K ... 141
xv
LIST OF TABLES
Table 1-1: Wobbe Index of the blended fuels ... 7
Table 1-2: Cold Start Test Matrix ... 12
Table 1-3: Altitude Relight Test Matrix for Simplex Nozzle Configuration ... 13
Table 1-4: Altitude Relight Test Matrix for Duplex Nozzle Configuration ... 13
Table 2-1 : Overall chemical reaction reduction at each altitude ... 25
Table 3-1: Can Combustor Dimensions (Simplex Nozzle Configuration) ... 46
Table 3-2: Can Combustor Dimensions (Duplex Nozzle Configuration)... 48
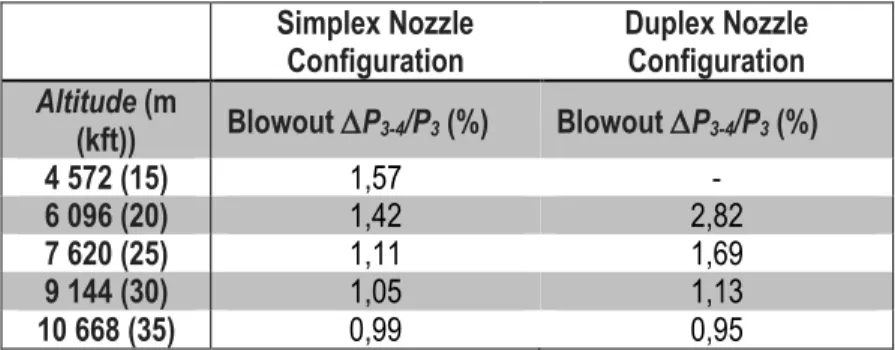
Table 3-3: Blowout differential pressures at various relight altitudes ... 51
Table 4-1: Physical properties for Jet A-1 and blends ... 68
Table 4-2: Improvement of thermal load factor... 76
Table 5-1: Specification of Stainless Steel Duct Class 150 – 20,32 cm (8 in) Diameter from Ref. [58] ... 86
Table 5-2: Calculation of the Flow Coefficient Cv for the Combustor Valve at Cold Start Conditions ... 88
Table 5-3: Calculation of the Flow Coefficient Cv for the Bleed Valve at Altitude Relight Conditions ... 89
xvii
ABBREVIATIONS
Symbol Description
ABS Acrylonitrile Butadiene Styrene
ASTM American Society for Testing and Materials CAAFI Commercial Aviation Alternative Fuels Initiative FAA Federal Aviation Administration
FAE Fatty Acid Ester
FAME Fatty Acid Methyl Ester
FT Fischer-Tropsch
GHG Green House Gas
HC Hydrocarbon
HRJ Hydrotreated Renewable Jet
IQT Ignition Quality Tester
ISTP International Science and Technology Partnerships
LCA Life Cycle Assessment
MDEIE Ministère du développement économique, de l'Innovation et de l'exportation
NRC National Research Council
NSERC Natural Science and Engineering Research Council of Canada P&WC Pratt & Whitney Canada
PZ Primary Zone
RMS Root Mean Square
RZ Recirculation Zone
SPK UK
Synthetic Paraffinic Kerosene United Kingdom
UOP Universal Oil Products
xix
NOMENCLATURE
Symbol Description
Roman Letters
b Temperature dependence of reaction rates in Eq. (2-4)
cp Specific heat at constant pressure
cp,g Gas specific heat
d0 Inlet diameter of droplet
dq Quenching diameter
fc Fraction of total combustor air employed in combustion
k1 Constant in Eq. (4-18)
k2 Can combustor constant in Eq. (6-1)
k0 Thermal conductivity at inlet conditions
kg Gas thermal conductivity
ℓ Turbulence scale
m Correlated constant in Eq. (2-4)
an
m Annulus mass flow rate
,
comb s
m Flow after each station in the combustor
h
m Hole flow rate
n Reaction order
p Static pressure
p1 Valve inlet pressure
p2 Valve outlet pressure
pf Fuel vapor pressure
q Spread parameter of particle distribution
xx
tc Characteristic overall time to burn liquid fuel
tch Characteristic time associated with chemical reaction
td Characteristic time associated with mixing
teb Characteristic time associated with evaporation
u’ RMS value of velocity fluctuations
uj Velocity variable
xj Spatial variable
Aan Annulus area
Ac, Acomb Combustor liner area
Aeq_hole Equivalent hole with lip area
Af Flame area
Ah,eff Total effective area of the holes in the liner
Ah,i Effective area of the ith hole
Ahole Hole area
Alip Lip area
Aref Combustor reference area
ACD Equivalent hole area of the combustor
AFR Air-fuel ratio
AG Aniline gravity constant
AP Aniline point
°API American Petroleum Institute gravity
B Mass transfer number
BG Fractional blockage based upon geometry
C1 Constant in Eq. (2-25) and Eq. (2-26)
C2 Constant in Eq. (2-27)
C3 Constant depends on several parameters given the best
xxi
CD Drag coefficient or discharge coefficient
CD,i Discharge coefficient in the ith hole
Cv Flow coefficient
C/H Carbon-Hydrogen ratio
CN Cetane number
D Diffusion coefficient or Diameter
D0 Initial Sauter mean diameter of the spray
D32, SMD Sauter mean diameter
Dan Equivalent annulus diameter
Dcomb Combustor liner diameter
Dref Maximum diameter of combustor casing
Da Damköhler number
DCN Derived Cetane number
Ei Ignition energy
FAR Fuel-air ratio
FARc Fuel-air ratio in combustion zone
FARLLO Fuel-air ratio at lean light-up value
FN Flow number
I Turbulence intensity
Iw Wobbe index
IAS Indicated airspeed
K Ratio of the jet dynamic pressure to the annulus dynamic
pressure upstream of the holes
K1, K2 Correction factors on the burning time of fuel droplets in Eq. (2-30) K-factor Universal Oil Products factor
xxii
LCV Low calorific value
Lu Flame luminosity
Me Empty weight of the aircraft
Mf Fuel molar mass
MF Aircraft fuel weight
Mmax Maximum structural load of an aircraft
Mo Operating weight of an aircraft
Mp Aircraft payload weight
Mac Combustor Mach number
N1 Constants for units in Eq. (5-1)
P Total pressure
P3 Combustor inlet pressure
Pr Prandtl number
Q Volumetric flow rate
Qf Volumetric fuel flow rate
R Gas constant
Re Reynolds number
S Sulphur content
SL Laminar flame speed
ST Turbulent flame speed
SG Specific gravity
T Temperature
T1 Absolute valve upstream temperature
T3 Combustor inlet temperature
T4 Turbine inlet temperature
xxiii
Tav,vol Average boiling point Temperature by volume
Tc Combustion temperature
Tcrit Critical temperature
Tf Fuel temperature
TF,st Flame temperature at stoichiometric condition
Tg Gas temperature Tr Reduced temperature U Velocity UBO Blowout velocity Uj Jet velocity UL Absolute velocity UR Relative velocity
Uref Combustor reference velocity
Vc Combustion volume
Vcrit Critical volume
W3 Inlet air mass flow rate
Wf Fuel mass flow rate
Wfl Lean fuel mass flow rate
Wfr Rich fuel mass flow rate
We Weber number
Wecrit Critical Weber number
Z Mixture fraction
Greek Letters
Ratio of hole mass flow rate to annulus mass flow rate
xxiv
st Scalar dissipation rate
weak Equivalence ratio at weak extinction
Maximum spray cone half-angle
c Combustion efficiency
e Combustion efficiency (evaporation-controlled)
m Combustion efficiency (mixing-controlled)
Combustion efficiency (reaction-controlled)
Evaporation constant
eff Effective evaporation constant
a Air dynamic viscosity
crit Dynamic viscosity at critical conditions
f Fuel dynamic viscosity
g Gas dynamic viscosity
f Fuel kinematic viscosity
Loading factor
Density
0 Density at inlet conditions
3 Combustor inlet air density
4 Combustor outlet air density
288 Fuel density at 288 K A Air density f Fuel density g Gas density r Relative density Surface tension
xxv
p Pressure drop
P3-4 Pressure differential across the combustor
Pdiff Pressure drop in the diffuser
Pf Pressure differential across nozzle
Phot Pressure loss due to combustion
PL Liner pressure differential
T Temperature rise due to combustion
xxvii
ACKNOWLEDGEMENTS
Many people have contributed to the achievement of this work and I would like to express my gratitude to all who helped me to complete my project.
This M. Sc. project was developed and carried out in the Combustion Laboratory of the department of Mechanical Engineering at Université Laval. This research was funded and made possible by the financial support from FQRNT, ISTP and Pratt & Whitney Canada (P&WC) who provided the seed funding to initiate the project.
Special thanks are certainly very appropriate to Dr. John Hu, Mr. Jasmin Lamoureux and Mr. Parham Zabeti from P&WC who provided very meaningful technical support throughout the project.
I am indebted to my supervisor Professor Alain DeChamplain who was the first to give me a chance in the field of research with confidence, continuous support and undeniable optimism.
I am grateful to our research associate Mr. Bernard Paquet, who always welcomed my questions, taught me several aspects related to gas turbines and for improving this master's thesis with careful review and helpful suggestions. Thank you to my reviewer Rogerio G. Pimentel who gave me good comments to put this master’s thesis at a higher level of scientific rigor.
I am greatly thankful to the whole combustion groups who always provided fruitful discussions and created a nice working environment, great people I met here.
I extend my deepest gratitude to my family and friends for their encouragement and confidence in me.
Finally, you supported me without any doubt and you always encouraged me to push my limits. You were my guide during those years when sometimes I found the mountain too high. Thank you to my wife Eve-Sara.
1
CHAPTER 1-
INTRODUCTION
The use of alternative fuels in aviation is a response to concerns about the environmental impact of the current petroleum based Jet A-1 fuel contributing to the global carbon emission of about 2-3% and to secure future supply growth of aviation sector with the finite fossil energy resources [1]. Many efforts are put in place to provide new options for their production and their environmental sustainability impact namely the Commercial Aviation Alternative Fuels Initiative (CAAFI) focusing to emerge alternative fuel for commercial aviation. However, the processes are still too expensive for large scale use by airlines. The current premise for the approval of biofuels is that they are fully interchangeable with Jet A-1 fuel, called kerosene-like drop-in alternative aircraft fuels, without compromising flight safety [1-4]. The combustion properties can be greatly sensitive to the fuel characteristics and to the operating conditions [5]. Because of the requirements to process biomaterials with the standard specifications for the aviation turbine fuels of the ASTM D7655/D1655, it is essential to have a thorough knowledge of the combustion performance of these biofuels.
The overall project is based on the standard test program ASTM D4054 ‘’Standard Practice for Qualification and Approval of New Aviation Turbine Fuels and Fuel Additives’’. According to the standard, the global project has to meet fuel, material, emissions, performance, endurance and operability requirements. The task for Université Laval described in this thesis is to study the operability influence on cold start and altitude relight experimentally to selected biofuels compared with the petroleum based fuel.
This thesis is divided into eight (8) chapters. The introduction presented the biofuel production, the suitability of these fuels for aviation, the operability tests, and the test plan. The second chapter is the literature and theoretical reviews on different aspects affecting the combustion process in a gas turbine. The combustion performance is shelled with the efficiency, stability, and ignition process and the fuel injection process is also presented. An analysis of the combustor air flow distribution for the two nozzle configurations used (simplex, duplex) is found in chapter three. Chapter four contains an analysis of the variation in properties coupled with the operating conditions for different biofuels. The experimental installation is presented in chapter five with the main components of the rig, followed in chapter six by the cold start and altitude relight results as well as observations from the data reduction process. Chapter seven shows infrared images of the ignition process to demonstrate possible future work on the transient ignition combustion process. Finally, chapter eight presents the conclusions of the project and the achievements obtained with the test rig.
2
1.1.
BIOFUEL PRODUCTION
Since the beginning of the commercial aerospace industry, the reduction of the fuel consumption and emissions with new technology can be demonstrated with time. However, the speed at which these benefits are realized being fairly low due to the high investment cost in the airline industry. Furthermore, it is necessary to keep this new technology in use for around 40 years [6] for investment payback. Hence new technology has to wait for the fleet to be totally replaced before the full benefits are realized. During this transition period, two technologies can provide an instant improvement: the air traffic management and alternative fuels. Air traffic management has the potential for an approximate 15% improvement [1] while better fuel characteristics could help air transporters achieve a carbon neutral position. This research focuses on the use of alternative fuels.
The process for the production of synthetic paraffinic kerosene (SPK) has several pathways. Among these, the Fischer-Tropsch (FT) which converts syngas (from biologic or petrochemical sources) to jet fuel components and also the hydrotreatment of oils commonly called Hydrotreated Renewable Jet (HRJ) that were used in this project. The production is provided by different feedstocks like camelina and jatropha oils as shown in Figure 1-1.
Figure 1-1: Feed stocks from a) Camelina and b) Jatropha
The Universal Oil Products (UOP) Hydrotreated Renewable Jet process is illustrated in Figure 1-2 which presents the difference between the jet fuel and the Bio-SPK process from energy crops. These figures were taken from [4].
3
Figure 1-2 : UOP’s Hydrotreated Renewable Jet Process and Life Cycle Assessment (LCA) result from Michigan Technological University with UOP and Targeted Growth (Figure from reference [4])
These processes produce a fuel of mainly n- and isoparraffines; heavier compounds are added to avoid falling below the lower density limit for aviation fuel specifications. A general advantage of Bio-SPK is the absence of sulphur or traces of other compounds. Sustainable alternative fuels can be described as ones having no negative social, economic and environmental impacts. Sustainable biofuels should not compete with food or fresh water resource or contribute to deforestation, while providing socioeconomic value to local communities where plant grown in addition to having lower lifecycle Green House Gas (GHG) emissions. To evaluate the environmental credentials of any fuel it is necessary to undertake a life cycle analysis which evaluates the total carbon budget during the production, transportation and refinement of any fuel. Based on the results of well-to-wake Life Cycle Assessment (LCA) carried out by Michigan Technological University with UOP and Targeted Growth, oils from jatropha and camelina for Bio-SPK using the UOP renewable jet fuel process showed a reduction of GHG emissions between 65 and 80 percent relative to petroleum derived jet fuel as shown in Figure 1-2. Sustainable biomass feedstock can grow on marginal lands without significant clearing and the current status is to produce emissions similar to the ones produced via conventional crude refinement and combustion. Care must then be taken to uncover the entire well-to-wake profile before assessing the product true environmental impact.
The chemical processing technique converting bio-derived oils (triglycerides and free fatty acids) to Bio-SPKs is presented in Figure 1-3.
4
Figure 1-3: Chemical processing technique converting bio-derived oils to Bio-SPKs (Figure from reference [4])
The procedure is first to clean oil using standard oil to remove impurities. After, UOP’s Renewable Jet Process first reaction converts this oil to shorter chain diesel-range paraffins; the natural oil is converted by removing oxygen molecules and olefins are transformed into paraffins by reaction with hydrogen. The heat of combustion of the fuel is raised by the removal of the oxygen and the thermal and oxidative stability of the fuel are raised by the removal of the olefins. The second reaction is used to crack and isomerize the diesel range paraffins to paraffins with carbon numbers in the jet fuel range. The final product is a Bio-SPK fuel containing the same types of molecules found in conventional petroleum jet fuel. Figure 1-3 presents a summary of the chemical procedure.
Alternative fuels could eventually procure a secure supply with a sustainable solution, but the security of supply also has significant environmental benefits with the reduction of CO2 and particulate emissions [1].
1.2.
SUITABLE FUELS FOR AVIATION
Regardless of the alternative fuels, the main research has been done around the development of «drop-in» fuels which can be used in existing fleet. Even under extreme conditions like cold start and altitude relight, combustion must always take place reliably and safely. The alternative fuels must then be fully
5
interchangeable with the current jet fuel to avoid logistic problems in airports, and because of the long life of commercial jet, any alternative fuel needs to be «backwards compatible» and suitable for use in existing engine technology.
Low aromatic content in alternative fuels represents a concern for the ageing of seals in the aircraft engine. With an aromatic content too low, the seals would shrink and the engine would leak. The standard for the composition in term of percentage of volume is only fixed for the maximum value at 25% according to ASTM D1655. Historically, the aromatic content in synthetic fuel blends is currently fixed at a minimum of 8%; this value have no scientific basis, but conventional kerosene had no problem when it remained above this value [1].The blends used in this project are always above this value with a minimum aromatic value of 10% for both the 90-10 Camelina HRJ/Aromatic and the (75-15) -10 (Camelina/Jatropha) HRJ/Aromatic as will be presented in next section.
In general, hydrocarbon fuels lighter than jet fuel tend to be less viscous and to have higher thermal stability while those with a lower aromatic content atomize and evaporate better. Those denser for the most part behave in the opposite way. Lower carbon or higher hydrogen content in fuels result in more NOx production associated with the higher adiabatic flame temperature [1]. Alternative fuels are not as well understood, but a similar trend is followed. However, the alternative fuels have a complex chemical structure and the fuels used in this project result in higher hydrogen content compared with Jet A-1. Normally, small molecules result in decreased clouding and waxing of the fuel at low temperature. The impact from a change in the carbon-hydrogen ratio will also be presented in a further section.
Figure 1-4 is provided by [1] and shows the relationship between lower calorific value (LCV) and density for different range of fuels [7-9]. The horizontal line represents a constant LCV of 42,8 MJ/kg that is currently used as the minimum limit for aviation fuel specifications. Jet fuel density has specific limits and the bounds represented by the two vertical black dotted lines are 775-840 kg/m³. The different families of fuels are also shown in Figure 1-4 and the black line represents the hydrocarbon group; the blends used in this project are surrounded. For flight, high specific gravity and high calorific value are desirable with a maximum energy release per volume unit and per mass unit. In general, light fuels have high specific energy (energy per mass unit) and heavy fuels have high energy densities (energy per volume unit).
6
Figure 1-4 : Relationship between LCV and density for range of liquid fuels showing limits of Jet A-1 specification (Figure from reference [1])
The Wobbe index (IW) was used to normalize the comparison between alternative fuels and Jet A-1 [10] as it takes into account the required mass of the fuel (SG) and the amount of energy delivered by a given fuel (LCV). The Wobbe index is defined in Eq. (1-1). In Figure 1-4, lines of constant Wobbe index ± 0,05 based on jet fuel is shown in red. For liquid fuels, the Wobbe index equation must be modified to take into account the influence of surface tension and viscosity for their impact on fuel atomization.
W
LCV I
SG (1-1)
The Wobbe index for the blends used in this project selected based by their emissions reduction and supply security are presented in Table 1-1 as well as the base fuel (Jet A-1) to shown their potential in term of energy delivered. The specific gravity (SG) and lower calorific value (LCV) are provided by the National Research Council (NRC).
7
Table 1-1: Wobbe Index of the blended fuels
Fuel (MJ/kg) LCV SG (MJ/kg) IW
Jet A-1 42,916 0,8127 47,6
20-80 Camelina HRJ/Jet A-1 43,087 0,8014 48,1
50-50 Camelina HRJ/Jet A-1 4,340 0,7847 48,9
90-10 Camelina HRJ/Aromatics 43,541 0,7679 49,7
20-80 Jatropha HRJ/Jet A-1 42,999 0,8048 47,9
50-50 Jatropha HRJ/Jet A-1 43,133 0,7931 48,4
(75-15)-10 (Camelina/Jatropha)
HRJ/Aromatics 43,472 0,7707 49,5 70-30 Jatropha HRJ/Jet A-1 43,220 0,7853 48,8
The Wobbe index of the 90-10 Camelina HRJ/Aromatics seems to show an increase of 4,2% in the energy delivered when compared to Jet A-1.
1.3.
RANGE PAYLOAD
Alternative fuels can be used for aviation but they need to be investigated for the effects of fuel characteristics on the operability of an aircraft like cold start and altitude relight. Another way is to look at the payload range diagram for a specific aircraft design and used to evaluate small changes for a substitute fuel like alternative fuels. These values were provided by [1]. The operating weight of an aircraft M0 is usually as close as possible to the maximum structural load at the beginning of the flight. This weight is dependent on the combination of the fuel required for the flight range and the payload expected. The operating weight is made up of the empty weight of the aircraft Me including the payload Mp and the fuel load MF. Eq. (1-2) is assumed constant for M0 and is defined by:
0 max
e p F
M M M M M (1-2)
Certainly if the operating weight exceeds the maximum structural load, the aircraft will have difficulties during takeoff and will not be safe. On the other hand, if the maximum structural load of the aircraft is not met by M0, this particular flight should be justified by other operational criteria because the airframe and the engines are oversized and will result in a greater consumption of energy for this flight.
For an aircraft, the payload and the fuel are restricted by the volume available in the airframe. Whereas the payload weight limit is met before the payload volume limit, the restriction on the fuel volume limit can become significant for an increase in the operating range.
8
The diagram of Figure 1-5 [11] shows the maximum structural load (M0) of a particular aircraft (Me = cte) for various payloads (Mp) and fuel loads (MF). The range limit of this particular aircraft indicates and identifies the
connection between payload and fuel carried.
The range limit for fuels with low density and high calorific value for all possible payloads is limited by the volume of the fuel tanks. In this case, the situation where the maximum structural load is not met by the weight lead to inefficiencies and are not recommended flight cycle. If the optimisation of aircraft is based on fuel type, no aircraft will be modelled with liquid hydrogen or liquid methane, as the volume is the limitation and the aircraft needs to have enough fuel for takeoff, landing and meeting the Federal Aviation Administration (FAA) requirements [1] with existing fuel tanks. Figure 1-5 shows the changes in the range performance of a Boeing 747-200B due to alterations to the hydrocarbon fuel used for flight. The data was provided by [12].
Figure 1-5 : Changes to the range performance of Boeing 747-200B due to alterations to the hydrocarbons fuel used for flight (Figure from reference [1])
The Boeing 747-200B reaches the fuel volume limitation at a payload of 70% (63 000 kg) of its maximum payload (90 000 kg). The base fuel is the average UK jet fuel with a density of 798 kg/m³ and a LCV of 42,4 MJ/kg. Figure 1-5 compares conventional hydrocarbon fuels and shows that a small outperforming range is possible at maximum payload with fuels in the density range 560 < < 775 kg/m³ over kerosene. As these lighter fuels are limited by the tank volume, this results in a reduced range in the range/payload pay-off region even if these fuels offer small increase in range at the maximum payload. The greatest increase seen is around 1,2% in the range at maximum payload and represents only a small benefit with a change in the hydrocarbon fuel. Fuels in the density range 920 < < 1200 kg/m³ are dense enough to be limited by the
9
operational weight of the aircraft and not by the volume of the fuel tank. However, the range possible at the maximum payload decreases because the calorific value of these fuels is lower than kerosene.
The creation of a set of curves for alternative fuels was more difficult, but some data was available in the literature and [1] shows a diagram with trends for different alternative fuels. The discrete points were used to create Figure 1-6 showing the range payload diagram like Figure 1-5 for several possible fuels. A representation of the classes of alternative fuels suggested in the literature and on the recent test flight including Alcohols, fatty acid methyl ester (FAMEs) and SPKs [13]. The fuels used in the project were mostly like SPK and consisted of a narrower band of straight chain hydrocarbons than conventional kerosene. The SPK fuel presented in Figure 1-6 represents the limit of paraffinic hydrocarbons. The SPK fuels used during this project were blended either with other synthetic hydrocarbons or with conventional kerosene to meet the aviation fuel specifications. The approved SPK fuels fall between the SPK limit and the average jet fuel data (UK Jet). The analysis considers only the neat alternative fuels, although they are not suitable on their own but can be blended with conventional hydrocarbons to reach the suitable range of densities and specific energies. Figure 1-6 shows the changes in the range performance of a Boeing 747-200B due to the use of alternative fuels from the data of [13]. Globally, the SPK limit offers a small increase in range at the maximum payload because the calorific value of these fuels is higher than the UK Jet. However, due to their lower density to counteract the better calorific value, the possible range is similar to the base fuel that gives another favorable argument towards the use of biofuels.
Figure 1-6 : Changes to the range performance of a Boeing 747-200B due to the use of alternative fuels (Figure from reference [1])
10
1.4.
OPERABILITY TESTS OF NEW BIOFUELS
As seen in section 1.3, the range payload of these new biofuels do not have any serious operating penalties compared to the conventional Jet A-1 fuel, it is also critical to know if any safety issues could be of any concern. To study the flight safety aspect, a joint university – industry research program funded by Pratt & Whitney Canada, NSERC, ISTP and MDEIE on new biofuels was pursued at the Combustion Laboratory of Université Laval to characterise the operability envelope of jet engines, especially cold start and altitude relight. The objective of the proposed research is to identify the most promising drop-in biofuels for use in aircraft gas turbines and their potential to reduce greenhouse gases already expected from this new generation of environmental friendly fuels. The test program follows the ‘‘ASTM D4054 Standard Practice for Qualification and Approval of New Aviation Turbine Fuels and Fuel Additives’’. Cold start and altitude relight represent critical conditions for the operating envelope when using a biofuel with different properties in actual gas turbine combustors. In order to ensure adequate ignition characteristics, the experimental performance and properties of different biofuels are compared to Jet A-1 as the baseline fuel. This investigation reviews proper engine operability and allows determining the minimum and maximum fuel-air ratios for these conditions. The main variables to simulate relight and cold start are pressure and temperature. They are the critical factors to consider for successful ignition. Another significant parameter to consider is the amount of energy available to ensure ignition, provided by the igniter and a sufficiently rich mixture. Relight at altitude is a critical condition with a limited window of opportunity; therefore, a quite higher fuel-air ratio by delivering enough fuel to evaporate greatly assists the eventual start of the engine. The high altitude test facility at Université Laval is able to provide cold start down to -40°C and relight up to an altitude of 15 200 m (50 000 ft). This rig represents a new way to test for these special conditions with the use of a steam ejector to allow covering a wide range of pressures to simulate different flight speeds at different altitudes.
This study is concerned with altitude relight after an unexpected engine shutdown that is considered windmilling to maintain its airflow as if the aircraft can sustain a flight speed of 500 km/h (250 knots). To reproduce similar temperature and pressure conditions at various altitudes at the inlet of a generic but representative gas turbine combustor, the high altitude test facility was designed accordingly. To evaluate their relative combustion performance, cold start and altitude relight maps are obtained for seven new biofuel blends obtained from camelina or jatropha mixed with Jet A-1 fuel with various aromatic contents and compared to Jet A-1 as the baseline fuel.
11
1.5.
TEST PLAN
The overall goal of the test program is to examine the effects of fuel properties on the ignition performance of a generic can combustor used with two different air assist pressure atomizers (simplex, duplex). These P&WC pressure atomizers have been selected because they have already been used for this kind of tests thus giving a basis for comparison [14]. The advantage of can combustor testing is that it allows a quick and cost effective investigation over a broad range of parameters from which a final test plan can be developed for investigation of real combustors used in the P&WC family of turboprop and turbofan.
For all ignition tests, only the primary stage is fed for the simplex and the duplex atomizers. The engine series using this simplex atomizer is used axially with the combustor compare with this duplex atomizer used tangentially for its engine series. This duplex atomizer has a primary Flow Number (FN) higher requesting more pressure for the same volumetric flow compare with this simplex atomizer.
The cold start tests were performed at sea level with various air temperatures while changing the pressure differential across the combustor to determine the minimum fuel-air ratio for a successful ignition under cold conditions. Ignition was attempted using a spark from a gas turbine ignition unit for a maximum duration of 10 s. If sustained combustion was not achieved within 10 s, ignition was deemed to be unsuccessful for that experimental point. In case of successful ignition within 10 s, the igniter is turned off and the flame must be stable for at least 5 s. The ignition limits at the chosen pressure differential across the combustor are characterised by three successful ignition attempts. Due to safety issue (backfires through the steam ejector bleed valve) and equipment constraint (fuel pump maximum pressure), it was only possible to experimentally establish the lower ignition limit for the cold start tests. The Test Procedure is presented in Appendix A. Table 1-2 presents the Cold Start Test Matrix for the simplex and duplex nozzle configurations. To calculate the FAR, the fuel mass flow rate is divided by the air mass flow rate and the value of fuel mass flow rate becomes the unknown variable at each operating condition. All results are presented in section 6.1 with Figure 6-1 to Figure 6-8.
12
Table 1-2: Cold Start Test Matrix
P3 (Pa) T3 (K) P3-4 (in H2O) P3-4 (Pa) P3-4/P3 (%) W3 (kg/h) Wf (kg/h) 101 325 283 1 249 0,25 54 TBD 101 325 283 2 498 0,51 77 101 325 283 3 748 0,76 94 101 325 283 4 997 1,01 108 101 325 283 5 1246 1,26 121 101 325 283 7,5 1869 1,90 148 101 325 283 10 2492 2,53 171 101 325 256 1 249 0,25 57 TBD 101 325 256 2 498 0,51 81 101 325 256 3 748 0,76 99 101 325 256 4 997 1,01 114 101 325 256 5 1246 1,26 127 101 325 256 7,5 1869 1,90 156 101 325 256 10 2492 2,53 180 101 325 239 1 249 0,25 59 TBD 101 325 239 2 498 0,51 83 101 325 239 3 748 0,76 102 101 325 239 4 997 1,01 118 101 325 239 5 1246 1,26 132 101 325 239 7,5 1869 1,90 161 101 325 239 10 2492 2,53 186 101 325 233 1 249 0,25 60 TBD 101 325 233 2 498 0,51 84 101 325 233 3 748 0,76 103 101 325 233 4 997 1,01 119 101 325 233 5 1246 1,26 133 101 325 233 7,5 1869 1,90 163 101 325 233 10 2492 2,53 189
The altitude relight tests were performed at altitudes ranging from 4 500 to 10 500 m (15 000 to 35 000 feet) for a given flight speed of 500 km/h (250 knots) with various air flows or pressure differentials (P3-4) across the combustor to determine again the minimum and the maximum fuel-air ratios (FAR) for a successful altitude relight test and the maximum blowout pressure differential. Table 1-3 & Table 1-4 present the Altitude Relight Test Matrix for the simplex and duplex nozzle configurations respectively. All results are presented in section 6.2 with Figure 6-9 to Figure 6-18.
13
Table 1-3: Altitude Relight Test Matrix for Simplex Nozzle Configuration
Altitude m (ft) (km/h) IAS Ma (Pa) P3 (K) T3 P(%) 3-4/P3 Wfr (kg/h) (kg/h) Wfl 4,5 k (15 k) 500 0,5 67 964 271 0,7 TBD 500 0,5 67 964 271 0,9 500 0,5 67 964 271 1,57* 6 k (20 k) 500 0,56 57 555 264 0,7 500 0,56 57 555 264 0,9 500 0,56 57 555 264 1,41* 7,5 k (25 k) 500 0,62 48 733 257 0,5 500 0,62 48 733 257 0,7 500 0,62 48 733 257 1,11* 9 k (30 k) 500 500 0,69 0,69 41 495 41 495 251 251 1,05* 0,5 10,5 k (35 k) 500 0,78 35 636 245 0,5 500 0,78 35 636 245 0,99*
*Corresponding ∆P3-4/P3s to represent the experimental nose of the relight curves
Table 1-4: Altitude Relight Test Matrix for Duplex Nozzle Configuration
Altitude m (ft) (km/h) IAS Ma (Pa) P3 (K) T3 P(%) 3-4/P3 Wfr (kg/h) (kg/h) Wfl 4,5 k (15 k) 500 0,5 67 964 271 1,0 TBD 500 0,5 67 964 271 3,1 6 k (20 k) 500 0,56 57 555 264 0,7 500 0,56 57 555 264 0,9 500 0,56 57 555 264 2,82* 7,5 k (25 k) 500 0,62 48 733 257 0,5 500 0,62 48 733 257 0,7 500 0,62 48 733 257 1,69* 9 k (30 k) 500 500 0,69 0,69 41 495 41 495 251 251 1,12* 0,5 10,5 k (35 k) 500 500 0,78 0,78 35 636 35 636 245 245 0,95* 0,5
15
CHAPTER 2-
LITERATURE & THEORY REVIEW
This project characterizes different biofuel blends for cold start and altitude relight in aero engines in terms of flame stability limits. These results will be used to determine the stability curves determining the possibility of using biofuels in current aircraft engines. To compare these biofuels, it is necessary to have an understanding of the combustion performance and the fuel injection. The theory reviewed will be driven by the combustion efficiency, the combustion stability and the ignition process before combustion. The fuel injection is an important factor during the ignition process and will be overflown by the mechanism of atomization with the breakup of the fuel drops by the atomizers and the concept of mean drop size.
2.1.
COMBUSTION PERFORMANCE
Combustion chambers must provide stable chemical reactions over a wide range of operating conditions; thereby the level of combustion efficiency required is close to 100%. During ground starting another important requirement is to provide easy and reliable ignition while the engine is being cranked up to its self-sustaining speed. Additional requirement of the aircraft gas turbine is a rapid relight of the combustor after a flameout in flight. The most important parameters affecting combustor performance of gas turbine are combustion efficiency, stability and ignition.
2.1.1. COMBUSTION EFFICIENCY
High combustion efficiency of at least 90% is necessary for favorable relight condition because the rotation of the compressor is only induced by the ram effect when the engine is not operating. During windmilling at altitude relight, the pressure and temperature of the air flowing through the combustor are close to ambient values. At high altitudes, pressure and temperature are so low that the stability limits are very narrow. To compensate the combustion inefficiency, the engine control system supplies more fuel to the combustor and this extra fuel may lead to a rich extinction of the flame. To ensure adequate levels of combustion efficiency during altitude relight, the combustor size must then be large enough to reduce wall effects.
During combustion, the airflow temperature is raised with an efficient fuel burning. Combustion efficiency can be related to the operating variables like air pressure, temperature, mass flow rate and combustor dimensions. The time available for combustion is inversely proportional to the airflow rate and the combustion efficiency may be expressed [15] as:
1 1 1 1 1 +evaporation rate mixing rate reaction rate
16
Evaporation, mixing and chemical reaction, but rarely all three at the same time govern the maximum rate of heat release under any given operating condition. Figure 2-1 indicates the regions where chemical reaction rate, droplet evaporation, and diffusion are important [20]. This figure gives a good idea of the major factors affecting combustion. Separate effects on combustion efficiency by chemical reaction, mixing and evaporation rates will be presented in the next sections.
Figure 2-1 : Controlling Parameters in a Gas Turbine Combustor (Figure from reference [20])
In combustion, one of the most important aspects is the spray quality, represented by the diameters of the droplets produced. The Sauter mean diameter (SMD) is defined as the diameter having the same surface to volume ratio as the entire jet, ie. D32. The general idea is to replace the actual jet by a fictitious jet having
droplets of a single diameter and which retains the essential characteristics of the original jet. The controlling parameters in Figure 2-1 are presented as a function of pressure for a given SMD (D32) for the droplets. The
super-critical region and the zone for unsteady states are derived from the work of Brzustowski [16]. The effects of variable fuel properties could displace the boundaries, but the principle remains the same.
2.1.1.1. REACTION-CONTROLLED SYSTEMS
Under conditions where the overall rate of heat release is limited by chemical kinetics, two approaches for describing combustion efficiency are most widely used [17]; the burning velocity and the stirred reactor models. The first one was used by Greenhough and Lefebvre [17] and this model derived a parameter correlated with experimental data on
17
combustion efficiency obtained over wide ranges of pressure, temperature, and airflow rate for various designs of a combustion chamber. The second one was provided by Bragg [18], Greenhough and Lefebvre [17] and the approach regarded the combustion zone as a perfectly stirred reactor into which fuel and air are fed at a constant rate and are instantaneously mixed with all the other material within the zone.
The burning velocity model is described briefly below; for further details, the original paper and the subsequent developments are in [19]. Combustion efficiency is defined as:
3
(heat released in combustion)/(energy available in fuel),
( ) / ( ) c g f T pA S c T FAR W LCV (2-2) where, g = gas density (kg/m³) Af = flame area (m²)
ST = turbulent flame speed (m/s)
cp = specific heat at constant pressure (J/(kg-K))
T = temperature rise due to combustion, (K) FAR = fuel-air ratio by mass
W3 = air mass flow rate (kg/s)
LCV = low calorific value of fuel, (J/kg)
By definition cpT = FAR·LCV and also the flame area Af can be assumed to be proportional to the combustor reference area, Aref. Then Eq. (2-2) simplifies to:
c S UT / ref (2-3)
where Uref can be expressed in terms of W3, P3, and Aref and where ST can be expressed in terms of burning velocity and turbulence intensity (related to the liner pressure loss factor PL/qref). Eq. (2-3) then becomes
0,5
3 ( 3 ) exp 3/ / 3 /
m m
c P A P Dref ref T b W P qL ref (2-4)
Lefebvre and Halls [19] demonstrated that combustion efficiency data obtained during low pressure tests on several types of combustion chambers could be satisfactorily correlated by assigning values to m and b of 0,75 and 300 respectively. The pressure loss term varies little for different combustor geometries, then Eq. (2-4) becomes what is referred to the loading parameter if the pressure loss term is neglected.
1,75 0,75 3 ref ref exp 3/ 300 / 3
18
Combustion efficiencies at flow conditions lying outside the capability of a test facility may then be predicted with reasonable accuracy. However, to be valid, the combustion performance of the conditions extrapolated with this equation should not be limited by fuel evaporation, in other words evaporation needs to be fast. The most arduous conditions for all types of engines are those at which the inlet pressure P3 and temperature T3 are low like the ones encountered at high altitude. The conditions explored during the tests performed in this project correspond to an engine relight after a flameout at high altitude. Compressor falls rapidly to its windmilling value and the pressure and temperature decrease approximately to ambient values. During the relight sequence, the ignition system relights the combustor to accelerate the engine up to its normal rotational speed. At this condition, the combustion efficiency is around 80% which is approximately the minimum acceptable value for a successful relight [5]. Low combustion efficiency could also result in a rich extinction of the flame as previously discussed.
The parameter ignores the influence of drop size on combustion efficiency; therefore the atomization should not affect the combustion efficiency. It has been shown experimentally by Odgers et al. [20] that over a wide range of combustor types and operating conditions; droplets size is irrelevant to combustion efficiency provided that atomization and evaporation quality are good enough.
In the stirred reactor model, the burned material leaves the zone at a constant rate with temperature and composition identical within the zone. The stirred reactor approach is related to the reaction temperature and to the heat-release rate. This leads to some difficulties and drawbacks like the combustion efficiency that must be known to calculate the reaction temperature. However, authors in [5] found that expressing the overall heat-release rate in terms of air inlet temperature, as illustrated in Eq. (2-6) and (2-7) avoided this problem.
2 3 cexp 3/ 300 / 3 for 2, f P V T W n (2-6)
1,75 3 cexp 3/ 300 / 3 for 1,75, f P V T W n (2-7)The burning zone is emphasized in the burning velocity model and the cross-sectional area has importance while the stirred reactor model rather uses the volume of combustion. The parameter procures a useful advantage for the preliminary design of any new combustor in order to meet combustion efficiency requirements that ensures adequate combustion stability and more specifically to assess low temperature and pressure conditions prevailing for cold start or altitude relight.
19
2.1.1.2. DIFFUSION OR MIXING-CONTROLLED SYSTEMS
If chemical reaction rates and evaporation are both infinitely fast, Eq. (2-1) becomes
mf mixing rate/air flow rate (2-8)
A turbulent air jet and the surrounding gas are mixed at the rate of the product of the density gradient, the mixing area and the eddy diffusivity. The last term can be assumed proportional to the product of the turbulent velocity in the air jet and a mixing length ℓ, then
2 2
mixing rate = (eddy diffusivity)(mixing area)(density gradient) ( )( )( / ) j j U U (2-9) Considering ( / ) 0,5 j L
U P and substituting in Eq. (2-9),
2 0,5 0,5
3 3 3
mixing rate (P /T )( P PL/ ) (2-10) Combustion efficiency depends on the ratio of the mixing rate to the airflow rate when the system is controlled by the mixing limits. Then, if the turbulence scale is proportional to combustor size, then Eq. (2-10) becomes
0,5 0,5
3 3 3 3
( / )( / )
m f P Aref W T P PL (2-11)
Sub-atmospheric pressures being reached during altitude relight; it is then possible to see the decrease in mixing efficiency with P3.
2.1.1.3. EVAPORATION-CONTROLLED SYSTEMS
For systems with fuel evaporation where the mixing and reaction rates are fast enough, the evaporation is the rate-controlling step. The average rate of evaporation of a fuel spray is expressed as:
/ 02
f A eff c
W V FAR D (2-12)
20 where D0 is the initial Sauter Mean Diameter of the
spray, FAR is the fuel-air ratio by mass, Vc is the
combustion volume, and λeff is the effective evaporation constant. Combustion efficiency for the evaporation-controlled systems is obtained as the ratio of the rate of fuel evaporation within the combustion zone to the rate of fuel supply
3 3 f f e c c W W FAR W f FAR W (2-13)
where FARc is the fuel-air ratio in the combustion zone, and fc is the fraction of the total combustor airflow W3 employed in combustion. Substituting Wf from Eq. into Eq. (2-13) gives
23
/
e eff g cV f W Dc o (2-14)
For conditions where fuel evaporation is known to be the rate-controlling step, Eq. (2-14) may be used for calculating combustion efficiency. Combustion efficiency is improved by increased gas pressure, combustion volume, turbulence intensity, fuel volatility and also deteriorated by increased mean droplet size and air mass flow rate. Eq. (2-14) allows ηe to exceed unity; it simply means that the time required for fuel evaporation is less than the time availed for full vaporisation within the primary recirculation zone. Therefore, evaporation efficiency should be assigned a value of unity.
A useful dimensionless efficiency parameter would relate the influence of fuel type on combustion efficiency of any alternative fuel «a» to some baseline fuel «b», provided that both fuels are burned under the same operating conditions within the same combustor. From Eq. (2-14), a better assessment of the impact of replacing aviation jet fuel with some alternative fuel can then be made with Eq. (2-15):
/ / 2 / / 2
ca cb eff Do a eff Do b (2-15)
In case of high combustion efficiency, say greater than 90%, Eq. (2-16) is more accurate than (2-15) between the predicted and measured values according to [5].
2
/ 2
/ 2
/ / 2
cb ca eff Do a eff Do b (2-16)
Figure 2-4 : Evaporation Rate Controlling Parameters
21
2.1.1.4. REACTION- AND EVAPORATION-CONTROLLED SYSTEMS
Fuels with low volatility burning at low pressures could have a rate of heat release limited by both chemical reaction and evaporation rates in some situation. The combustion efficiency is then obtained as the product of the reaction efficiency and the evaporation efficiency.
c
e (2-17)The fraction of the fuel that is evaporated within the combustion zone is the first term on the right hand side of Eq. (2-17). An evaporation efficiency of one or higher denotes that the entire amount of fuel vapor will be used into the combustion chemical reaction, then ηc = ηθ. Available experimental data from [21] on combustion efficiency conducts to the following expression for the reaction and evaporation efficiencies.
1,3 3 3 1 exp 0,022P Vcexp Tc/ 400 /f Wc (2-18) 6 3 2 3 1 exp 36 10 / e P Vc eff T D f Wc o c (2-19) where,P3 = combustor inlet pressure (kPa) W3 = total combustor airflow (kg/s)
Vc = combustion volume (m³) D0 = Sauter mean diameter of the fuel spray (µm) Tc = combustion temperature (K) λeff = effective evaporation constant (mm²/s) fc = fraction of air used in combustion
Also,
3
c c
T
T
T
(2-20)where ΔTc is obtained from standard temperature rise charts for the fuel in question and these investigations
and correlations normally apply to petroleum-based conventional jet fuels. This approach was studied by [21] for synthetic and bio-based jet fuels and its validity still needs to be demonstrated.
2.1.2. COMBUSTION STABILITY
Combustion must be maintained over a wide range of operating conditions especially for an aircraft combustion chamber, which must sometimes operate at low pressure and temperature. Also, the fuel-air ratios sometimes lie outside of the normal combustion limits for hydrocarbons/air mixtures. During the combustion initiation, the flame needs to be sustained in highly turbulent airstreams with velocities many times greater than
Figure 2-5 : Reaction and Evaporation Rate Controlling Parameters
![Figure 1-3: Chemical processing technique converting bio-derived oils to Bio-SPKs (Figure from reference [4])](https://thumb-eu.123doks.com/thumbv2/123doknet/3273582.93897/32.918.106.773.107.517/figure-chemical-processing-technique-converting-derived-figure-reference.webp)
![Figure 1-4 : Relationship between LCV and density for range of liquid fuels showing limits of Jet A-1 specification (Figure from reference [1])](https://thumb-eu.123doks.com/thumbv2/123doknet/3273582.93897/34.918.115.763.110.553/figure-relationship-density-liquid-showing-specification-figure-reference.webp)
![Figure 1-5 : Changes to the range performance of Boeing 747-200B due to alterations to the hydrocarbons fuel used for flight (Figure from reference [1])](https://thumb-eu.123doks.com/thumbv2/123doknet/3273582.93897/36.918.225.650.442.708/figure-changes-performance-boeing-alterations-hydrocarbons-figure-reference.webp)
![Figure 1-6 : Changes to the range performance of a Boeing 747-200B due to the use of alternative fuels (Figure from reference [1])](https://thumb-eu.123doks.com/thumbv2/123doknet/3273582.93897/37.918.229.725.656.942/figure-changes-range-performance-boeing-alternative-figure-reference.webp)